Figure 1.

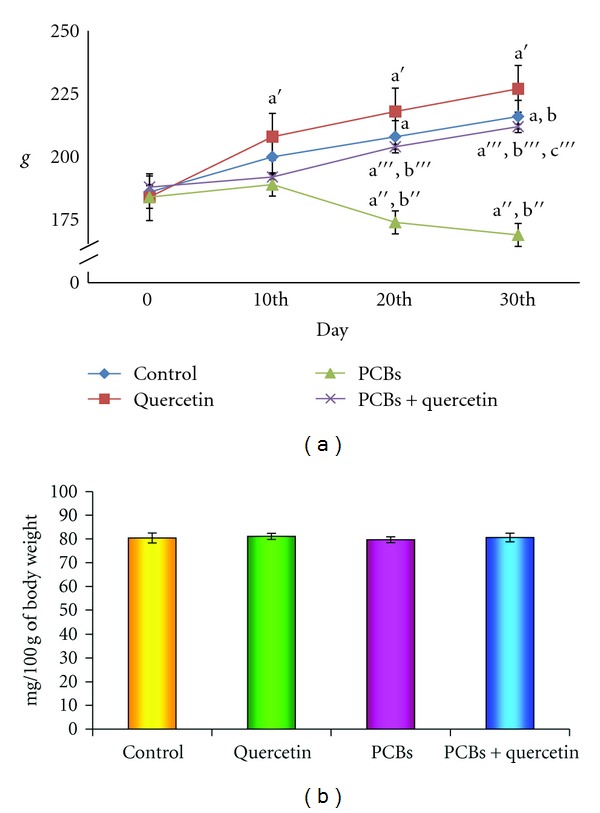
(a), (b): Effect of quercetin on body weight and relative hippocampal weight of PCBs-exposed adult rats. Each bar represents mean ± SEM of 6 animals. Statistical significance is at P < 0.05 (a: Control versus others; b: Quercetin versus PCB, PCB + Quer; c: PCB versus PCB + Quer). a: Control 0 Day versus 10th day, 20th day, and 30th day; b: Control 10th day versus 20th day and 30th day; a': Quercetin 0 day versus 10th day, 20th day, and 30th day; b':Quercetin10th day versus 20th day and 30th day; a”: PCB 0 day versus 10th day, 20th day, and 30th day; b”: PCB 10th day versus 20th day and 30th day; a”': PCB + Quercetin 0 day versus 10th day, 20th day, and 30th day; b”': PCB + Quercetin10th day versus 20th day and 30th day; c”': PCB+Quercetin 20th day versus 30th day.
