

Abstract
The inhibitors of growth (ING) family of tumor suppressors consists of five homologous proteins involved in chromatin remodeling. They form part of different acetylation and deacetylation complexes and are thought to direct them to specific regions of the chromatin, through the recognition of H3K4me3 (trimethylated K4 in the histone 3 tail) by their conserved plant homeodomain (PHD). We have determined the crystal structure of ING4-PHD bound to H3K4me3, which reveals a tight complex stabilized by numerous interactions. NMR shows that there is a reduction in the backbone mobility on the regions of the PHD that participate in the peptide binding, and binding affinities differ depending on histone tail lengths Thermodynamic analysis reveals that the discrimination in favor of methylated lysine is entropy-driven, contrary to what has been described for chromodomains. The molecular basis of H3K4me3 recognition by ING4 differs from that of ING2, which is consistent with their different affinities for methylated histone tails. These differences suggest a distinct role in transcriptional regulation for these two ING family members because of the antagonistic effect of the complexes that they recruit onto chromatin. Our results illustrate the versatility of PHD fingers as readers of the histone code.
Regulation of chromatin dynamics dictates the outcome of fundamental nuclear processes such as DNA transcription replication and repair (1–3). It is central to cell homeostasis, because alterations in chromatin structure contribute to the development of cancer and other human diseases (4). The ING6 family of tumor suppressors consists of five homologous proteins implicated in chromatin remodeling, growth arrest, and, in cooperation with p53, senescence and apoptosis (5–7). They are frequently deregulated in different types of cancer (8) and contain a conserved C-terminal PHD finger (9) that is present in many nuclear proteins involved in gene expression regulation and chromatin remodeling (10). They form stable histone acetylation or deacetylation complexes (11) and are thought to direct them to specific regions of the chromatin through binding of their PHD fingers to histone 3 N-terminal tails trimethylated at lysine 4 (12, 13). These binding properties link ING proteins with actively transcribed genes, because H3K4 trimethylation is a hallmark of active genes (14). The recognition of H3K4me3 by ING2 is critical for the occupancy of the mSin3A-HDAC1 complex at the promoter of the cyclin D1 gene, which results in histone deacetylation and transcriptional repression of the active gene in response to DNA damage (15). This result suggests a general active transcriptional repression role for ING2; nonetheless, the biological outcome of the recognition of methylated histone tails by the other ING proteins is still unclear. Different PHD fingers link H3K4me3 recognition with gene activation, such as the PHD of the bromodomain PHD finger transcription factor, which helps to recruit the nucleosome remodeling factor complex to target promoters modulating transcription initiation (16, 17). Hence, the function of the PHD-H3K4me3 binding event and its effect on transcription are determined by the particular protein reader of this histone code mark.
We have solved the crystal structure of the PHD of ING4 bound to H3K4me3 tail, which remarkably shows a different mode of binding with respect to the previously reported for ING2, with a longer region of the histone tail participating in the interaction with ING4. The structure of the complex provides new insights into the determinants of the different binding affinities measured for the two domains (13) and allows for the interpretation of NMR data showing the stabilizing effect of C-terminal extensions of the histone peptide and a reduced backbone mobility in the PHD on peptide binding. Isothermal titration calorimetry (ITC) measurements show that the discrimination in favor of the methylated lysine is due to more favorable solvation entropy contributions.
EXPERIMENTAL PROCEDURES
ING4 Proteins and Histone 3 Peptides Sample Preparation—The clone of ING4 PHD finger 188–246 was made from the 188–249 construct using a QuikChange mutagenesis kit (Stratagene). Protein expression and purification was done as previously described (13). Synthetic lyophilized peptides were purchased from NeoMPS and correspond to histone 3 residues 1–10 (ARTKQTARKS) or residues 1–15 with an extra Tyr residue at the C terminus (ARTKQTARKSTGGKAY) (13) with the four possible methylation states at lysine 4. The concentrations of the peptide stock solutions were measured by amino acid analysis (10 residue peptides) or by ultraviolet absorbance (using the absorbance of the aromatic side chain of the tyrosine residue in the 15 + 1-residue-long peptides).
Crystallization and Structure Determination—Crystals of ING4(188–246) bound to H310K4me3 peptide were grown by the hanging drop vapor diffusion method at 5 °C. The pure protein was dialyzed against 10 mm Tris, pH 6.5, 150 mm NaCl and 2 mm dithiothreitol and concentrated to 1.4 mm. The H310K4me3 peptide was used at a concentration of 35 mm in water. The complex was formed by mixing the PHD and the peptide in a 1:2 molar ratio. Crystallization drops were set up by mixing 1 μl of protein·peptide complex with 1 μl of reservoir solution of 35% polyethylene glycol 6000 and 0.4 μl of 100 mm CoCl2. Needles grew overnight but were not suitable for diffraction experiments. Good quality crystals appeared after using these needles for seeding in fresh drops that were incubated for 3 h at 4 °C. The crystals grew in ∼3 days and reached final dimensions of 0.15 × 0.01 × 0.01 mm3. Prior to data collection, protein complex crystals were immersed in the precipitant solution containing 5% (v/v) ethylene glycol, followed by rapid cooling in liquid nitrogen. A complete x-ray diffraction data set was collected at the beamline ID 29 (European Synchrotron Radiation Facility, Grenoble, France). The data were indexed, integrated, and scaled with HKL2000 (18). The crystals belonged to the P43 space group with cell dimensions a = b = 68.51 Å, c = 28.51 Å, and α, β, γ = 90°. Matthews coefficient and self-rotation function indicated the presence of two molecules in the asymmetric unit, with a solvent content of 36.78%. Molecular replacement was performed with Phaser (19) using the Protein Data Bank entry 2G6Q as model after removal of the bound peptide. Refinement was carried out with REFMAC5 (20) including rigid body refinement as the first step. Several rounds of iterative rebuilding with O (21) and refinement were performed. Two molecules of 1,4-dithiothreitol and solvent water molecules were placed into the electron density using Arp/Warp (22). The final model contains two complexes in the asymmetric unit: the first was constituted by ING4(195–244)/H3(1–6), and the second was constituted by ING4(191–244)/H3(1–10). Data collection details and statistics of the refinement can be found in Table 1. The coordinates have been deposited with the Protein Data Bank (accession code 2VNF).
TABLE 1.
X-ray data collection and refinement statistics
| Data collectiona | |
| Environment | ADSC detector, ESRF, beamline ID29 |
| Wavelength | 1.072 Å |
| Cell dimensions (Å, °) | a = 68.51, b = 68.51, c = 28.51, α = β = γ = 90 |
| Resolution (Å) | 68.51-1.76 (1.82-1.76) |
| Space group | P43 |
| Unique reflections | 12817 |
| Average multiplicity | 3.8 (2.6) |
| Completeness (%) | 96.9 (86.8) |
| Rmergeb | 0.075 (0.38) |
|
<I/σI)>
|
9.9 (1.7)
|
| Refinement | |
| Number of reflections (completeness, %) | 12178 (96.92) |
| Resolution range (Å) | 68.51–1.76 |
| R factor/Rfree (%) | 15.62/22.67 |
| Number of protein atoms (average B, Å2)c | 929 (30.61) |
| Number of water molecules (average B, Å2)c | 129 (38.31) |
| Root mean square bond length (Å) | 0.012 |
| Root mean square bond angle (°) | 1.816 |
| Ramachandran plot outliers (number, %)d | 3, 2.5 |
NMR Spectroscopy—NMR spectra were recorded at 25 °C in
20 mm sodium phosphate, pH 6.5, 50 mm NaCl, 1
mm dithiothreitol, 5% (v/v) 2H2O2,
0.01% Na3N in a Bruker AVANCE 600 as described
(13). Titrations were
performed by stepwise addition of concentrated (5–6 mm)
peptide stock solutions into 600-μl samples of 50 μm PHD. The
dissociation constants were determined as described
(13). The spectra to measure
the differences in the chemical shift perturbation (CSP) upon ING4 binding to
H310K4m3 or H315K4m3 were obtained under identical
conditions with two samples containing 50 μm PHD and a 4-fold
excess of each peptide, which were simultaneously dialyzed against the same
buffer. Backbone 15N T1, T2, and
{1H}-15N heteronuclear NOE measurements
(23) were performed on a
Bruker AVANCE 700 spectrometer on a 0.83 mm uniformly
15N labeled PHD sample with or without 1.66 mm peptide.
For free ING4-PHD ten time points (20, 60, 140, 240, 360, 460, 660, 860, 1100,
and 1300 ms) were collected for T1 measurements, and a different
set of nine time points (16, 32, 63, 110, 158,190, 222, 270, and 396 ms) was
collected to measure the T2 values. T1 and T2
experiments were acquired with eight scans and a repetition delay of 3 s,
whereas each {1H}-15N NOE spectrum (both saturated and
nonsaturated one) was acquired with 136 scans and with an overall recycling
delay of 10 s to ensure the maximal development of NOEs before acquisition and
to allow solvent relaxation, thus avoiding transfer of saturation to the most
exposed amide protons of the protein from scan to scan
(24). Relaxation measurements
for ING4-PHD bound to H3K4m3 peptides were carried out under the same
conditions as those of the free form, but with one more sample time for
T1 experiment (1600 ms) and different number of scans of the
{1H}-15N NOE experiment 148 and 128 scans in the case of
H310K4me3 and H315K4me3, respectively. To check the
reproducibility of the relaxation measurements, the T1 experiments
for free ING4-PHD and the {1H}-15N NOE experiment for
ING4-PHD bound to H315K4me3 were measured twice yielding the same
results. The relaxation times were calculated via least squares fitting of
peak intensities to a two parameter exponential function, using the rate
analysis routine contained in the NMRView program
(25). The heteronuclear NOEs
were calculated from the ratio of cross-peak intensities in spectra collected
with and without amide proton saturation during the recycle delay.
Uncertainties in peak heights were determined from the standard deviation of
the distribution of intensities in a region of the HSQC spectra where no
signal and only noise was observed. The principal components of the inertia
tensor were calculated with the Pdbinertia program (A. G. Palmer III, Columbia
University) using the first model of the ensemble of 20 structures determined
by NMR (Protein Data Bank entry 2JMQ), which is the best one according to
restraint violations data and the x-ray structure for the
ING4-PHD·H3K4me3 complex. The estimation of the overall correlation
time was obtained from the ratio of the mean values of T1 and
T2, which were calculated from a subset of residues with little
internal motion and no significant exchange broadening. This subset excluded
those residues with NOEs smaller than 0.65 and also those residues with
T2 smaller than the average minus one standard deviation, unless
their corresponding T1 values were larger than the average plus one
standard deviation (26). The
diffusion tensor, which describes the rotational diffusion anisotropy, was
determined by two approaches
(27,
28) using the programs
r2r1_diffusion and quadric_diffusion (A. G. Palmer III, Columbia University).
The calculations failed when using the errors in T1 and
T2 estimated by Monte Carlo simulations, which were unrealistically
low. Therefore, the errors were scaled up by the minimum factor that allowed
an interpretation of the data in terms of a rotational diffusion tensor. This
procedure resulted in average errors of 9.5 and 10% for free and bound
ING4-PHD, respectively. The 15N relaxation was analyzed assuming
dipolar coupling with the directly attached proton, with a bond length of 1.02
Å, and a contribution from the 15N chemical shift anisotropy
with a value of -160 ppm. The program FAST-Modelfree
(29), which interfaces with
the program MODELFREE version 4.2
(30) was used to fit the
relaxation data to the model free formalism of Lipari and Szabo
(31). Five different models of
internal motion were evaluated for each amide 1H-15N
pair: (i) S2, (ii) S2 and
τe, (iii) S2, and Rex,
(iv) S2, τe, and Rex,
and (v)  , S2 and
τe, where S2 is the generalized order
parameter, τe is the effective internal correlation time,
Rex is the exchange contribution to the transverse
relaxation, and
, S2 and
τe, where S2 is the generalized order
parameter, τe is the effective internal correlation time,
Rex is the exchange contribution to the transverse
relaxation, and  is related to the
amplitude of the fast internal motions.
is related to the
amplitude of the fast internal motions.
Isothermal Titration Calorimetry—ITC experiments were performed using a high precision MCS titration calorimetric system (Microcal Inc., Northampton, MA). The ING4-PHD domain was extensively dialyzed against the titration buffer. All of the solutions were filtered, properly degassed to avoid bubble formation, and equilibrated to 25 °C prior to each experiment. The protein solution (at 40–65 μm) in the calorimetric cell was titrated with the appropriate ligand (at 600–800 μm) dissolved in the dialysis buffer following a profile of injection volumes from 2.8 to 20 μl to better define the titration curve. The heat evolved after each peptide injection was obtained from the integral of the calorimetric signal. The heat produced by the binding reaction between the PHD and the peptides was obtained as the difference between the heat of reaction and the corresponding heat of dilution, as obtained from independent titrations of the peptides into the buffer. The resulting binding isotherms were analyzed by nonlinear least square fittings of the experimental data to a model corresponding to a single set of identical sites, as described in the supplemental data. For the interactions of H310K4me0 with ING4-PHD, for which the dissociation constant is out of the range measurable directly by ITC, displacement experiments using H310K4me1 as competing ligand were carried out. Briefly, a 65 μm ING4-PHD solution with H310K4me0 at a 1:4.6 molar ratio was placed in the calorimetric cell and titrated with H310K4me1 (at 2 mm) following a profile of injection volumes from 4 to 20 μl. The resulting binding isotherms, corrected for the dilution heats, were analyzed by nonlinear least square fittings of the experimental data to the exact displacement model as described (32) using the binding affinity and binding enthalpy for H310K4me1 obtained from the titrations with this peptide using the same injection profile. The data analysis was done with Microcal Origin (OriginLab Corporation, Northampton, MA) together with software developed in our laboratory.
Solvation Energy Calculations—The differences in solvation entropy were calculated according to Freire's structural parameterization of the energetics (33) calculated using the crystal structure of the ING4-PHD·H310K4me3 complex and two modeled structures for the di- and mono-methylated species. Of the three methyl groups in the crystal structure, one is fully buried at the binding interface (carbon atom number 891, ΔASA = 0Å2), the second is somewhat exposed (carbon atom number 893, ΔASA = 16.93 Å2), and the third one is significantly exposed (carbon atom number 892, ΔASA = 26.93 Å2). One could reasonably assume that in the dimethylated complex both methyl groups would tend to be as buried as possible. This is what is observed in the complex of the heterochromatin protein 1 chromodomain with H315K9me2 and me3 peptides, where the methylated lysine side chains adopt a structure very similar to that in ING4-PHD·H310K4me3 complex (34). For this reason, in the model of H310K4me2 bound to ING4 the methyl group that is exposed the most (C atom number 892) was removed from the structure of H310K4me3, whereas C atoms numbers 892 and 893 were removed to build the model for the H310K4me1 complex.
RESULTS AND DISCUSSION
Recognition of H3K4me3 by ING4—The crystal structure of ING4-PHD (residues 188–246) bound to histone 3 (residues 1–10) trimethylated at lysine 4 (H310K4me3) was solved at 1.76 Å resolution (Fig. 1A). The ten residues of the peptide were observed in the electron density, including two alternate conformations for H3 Arg8 that could be modeled without ambiguity into their corresponding densities (Fig. 1B). The peptide conformation does not seem to be influenced by the neighboring crystallographically related molecules, and the interactions with ING4 observed in the crystal structure are consistent with solution NMR data (Fig. 2A). The structure of the complex shows that the N-terminal half of the histone tail binds to the surface of the PHD finger as a third strand of the anti-parallel β-sheet that forms the core of the PHD (35). The peptide N terminus forms a hydrogen bond with the carbonyl of ING4 residue Gly235 and H3 residues Arg2–Thr6, which have β-sheet backbone dihedral angles, form backbone hydrogen bonds with Cys212–Gly207 (Fig. 1C). A kink in the main chain at H3 residues Ala7-Arg8 recovers the extended conformation for H3 residues Lys9-Ser10, with H3 Ser10 forming a backbone hydrogen bond with Ser205. Because of the polar nature of histone 3 tail residues, the interactions are predominantly polar. The side chain of H3 Arg2 forms a salt bridge with Glu220, while the side chains of Thr3, Thr6, and Ser10 form hydrogen bonds with Lys232, Gly207, and Glu195, respectively (Fig. 1D). The guanidinium group of H3 Arg2 and the trimethylammonium group of H3K4me3 make cation-π interactions with the side chain of Trp221, which sits between the two basic peptide side chains. H3K4me3 forms another cation-π contact with Tyr198, which is not essential for recognition because the mutant Y198A still binds the peptide with moderate affinity (13). H3 residue Lys9 makes a cation-π interaction with Tyr206, and so does H3 Arg8 (at least in one of the two alternative conformations). However, these two interactions are probably weaker because whereas the distances between the charges and the aromatic rings are within the range of typical van der Waals' interactions, their relative orientations are not optimal (the charges are off the C6 ring axis C).
FIGURE 1.

Three-dimensional crystal structure of the complex of ING4-PHD bound to H310K4me3. A, overall structure with ING4-PHD shown in gray and H310K4me3 shown in yellow stick representation. The location of the ING4 residues lining the binding grooves for histone 3 residues Ala1, Arg2, Thr3, Lys4, and Ser10 is indicated with black labels. B, view of a 2(|Fo| - |Fc|) omit map at 1.76 Å contoured at 1 σ as a blue mesh. The omit map was calculated with the program OMIT in the CCP4 package (45). C, details of the β-sheet structure formed by H3 residues Arg2–Thr6 and ING4 residues Gly207–Gly211 with backbone hydrogen bonds in green. D, details of side chain interactions with hydrogen bonds and water molecules in green.
FIGURE 2.

NMR analysis of the binding of ING4-PHD to H310K4meX peptides. A, binding histogram showing the CSP observed for each residue in the 1H-15N HSQC spectra of ING4 PHD in the presence of 1:4 excess of H310K4me3. B, the CSP of the Trp237 amide resonance of ING4(188–249) in 1H-15N-HSQC spectra is represented as a function of peptide concentration. The continuous lines are fit to the binding model (13). The height of the symbol indicates the experimental error.
The PHD structure resembles an oblate ellipsoid with three grooves or channels in one side that are filled by the backbone and the side chains of H3 residues Ala1–Thr6 (see supplemental Fig. S1). The kink at H3 Ala7 directs the peptide chain along the rim of the ellipsoid, and H3 Ser10 occupies a small depression lined by Glu195. The shape complementarities between the PHD and the bound peptide structures result in the burial of a large accessible surface area upon complex formation both in the PHD and in the peptide molecules (ASA, 1318 Å2; see below), with H3 Ala7 at the kink being the only residue not contributing to the buried ASA.
In the complex with ING4, the methylammonium of H3K4me3 is positioned in a cage formed by two aromatic residues (Tyr198 and Trp221), the hydrophobic side chain of Met209, and Ser205. This binding mode of the methylated lysine is common to ING2 and similar to the bromodomain PHD finger transcription factor, with a cage of four aromatic residues, (17). Overall, the recognition of the N-terminal half of H310K4me3 by ING4 is very similar to that observed in the complex with ING2 (12) but differs markedly in the C-terminal half (Fig. 3 and supplemental Fig. S2). The peptide bound to ING2 is not kinked at H3 Ala7, and the last two residues observed in the crystal (H3 Ala7-Arg8) wander off the PHD. The different mode of binding of ING4 is consistent with the different effect of a homologous residue substitution (Y198A in ING4 and Y215A in ING2), which causes a 3-fold reduction in the affinity of ING4 for H315K4me3 while it strongly destabilizes (more than 3000-fold less affinity) the complex with ING2 (13). The reason for the different effect of the homologous mutation could be the distinct distribution of charges on the surface of the PHD fingers of ING2 and ING4. While in ING4 the N-terminal end of the molecule is predominantly negatively charged on the side closer to K4me3, it is positively charged in ING2 (Fig. 3B). The shielding of the aromatic side chain of Tyr215 in ING2 may reduce the charge repulsion between this region and K4me3, and its elimination destabilizes the complex beyond the already destabilizing effect of removing the favorable cation-π interaction. In the complex with ING4, the removal of the aromatic side chain of Tyr198 eliminates that same cation-π interaction, but it does not result in unfavorable electrostatic interactions.
FIGURE 3.
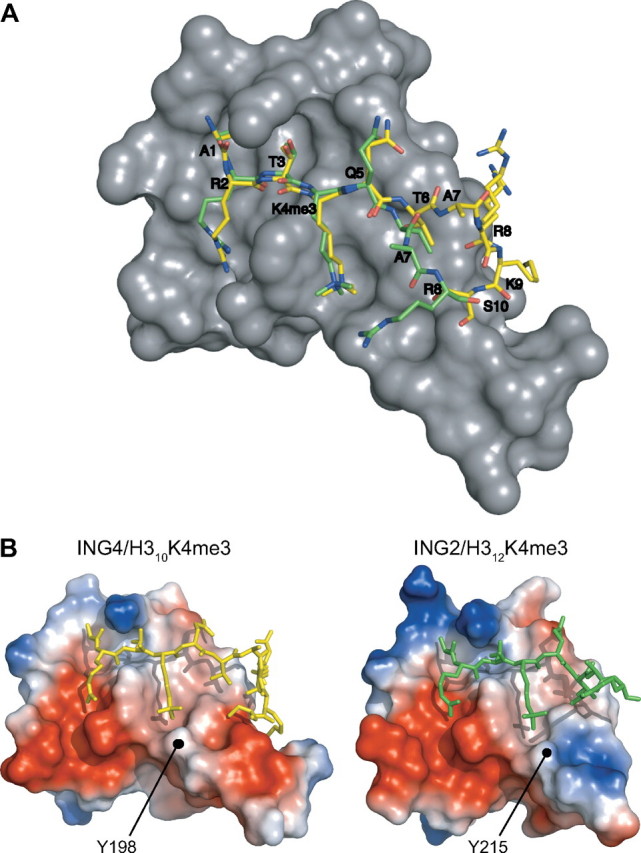
Comparison of the structures of H3K4me3 peptides bound to ING4 and ING2 PHD. A, the crystal structure of ING4-PHD is shown as a gray surface with the bound H310K4me3 in yellow and the superimposed H312K4me3 from the corresponding ING2-PHD complex structure in green. Only H3 residues Ala1 to Arg8 are seen in the crystal of the ING2 complex (Protein Data Bank entry 2G6Q). Black labels indicate the Cα atoms of the peptide residues, whose positions are very similar in both peptides up to H3 Thr6. B, surface representations of the PHD fingers of ING2 and ING4 bound to the histone peptides where the electrostatic potential is indicated by a gradient of red (negative charge) and blue (positive charge) colors. The positions of the homologous tyrosine residues 198 and 215 are indicated in ING4 and ING2, respectively.
ING4 Binding to Histone Tails of Different Lengths—The recognition of the H3 Ala1 by Gly235 blocks N-terminal extensions of the peptide chain bound to ING4, which is probably important for the specificity of the binding of H310K4me3 because the lysine modification is near the N terminus (36). No similar limitation exists at the C terminus, and the extent of the interactions with other regions of the histone tail is unclear.
We have previously characterized the binding of ING4 to 15-residue-long H315K4meX peptides (13). The affinity for H310K4me3 is, within error, the same as for H315K4me3. Nonetheless, whereas ING4 does not discriminate between H315K4me1, -me2, or -me3, it does so for the shorter peptides, with the affinity increasing with the higher number of methyls (Fig. 2B and Table 2), indicating that the additional residues contribute to the interaction with ING4. Crystallization trials with this longer peptide were unsuccessful, and the differences in the binding of H315K4me3 and H310K4me3 were examined in solution by NMR measuring the differences in the CSPs caused on the ING4 signals on binding to the two peptides. These measurements are very sensitive to weak interactions or those involving flexible regions of the ligand and/or receptor. The spectra of ING4 bound to H310K4me3 or H315K4me3 (Fig. 4A) show several residues with larger perturbations caused by the longer peptide. Moreover, these perturbations are clustered in a region of ING4 in the vicinity of the C-terminal end of the peptide (Fig. 4B), indicating that additional interactions take place, resulting in higher affinities for H315K4me1 and -me2 (Table 2). This finding is consistent with the decreased flexibility of the N-terminal end of ING4-PHD bound to H315K4me3 (see below).
TABLE 2.
Dissociation constants (KD) measured in solution by NMR for the 10- and 15-residue-long histone tails methylated at lysine 4 bound to ING4(188–249)
| Liganda | KDb |
|---|---|
| μm | |
| H315K4me0 | 370 ± 20 |
| H310K4me0 | 274 ± 6 |
| H315K4me1 | 1.6 ± 0.8 |
| H310K4me1 | 34 ± 4 |
| H315K4me2 | 2 ± 1 |
| H310K4me2 | 9.2 ± 1.4 |
| H315K4me3 | 3.9 ± 0.7 |
| H310K4me3 | 3.0 ± 0.6 |
| H310R2me2K4me3 | 19.2 ± 1.7 |
| H310R2me2c | 1400 ± 40 |
The values for H315K4 peptides are from Ref. 13
The fitting errors are indicated
Measured from the CSP of C212 signal instead of Trp237 (see supplemental Fig. S4)
FIGURE 4.

Binding of ING4-PHD to H3K4me3 peptides of different lengths. A, overlay of HSQC spectra of ING4(188–249) bound to H315K4me3 (black) or H310K4me3 (red). The cross-peaks are labeled with their corresponding residue number and single-letter code. Peaks from amide side chains are connected by straight lines. Residues with CSP differences larger than twice the experimental error are boxed. Four signals from a minor conformer caused by the cis-trans isomerization of the peptidyl-prolyl bonds in the flexible N-terminal region of ING4 are labeled (M189c, V191c, D192c, and N194c). A signal from an unknown molecule is marked with an asterisk. B, binding histogram of the differences in the CSP for each ING4 PHD residue; the experimental error (±0.012 ppm) is indicated by the dotted line, while twice this error is indicated by the dashed line. The inset is a surface representation of ING4 PHD where residues with 0 > ΔCSP > error or ΔCSP > 2 × error are colored in light or dark blue, respectively. Proline residues for which no signal can be observed are colored in black.
Dynamics and Thermodynamics of the Recognition of H3K4me3 by ING4—The chain termini of ING4 are highly flexible in solution, as indicated by the small values of the order parameters (S2) measured for the backbone 15N atoms (Fig. 5A), which are sensitive to movements of the N-H bond in ps to ns time scales. Residue Gly235 also shows increased mobility compared with the rest of the chain. Binding to H310K4me3 increases the order parameters at several regions of the ING4 chain containing residues directly involved in histone recognition (Glu195, Gly211, Glu220, and Gly235). The increased order around Glu220 on peptide binding is consistent with the conformational exchange detected for this residue in free ING4 but not in the complex (Fig. 5B). Conformational exchange in free ING4 is also detected for Trp221, which interacts with H3 Arg2 and H3 Lys4. These results show that the recognition of H310K4me3 is not made by a static PHD molecule but that binding involves regions of ING4 with different degrees of mobility in its free form that become more rigid upon binding to the peptide. Relaxation data on ING4 bound to H315K4me3 show that the flexibility at the N-terminal region is further reduced on binding to this longer peptide (supplemental Fig. S3), which is consistent with the observed contribution to the binding of the longer histone tails. The NMR spectra also show that the free peptides are highly flexible in solution, and conformational order is induced on binding to ING4 (data not shown). A detailed account of the analysis of the backbone 15N relaxation data can be found in the supplemental data.
FIGURE 5.

Backbone dynamics of the ING4-PHD backbone. The backbone 15N nuclei order parameters (A, S2) and the contribution of exchange processes (B, Rex) to the relaxation of backbone 15N nuclei are represented versus the sequence of ING4, in its free form (open circles) and in the complex with H310K4me3 (filled circles). The ribbon diagram shows the crystal structure of ING4-PHD bound to H310K4me3 (in yellow and with side chains). A color code indicates the change in S2 for the corresponding ING4 residue on peptide binding. The residues for which the difference could not be measured are colored in black.
The energetics of the ING4 binding to H310K4meX was characterized by isothermal titration calorimetry. Low to moderate binding affinities, with a large increase when the first methyl is introduced, were observed in good agreement with those measured by NMR (Fig. 6). The interaction is driven by a markedly exothermic binding enthalpy partially opposed by unfavorable entropic contributions (Fig. 7). This thermodynamic signature is consistent with the high density of hydrogen bonds and polar interactions at the binding interface and with the burial of apolar and polar ASA upon complex formation (798 and 520 Å2, respectively, with a ratio ΔASAapolar/ΔASApolar = 1.5). Nonetheless, the methylation state of the lysine residue does not have a significant effect on the enthalpic contributions to the binding affinity, which is very similar for the four peptides, so that the increment in the binding affinity upon methylation is entirely due to changes in the entropic contributions (Fig. 7). It is interesting to note that the opposite situation has been proposed for chromodomains (37). Lysine methylation leads to a polarization of the Cε-Nζ bond increasing the cationic character of the methylammonium group and strengthening the cation-π interactions with the aromatic cage but also results in an increment on the hydrophobic character of an otherwise highly polar side chain. The introduction of the methyl groups leads to an increased burial of apolar ASA on complex formation, which results in more favorable solvation entropies. This interpretation is supported by the agreement between the measured differences in the entropic contributions to binding (-TΔΔS = -1.9, -2.8, and -3.3 kcal·mol-1 for H310K4me1, -me2, and -me3, respectively, referenced to H310K4me0), and the differences in solvation entropy were calculated (33) in terms of changes in accessible surface area (-TΔΔSsolv =-1.7, -2.9, and -2.6 kcal·mol-1).
FIGURE 6.

Calorimetric titrations of ING4-PHD with H310K4meX peptides. Shown are examples of the direct titrations of the H310K4me3, H310K4me2, and H310K4me1 peptides together with the displacement experiment for H310K4me0 using H310K4me1 as competing ligand. In all cases, the upper panels represent the heat effect associated with the peptide injections, and the lower panels represent the ligand concentration dependence of the heat released upon binding, after normalization and correction for the heats of dilution. The symbols correspond to the experimental data, and the continuous line corresponds to the best fit to a model of one set of identical binding sites (as described in the supplemental materials) for H310K4me3, -me2, and -me1 and to a complete displacement model for H310K4me0.
FIGURE 7.

Thermodynamic parameters of the ING4-PHD/H3K4meX binding. The bar diagram shows the change in free energy (ΔG), enthalpy (ΔH), and in the contribution of entropy to the free energy (-TΔS) of the binding of H310K4meX peptides to ING4(188–249), as determined by ITC. The uncertainty in the experimental values is estimated to be ∼5%.
ING4 Reading of the Histone Code—The structural basis for the binding of ING4 to histone 3 N-terminal tail lies on numerous interactions that occur when the N-terminal histone residues occupy a depression on one side of the PHD. This results, however, in a low binding affinity that increases on methylation at H3 Lys4. The relevance of the differences in the affinities for mono-, di- or trimethylated peptides is, however, unclear because peptide elongation at the C terminus stabilizes the complexes blurring those differences. This is in contrast with ING2, which does discriminate between the different methylation states of H312K4meX, with ∼10-fold affinity increments for every additional methyl (14). The differences in the binding mode between the two ING proteins discussed above may explain these dissimilar affinities, which could be related with a different function. ING2, as part of the mSin3A·HDAC1 complex, links H3K4me3 recognition with transcriptional repression through histone deacetylation. ING4, involved in a complex containing HBO1 (the histone acetyltransferase binding to ORC 1) (11), may link the recognition of H3K4me3 (and of H3K4me2 and -me1) with transcriptional activation through histone acetylation.
The side chain of H3 Arg2 lies in a groove that is separated by Trp221 from another groove occupied by H3K4me3 (Fig. 1A), as was described for H315K4me3 bound to the double chromodomain of CHD1 (38). The affinity of the chromodomain binding to H3K4me3 was found to experience a 4-fold reduction when the simultaneous asymmetric dimethylation at H3 Arg2 (H3R2me2a) occurred on the histone 3 tail. In ING4, the side chain of H3 Arg2 interacts with the side chain of Glu220, whereas the corresponding position in CHD1 is occupied by a smaller glycine residue. Thus steric clashes may cause an even larger reduction in the affinity of ING4 for K4me3 when the simultaneous H3R2me2a modification occurs on the same histone site. The relevance of this discrimination lies in the mutual exclusion of H3K4me3 and H3R2me2a recently reported in actively transcribed genes (39, 40). The measurement of the binding of ING4 to H3R2me2aK4me3 shows a 6-fold reduction in binding affinity (Table 2 and supplemental Fig. S4), indicating that ING4 can discriminate between chromatin regions enriched in one or both histone modifications. Dimethylation of H3 Arg2 inhibits the recognition of H3K4me2 by the Spp1-PHD, a subunit of the Set1p histone methylation complex (40), thus regulating trimethylation at H3 Lys4. Sequence homology suggests that the binding site for H3 Arg2 in Spp1 is similar to ING4, indicating that dimethylation of H3 Arg2 will also inhibit binding of ING4 to H3K4me3, which is consistent with the measured reduced affinity for the corresponding histone fragment. In this way, H3R2me2 may help to maintain the chromatin silent not only by inhibiting the recruitment of methyltransferases but also that of histone acetyltransferase complexes such as HBO1. Therefore, understanding how different combinations of histone modifications are read by their recognition modules may be critical to appreciating the regulatory mechanisms exerted through those modifications, as illustrated by the antagonizing role of H3K9me3 and H3S10ph in the recruitment of heterochromatin protein 1 to discrete regions of the chromatin, thereby regulating gene expression (41, 42).
The double chromodomain of CHD1 binds to H3K4me3 with similar affinities when combined with either H3K9me3, H3K9ac, or H3S10ph, but with a 20-fold reduced affinity when H3T3ph is present (38). Based on the structure of the ING4·H3K4me3 complex, phosphorylation of H3T3, a modification correlated with transcription activation, would generate a larger and negatively charged residue that could be accommodated by a conformational change at the side chain of Lys232, with which a favorable electrostatic interaction could be established (Fig. 1A). H3K9me3 binds to ING4 with the same affinity as unmodified H3 (13), suggesting the compatibility of methylation at both lysine residues. Acetylation, however, removes the positive charge of H3K9, precluding its interaction with the aromatic side chain of Tyr206 (Fig. 1D) and probably reducing the affinity of ING4 binding to H3K4me3K9ac. Phosphorylation of H3 Ser10 would disrupt the hydrogen bond of its side chain with Glu195 (Fig. 1D) and introduce an unfavorable electrostatic interaction, suggesting that it would be incompatible with H3K4me3 recognition. A similar effect, though reduced, might occur if H3T11 is the phosphorylated residue because its location on the PHD is close to the negatively charged N-terminal region of the PHD (Figs. 3B and 4B). On the other hand, monomethylation in Arg8, which has been associated with repressed transcription, is probably of little relevance for H3K4me3 recognition because its side chain can adopt two different conformations (Fig. 1), and the structure of the complex does not suggest additional interactions with H3R8me1. Our results suggest that H3K4me3 recognition by ING4 is compatible with H3T3ph, H3R8me1, and H3K9me3, whereas it is not compatible with, or is impaired by, H3R2me2a, H3K9ac, H3S10ph, and H3T11ph. Further experimental studies on PHD fingers and other protein modules will provide more insights into the impact of multiple combinations of histone modifications and their role in the dynamic regulation of chromatin.
Supplementary Material
The atomic coordinates and structure factors (code 2VNF) have been deposited in the Protein Data Bank, Research Collaboratory for Structural Bioinformatics, Rutgers University, New Brunswick, NJ (http://www.rcsb.org/).
This work was supported by a Fundación de Investigación Médica Mutua Madrileña grant and Ikerbasque (Basque Foundation for Science) (to F. J. B.), Ministerio de Educación y Ciencia Grant BFU-2005-02403 (to G. M.), and Ministerio de Educación y Ciencia Grant GEN2003-20642-C09-02 (to G. M. and F. J. B.). The costs of publication of this article were defrayed in part by the payment of page charges. This article must therefore be hereby marked “advertisement”in accordance with 18 U.S.C. Section 1734 solely to indicate this fact.
The on-line version of this article (available at http://www.jbc.org) contains supplemental Figs. S1–S4 and details on the thermodynamics and dynamics analysis.
Footnotes
The abbreviations used are: ING, inhibitor of growth; PHD, plant homeodomain; H3, histone 3; ITC, isothermal titration calorimetry; ASA, accessible surface area; CSP, chemical shift perturbations; CHD1, chromo-ATPase/helicase-DNA-binding protein 1; HDAC1, histone deacetylase complex 1; NOE, nuclear Overhauser effect; HSQC, heteronuclear single quantum coherence.
References
- 1.Li, B., Carey, M., and Workman, J. L. (2007) Cell 128 707-719 [DOI] [PubMed] [Google Scholar]
- 2.Groth, A., Rocha, W., Verreault, A., and Almouzni, G. (2007) Cell 128 721-733 [DOI] [PubMed] [Google Scholar]
- 3.Downs, J. A., Nussenzweig, M. C., and Nussenzweig, A. (2007) Nature 447 951-958 [DOI] [PubMed] [Google Scholar]
- 4.Rountree, M. R., Bachman, K. E., Herman, J. G., and Baylin, S. B. (2001) Oncogene 20 3156-3165 [DOI] [PubMed] [Google Scholar]
- 5.He, G. H., Helbing, C. C., Wagner, M. J., Sensen, C. W., and Riabowol, K. (2005) Mol. Biol. Evol. 22 104-116 [DOI] [PubMed] [Google Scholar]
- 6.Russell, M., Berardi, P., Gong, W., and Riabowol, K. (2006) Exp. Cell Res. 312 951-961 [DOI] [PubMed] [Google Scholar]
- 7.Soliman, M. A., and Riabowol, K. (2007) Trends Biochem. Sci 32 509-519 [DOI] [PubMed] [Google Scholar]
- 8.Campos, E. I., Chin, M. Y., Kuo, W. H., and Li, G. (2004) Cell Mol. Life Sci. 61 2597-2613 [DOI] [PubMed] [Google Scholar]
- 9.Aasland, R., Gibson, T. J., and Stewart, A. F. (1995) Trends Biochem. Sci 20 56-59 [DOI] [PubMed] [Google Scholar]
- 10.Bienz, M. (2006) Trends Biochem. Sci. 31 35-40 [DOI] [PubMed] [Google Scholar]
- 11.Doyon, Y., Cayrou, C., Ullah, M., Landry, A. J., Cote, V., Selleck, W., Lane, W. S., Tan, S., Yang, X. J., and Cote, J. (2006) Mol. Cell 21 51-64 [DOI] [PubMed] [Google Scholar]
- 12.Pena, P. V., Davrazou, F., Shi, X., Walter, K. L., Verkhusha, V. V., Gozani, O., Zhao, R., and Kutateladze, T. G. (2006) Nature 442 100-103 [DOI] [PMC free article] [PubMed] [Google Scholar]
- 13.Palacios, A., Garcia, P., Padro, D., Lopez-Hernandez, E., Martin, I., and Blanco, F. J. (2006) FEBS Lett. 580 6903-6908 [DOI] [PubMed] [Google Scholar]
- 14.Santos-Rosa, H., Schneider, R., Bannister, A. J., Sherriff, J., Bernstein, B. E., Emre, N. C., Schreiber, S. L., Mellor, J., and Kouzarides, T. (2002) Nature 419 407-411 [DOI] [PubMed] [Google Scholar]
- 15.Shi, X., Hong, T., Walter, K. L., Ewalt, M., Michishita, E., Hung, T., Carney, D., Pena, P., Lan, F., Kaadige, M. R., Lacoste, N., Cayrou, C., Davrazou, F., Saha, A., Cairns, B. R., Ayer, D. E., Kutateladze, T. G., Shi, Y., Cote, J., Chua, K. F., and Gozani, O. (2006) Nature 442 96-99 [DOI] [PMC free article] [PubMed] [Google Scholar]
- 16.Wysocka, J., Swigut, T., Xiao, H., Milne, T. A., Kwon, S. Y., Landry, J., Kauer, M., Tackett, A. J., Chait, B. T., Badenhorst, P., Wu, C., and Allis, C. D. (2006) Nature 442 86-90 [DOI] [PubMed] [Google Scholar]
- 17.Li, H., Ilin, S., Wang, W., Duncan, E. M., Wysocka, J., Allis, C. D., and Patel, D. J. (2006) Nature 442 91-95 [DOI] [PMC free article] [PubMed] [Google Scholar]
- 18.Otwinowski, Z., Minor, W., and Charles, W., Carter, Jr. (1997) Methods Enzymol. 276 307-326 [DOI] [PubMed] [Google Scholar]
- 19.Read, R. J. (2001) Acta Crystallogr. D Biol. Crystallogr. 57 1373-1382 [DOI] [PubMed] [Google Scholar]
- 20.Murshudov, G. N., Vagin, A. A., and Dodson, E. J. (1997) Acta Crystallogr. D Biol. Crystallogr. 53 240-255 [DOI] [PubMed] [Google Scholar]
- 21.Jones, T. A., Zou, J. Y., Cowan, S. W., and Kjeldgaard, M. (1991) Acta Crystallogr. A 47 110-119 [DOI] [PubMed] [Google Scholar]
- 22.Cohen, S. X., Morris, R. J., Fernandez, F. J., Ben Jelloul, M., Kakaris, M., Parthasarathy, V., Lamzin, V. S., Kleywegt, G. J., and Perrakis, A. (2004) Acta Crystallogr. D Biol. Crystallogr. 60 2222-2229 [DOI] [PubMed] [Google Scholar]
- 23.Farrow, N. A., Muhandiram, R., Singer, A. U., Pascal, S. M., Kay, C. M., Gish, G., Shoelson, S. E., Pawson, T., Forman-Kay, J. D., and Kay, L. E. (1994) Biochemistry 33 5984-6003 [DOI] [PubMed] [Google Scholar]
- 24.Renner, C., Schleicher, M., Moroder, L., and Holak, T. A. (2002) J. Biomol. NMR 23 23-33 [DOI] [PubMed] [Google Scholar]
- 25.Johnson, B. A. (2004) Methods Mol. Biol. 278 313-352 [DOI] [PubMed] [Google Scholar]
- 26.Pawley, N. H., Wang, C., Koide, S., and Nicholson, L. K. (2001) J. Biomol. NMR 20 149-165 [DOI] [PubMed] [Google Scholar]
- 27.Tjandra, N., Feller, S. E., Pastor, R. W., and Bax, A. (1995) J. Am. Chem. Soc. 117 12562-12566 [Google Scholar]
- 28.Bruschweiler, R., Liao, X., and Wright, P. E. (1995) Science 268 886-889 [DOI] [PubMed] [Google Scholar]
- 29.Cole, R., and Loria, J. P. (2003) J. Biomol. NMR 26 203-213 [DOI] [PubMed] [Google Scholar]
- 30.Palmer, A. G., Rance, M., and Wright, P. E. (1991) J. Am. Chem. Soc. 113 4371-4380 [Google Scholar]
- 31.Lipari, G., and Szabo, A. (1982) J. Am. Chem. Soc. 104 4559-4570 [Google Scholar]
- 32.Sigurskjold, B. W. (2000) Anal. Biochem. 277 260-266 [DOI] [PubMed] [Google Scholar]
- 33.Luque, I., and Freire, E. (1998) Methods Enzymol. 295 100-127 [DOI] [PubMed] [Google Scholar]
- 34.Jacobs, S. A., and Khorasanizadeh, S. (2002) Science 295 2080-2083 [DOI] [PubMed] [Google Scholar]
- 35.Pascual, J., Martinez-Yamout, M., Dyson, H. J., and Wright, P. E. (2000) J. Mol. Biol. 304 723-729 [DOI] [PubMed] [Google Scholar]
- 36.Taverna, S. D., Li, H., Ruthenburg, A. J., Allis, C. D., and Patel, D. J. (2007) Nat. Struct. Mol. Biol. 14 1025-1040 [DOI] [PMC free article] [PubMed] [Google Scholar]
- 37.Hughes, R. M., Wiggins, K. R., Khorasanizadeh, S., and Waters, M. L. (2007) Proc. Natl. Acad. Sci. U. S. A. 104 11184-11188 [DOI] [PMC free article] [PubMed] [Google Scholar]
- 38.Flanagan, J. F., Mi, L. Z., Chruszcz, M., Cymborowski, M., Clines, K. L., Kim, Y., Minor, W., Rastinejad, F., and Khorasanizadeh, S. (2005) Nature 438 1181-1185 [DOI] [PubMed] [Google Scholar]
- 39.Guccione, E., Bassi, C., Casadio, F., Martinato, F., Cesaroni, M., Schuchlautz, H., Luscher, B., and Amati, B. (2007) Nature 449 933-937 [DOI] [PubMed] [Google Scholar]
- 40.Kirmizis, A., Santos-Rosa, H., Penkett, C. J., Singer, M. A., Vermeulen, M., Mann, M., Bahler, J., Green, R. D., and Kouzarides, T. (2007) Nature 449 928-932 [DOI] [PMC free article] [PubMed] [Google Scholar]
- 41.Fischle, W., Tseng, B. S., Dormann, H. L., Ueberheide, B. M., Garcia, B. A., Shabanowitz, J., Hunt, D. F., Funabiki, H., and Allis, C. D. (2005) Nature 438 1116-1122 [DOI] [PubMed] [Google Scholar]
- 42.Hirota, T., Lipp, J. J., Toh, B. H., and Peters, J. M. (2005) Nature 438 1176-1180 [DOI] [PubMed] [Google Scholar]
- 43.Kleywegt, G. J., Zou, J. Y., Kjeldgaard, M., and Jones, T. A. (2001) International Tables for Crystallography, Vol. F, pp. 353-367, Kluwer Academic Publishers, Dordrecht, The Netherlands [Google Scholar]
- 44.Laskowski, R. A., MacArthur, M. W., Moss, D. S., and Thornton, J. M. (1993) J. Appl. Crystallogr. 26 283-291 [Google Scholar]
- 45.Potterton, E., McNicholas, S., Krissinel, E., Cowtan, K., and Noble, M. (2002) Acta Crystallogr. D Biol. Crystallogr. 58 1955-1957 [DOI] [PubMed] [Google Scholar]
Associated Data
This section collects any data citations, data availability statements, or supplementary materials included in this article.