

Abstract
Although the d-glucarate degradation pathway is well characterized in Escherichia coli, genetic and biochemical information concerning the alternative pathway proposed in Pseudomonas species and Bacillus subtilis remains incomplete. Acinetobacter baylyi ADP1 is a Gram-negative soil bacterium possessing the alternative pathway and able to grow using d-glucarate as the only carbon source. Based on the annotation of its sequenced genome (1), we have constructed a complete collection of singlegene deletion mutants (2). High throughput profiling for growth on a minimal medium containing d-glucarate as the only carbon source for ∼2450 mutants led to the identification of the genes involved in d-glucarate degradation. Protein purification after recombinant production in E. coli allowed us to reconstitute the enzymatic pathway in vitro. We describe here the kinetic characterization of d-glucarate dehydratase, d-5-keto-4-deoxyglucarate dehydratase, and of cooperative α-ketoglutarate semialdehyde dehydrogenase. Transcription and expression analyses of the genes involved in d-glucarate metabolism within a single organism made it possible to access information regarding the regulation of this pathway for the first time.
d-Glucaric acid is a natural product that can serve as a growth substrate for a number of bacteria (3–5). Two different pathways can be used for d-glucarate metabolism. In Escherichia coli, d-glucarate is dehydrated to d-5-keto-4-deoxyglucarate (KDG)3 by d-glucarate dehydratase (EC 4.2.1.40). KDG is then converted to pyruvate and tartronate semialdehyde by KDG aldolase (EC 4.1.2.20). Tartronate semialdehyde is next reduced to d-glycerate by a tartronate semialdehyde reductase (EC 1.1.1.60), and finally, d-glycerate is phosphorylated by a glycerate kinase (EC 2.7.1.31) to yield 3-phosphoglycerate (4). The genes of E. coli responsible for the different enzymatic activities of the pathway have been identified (6, 7). An alternative pathway has been proposed in a limited number of bacteria (8–10), including Pseudomonas species, in which the enzymes of the pathway have been characterized (9, 11, 12) (Fig. 1). d-Glucarate is dehydrated to form KDG by d-glucarate dehydratase, in a common step with the E. coli pathway. KDG is then converted to α-ketoglutarate by the sequential action of KDG dehydratase (EC 4.2.1.41) and α-ketoglutarate semialdehyde dehydrogenase (α-KGSA dehydrogenase; EC 1.2.1.26). The information on this pathway is scattered and incomplete, limiting the understanding of d-glucarate metabolism. For instance, only a small amount of data for KDG dehydratase are available. Procedures for the purification and the activity assay of the enzyme have been published (11, 13, 14), but, to our best knowledge, there is no report on gene identification or enzymatic properties. Moreover, although gene identification was recently achieved for α-KGSA dehydrogenase, investigations were restricted to Azospirillum brasilense and Bacillus subtilis (15). Acinetobacter baylyi ADP1, an evolutionarily close relative of Pseudomonas, is a soil γ-proteobacterium that has been sequenced and annotated at Genoscope with special focus on metabolism reconstruction (1). Moreover, we have constructed a collection of single-gene deletion mutants for all dispensable genes of this organism (2). A. baylyi ADP1 is capable of using a large variety of compounds as carbon sources. In particular, it can grow on d-glucarate or d-galactarate as its sole carbon source, suggesting the presence of metabolic functions to assimilate these compounds. However, in A. baylyi ADP1, there is no experimental information on their utilization. We took advantage of the availability of the complete collection of single-gene deletion mutants to identify the genes involved in the utilization of d-glucarate by profiling ∼2450 mutants for growth on a medium with d-glucarate as the sole carbon source. Based on this strategy, we describe here the enzymatic and transcriptional analysis of proteins and genes involved in d-glucarate utilization in A. baylyi ADP1.
FIGURE 1.

The alternative d-glucarate degradation pathway proposed in Pseudomonas. Shown are d-glucarate dehydratase (1), d-5-keto-4-deoxyglucarate dehydratase (2), andα-ketoglutarate semialdehyde dehydrogenase (3).
EXPERIMENTAL PROCEDURES
Chemicals—All chemicals and enzymes were purchased from Sigma. Reagents for molecular biology were from Invitrogen. Oligonucleotides were from Sigma.
Proteinase inhibitor Pefabloc SC was purchased from Roche Applied Science. The Lysonase™ bioprocessing reagent was from Novagen. KDG was prepared by enzymatic conversion of d-glucarate by d-glucarate dehydratase in the presence of 5 mm MgCl2 in Activity Buffer (50 mm Hepes/NaOH, pH 7.5, 100 mm NaCl, and 10% glycerol). The reaction was stopped by trifluoroacetic acid and neutralized by 5 m K2CO3. α-Ketoglutarate semialdehyde (α-KGSA) was prepared by enzymatic conversion of d-glucarate by d-glucarate dehydratase and KDG dehydratase, in the presence of 5 mm MgCl2 in Activity Buffer. The reaction was stopped by trifluoroacetic acid and neutralized by 5 m K2CO3.
Bacteria and Media—The A. baylyi ADP1 strain was provided by Dr. Nicholas Ornston (Yale University). Cells were routinely grown on MA minimal medium (31 mm Na2HPO4; 25 mm KH2PO4; 18 mm NH4Cl; 41 μm nitrilotriacetic acid; 2 mm MgSO4; 0.45 mm CaCl2; 3 μm FeCl3; 1 μm MnCl2; 1 μm ZnCl2; 0.3 μm CrCl3, H3BO3, CoCl2, CuCl2, NiCl2, Na2MoO4, Na2SeO3) supplemented with 25 mm carbon source and used with or without kanamycin at 30 μg/ml.
Growth Test—Growth phenotyping was performed in 96-well microplates according to de Berardinis et al. (2).
Complementation Experiments—For the complementation tests, primers were designed to amplify the whole gene from start to stop codons. Primers were extended by PacI and NotI restriction sites for the primer located upstream and downstream of the gene, respectively. The PCR product was then cloned into the PacI/NotI sites of plasmid pEVL174 (2) downstream of the bacteriophage T5 promoter replacing the tdk gene and transformed in E. coli. The sequence of each plasmid construction was verified before transformation of A. baylyi ADP1. The transformation step was done as described by Metzgar et al. (16). The colonies were spread onto MA agar plates containing the desired carbon source, carbenicillin and kanamycin, both at 30 μg/ml.
Transcription Analysis—For RNA preparation, A. baylyi ADP1 cells were cultured at 30 °C to midexponential phase in MA containing succinate or d-glucarate as the sole carbon source. The bacterial culture was stopped by adding 1.25 ml of stabilization solution (5% phenol plus 95% ethanol) per 10 ml of culture. The culture was then centrifuged at 4300 × g for 10 min at 4 °C. The supernatant was discarded. After lysozyme digestion, the bacterial cells were lysed by adding 1% SDS at 64 °C. Then one-tenth volume of 1 m sodium acetate (pH 5.2) and an equal volume of saturated phenol/water were added and incubated for 6 min at 64 °C. After chilling on ice, the tubes were centrifuged at 1000 × g for 10 min at 4 °C. The upper phase was transferred to a new tube and was extracted by an equal volume of chloroform. The RNA was precipitated from the supernatant by 2.5 volumes of absolute ethanol in the presence of 0.3 m sodium acetate (pH 5.2) and centrifuged at 12,000 × g for 30 min at 4 °C. The quality of the extracted RNA was checked by agarose gel electrophoresis, and the incidental DNA contamination was checked by PCR using specific primers. In case of DNA contamination, an additional DNase digestion was carried out.
Co-transcription was assayed on reverse transcribed RNA by using PCR primers designed to generate specific fragments if two consecutive genes are transcribed on the same RNA molecule. The primers used are shown in the supplemental data (Table S1).
The reverse transcription-PCRs were carried out using the Qiagen One Step RT-PCR kit. Briefly, 350 ng of total RNA was used as starting material. The reverse transcription was carried out at 50 °C for 30 min, followed by a denaturation step at 95 °C for 15 min. Then 35 cycles of PCR were performed (94 °C for 30 s, 52 °C for 1 min, 72 °C for 2 min). The results were analyzed by agarose gel electrophoresis.
The quantitative PCR was carried out in 25 μl, in a MX3005P qPCR machine (Stratagene). After 3 min of denaturing at 95 °C, 40 cycles of PCR were carried out (95 °C for 30 s, 55 °C for 30 s, 72 °C for 15 s). The data were analyzed using comparative relative quantifications with correction for reaction efficiency. The primers used for quantitative PCR are shown in the supplemental data (Table S1).
Construction of the Expression Vectors—The CDS of d-glucarate dehydratase (GDH), KDG dehydratase, and α-KGSA dehydrogenases from A. baylyi ADP1 and Pseudomonas putida (αKGSADH_ADP1 and αKGSADH_PP, respectively) were amplified by PCR with the primer set shown in the supplemental data (Table S1). The amplified sequences were inserted into the Invitrogen pEXP5-NT/TOPO vector according to the manufacturer's protocol. The sequences of the resulting plasmids were verified.
Expression and Purification of the Recombinant Proteins—The same protocol for expression and purification was set up for each protein. The modified expression vector was transformed into E. coli BL21 DE3 (Invitrogen). Transformed cells were grown in 0.25 liter of Terrific Broth medium containing 0.5 m sorbitol, 5 mm betaine, and 100 μg/ml carbenicillin at 37 °C until reaching an A600 of 2. Isopropyl β-d-thiogalactopyranoside was added at a concentration of 500 μm to induce protein production, and the cells were further grown at 20 °C overnight. After centrifugation, cells were washed and suspended in 30 ml of Lysis Buffer (50 mm phosphate, pH 8.0, 500 mm NaCl, 10% glycerol, and 10 mm imidazole) containing 1 mm Pefabloc SC (Roche Applied Science) and 13 μl of Lysonase™ bioprocessing reagent and sonicated using an ultrasonic processor. After centrifugation to clarify the cell extract, the supernatant was loaded onto a 1-ml HisTrap FF column (Amersham Biosciences) using anÄkta Explorer (Amersham Biosciences). After sample loading, the column was washed with Lysis Buffer, and the protein was eluted with the same buffer containing 250 mm imidazole. Buffer exchange was performed using a HiPrep 26/10 desalting column (Amersham Biosciences) with a mobile phase composed of 50 mm Tris, pH 8.0, 50 mm NaCl, 10% glycerol, and 1 mm dithiothreitol. The protein was further purified by ion exchange using a MonoQ 5/50 GL column (Amersham Biosciences). The protein was eluted with an NaCl gradient ranging from 50 mm to 1 m over 100 column volumes. Finally, the protein was submitted to gel filtration on a Superdex 200 column (Amersham Biosciences). The purified protein was stored at –80 °C. The samples were analyzed by SDS-PAGE using the Invitrogen NuPAGE system.
Preparation of A. baylyi ADP1 Cell Extracts—Cells were grown on MA supplemented with 25 mm of the desired carbon source. 200-ml cultures were grown at 30 °C with vigorous shaking until reaching an A600 of 1. After centrifugation, cells were suspended in 3 ml of Lysis Buffer containing 1 mm Pefabloc SC (Roche Applied Science) and 1 μl of Lysonase™ bioprocessing reagent and sonicated. The cells were centrifuged, and the supernatant was collected. Protein concentration was determined by the Bradford method with bovine serum albumin as the standard (Bio-Rad).
Analytical Methods—NADH and NADPH were determined spectrophotometrically at 340 nm using a molar extinction coefficient of 6220 m–1 cm–1. α-KGSA was assayed by 5 μgof α-KGSA dehydrogenase in the presence of 4 mm NADP+ in Activity Buffer. Its concentration was given by monitoring the formation of NADPH spectrophotometrically. Enzymatic reactions were stopped by trifluoroacetic acid and neutralized by 5 m K2CO3. α-Ketoglutarate was assayed with glutamate dehydrogenase in the presence of 50 mm NH4Cl in 100 mm Tris, pH 7.5.
LC/MS Analyses—All LC/MS analyses were carried out using an LTQ/Orbitrap high resolution mass spectrometer coupled to a Accela LC system (Thermo-Fisher). Chromatographic separation of metabolites was conducted using an IOA-1000 column (9 μm, 7.8 × 300 mm; Alltech) thermostatted at 60 °C using an isocratic gradient (water plus 0.05% trifluoroacetic acid) at a flow rate of 0.5 ml/min. The entire eluant was sprayed into the mass spectrometer using a heated electrospray ionization source (150 °C) at 4.5 kV with sheath, auxiliary, and sweep gases set at 50, 35, and 5 arbitrary units, respectively. Desolvation of the solvent droplets was further aided by setting the heated capillary temperature at 275 °C. d-Glucarate and its metabolites were detected by full scan mass analysis from m/z 50–1000 at a resolving power of 30,000 at m/z = 400. Data-dependent scanning was performed without use of a parent ion list. The resulting fragment ions were recorded in the LTQ linear trap.
Enzyme Assays—d-Glucarate dehydratase activity was assayed according to a modified procedure of MacGee and Doudoroff (17). KDG was quantified by detection of its semicarbazone at 250 nm upon reaction with semicarbazide in an end point assay. The enzyme assay was conducted using 0.35 μg of d-glucarate dehydratase in 500 μl of Activity Buffer containing 5 mm MgCl2. The reaction was initiated by the addition of d-glucarate and stopped after 0, 1, 2, 3, and 4 min with 2% (v/v) trifluoroacetic acid. The sample was mixed with 500 μl of 0.1 m semicarbazide hydrochloride (containing 1.5% sodium acetate trihydrate). The mixture was incubated at 22 °C for 30 min, and its absorbance was read in the spectrophotometer. An experimental value of 7200 m–1 cm–1 was determined for the extinction coefficient of KDG semicarbazone.
KDG dehydratase activity was assayed in a coupled assay with α-KGSA dehydrogenase, in the presence of NADP+, by monitoring the formation of the resulting reduced pyridine nucleotide. The coupled assay was conducted using 0.5 μgof KDG dehydratase, 2 μgof α-KGSA dehydrogenase, and 4 mm NADP+ in 500 μl of Activity Buffer. The reaction was initiated by the addition of KDG.
α-KGSA dehydrogenase activity was assayed in the presence of various substrates and with NAD+ or NADP+ as cofactors by monitoring the formation of the reduced pyridine nucleotide. Reactions were usually performed in 100 μl of Activity Buffer. The reaction was initiated by the addition of the substrate. The kinetic parameters from these three enzymes were obtained from duplicate experiments by nonlinear analysis of initial rates.
The coupled assay involving d-glucarate dehydratase, KDG dehydratase, and α-KGSA dehydrogenase was conducted using 0.3 μgof d-glucarate dehydratase, 0.3 μg of KDG dehydratase, 0.06 μgof α-KGSA dehydrogenase, 5 mm MgCl2, and 1 mm NADP+ in 100 μl of Activity Buffer. Reactions were initiated by the addition of 150 μm glucarate. The stoichiometry of the reaction was determined at equilibrium by monitoring NADPH formation. Enzymatic reactions were stopped by trifluoroacetic acid and neutralized by K2CO3. The final product of the coupled assay, α-ketoglutarate, was then quantified in the presence of glutamate dehydrogenase and NH4Cl.
α-KGSA dehydrogenase activity in cell extracts was assayed at 340 nm with 100 μg of protein in 100 μl of Activity Buffer containing 100 μm NADP+. The reaction was measured under two different experimental conditions, in the presence of either 200 μm α-KGSA or 1.5 mm d-glucarate (in the presence of 5 mm MgCl2). All enzymatic reactions were performed at 25 °C in a Safas UV mc2 or a Lambda 650 PerkinElmer double beam spectrophotometer.
RESULTS AND DISCUSSION
Finding Genes Involved in d-Glucarate/d-Galactarate Degradation—The growth of the whole mutant collection was investigated on liquid MA minimal medium containing either succinate or d-glucarate as the sole carbon source. Growth data are shown in the supplemental data (Fig. S1). Eight mutants were either unable to grow or had a severe growth impairment on d-glucarate (Table 1). These genes are good candidates for being involved in d-glucarate degradation. Four of them are co-located on the genome (ACIAD0127, ACIAD0128, ACIAD0130, and ACIAD0131) and are respectively annotated as d-glucarate/d-galactarate permease, d-glucarate dehydratase, KDG dehydratase, and putative α-KGSA dehydrogenase. All of these mutants plus two additional ones annotated as a d-galactarate dehydratase and a transcriptional regulator (ACIAD0126 and -0132) located immediately upstream and downstream from the gene cluster were tested individually for growth on either d-glucarate or d-galactarate. As expected, deletion mutants for ACIAD0127/0128/0130/0131 are unable to grow on d-glucarate, whereas deletion mutants for ACIAD0126/0127/0130/0131 are unable to grow on d-galactarate. The mutant ACIAD0132, annotated as a putative transcriptional regulator, shows no growth defect on both media. These results are consistent with a degradation pathway of d-glucarate/d-galactarate involving the d-glutarate/d-galactarate permease (ACIAD0127), followed by a dehydration in KDG by a dehydratase specific for d-glucarate (ACIAD0128) and one specific for d-galactarate (ACIAD0126). KDG is then converted to α-ketoglutarate by the sequential action of KDG dehydratase (ACIAD0130) and α-KGSA dehydrogenase (ACIAD0131). This d-glucarate degradation pathway is similar to the one proposed in P. putida. We have attempted to complement mutants ΔACIAD0126, ΔACIAD0127, ΔACIAD0128, ΔACIAD0130, and ΔACIAD0131 by the corresponding coding sequences (CDS) cloned in the expression vector pEVL174. The rescue of the wild type phenotype is obtained for d-glucarate and d-galacarate dehydratases (ACIAD0128 and ACIAD0126) and the α-KGSA dehydrogenase (ACIAD0131). The mutant ΔACIAD0127 is not rescued when the CDS is cloned under the control of the T5 promoter, but the rescue is obtained when the 373-bp region upstream of the CDS, which is supposed to contain the actual promoter, is kept. This result suggests that the T5 promoter is not strong enough to achieve functional complementation. Growth of ΔACIAD0130 complemented by the corresponding CDS on d-glucarate is obtained after 5–7 days of incubation. The lag time observed is explained by an increase by a factor of 10 in the division time of the complemented mutant compared with the wild type and could be due to the limited amount of α-ketoglutarate produced by the d-glucarate degradation. This hypothesis has been confirmed by the wild type growth observed in the mutant ΔACIAD0128-130-131 complemented by the operon (ACIAD0128-130-131) under the control of its own promoter (373 bp upstream from the AUG of ACIAD0128). Other complementation experiments were performed and confirmed this result (data not shown).
TABLE 1.
Function of the eight genes required for efficient growth on d-glucarate
| Gene ID | Function |
|---|---|
| ACIAD0127 | d-Glucarate/d-Galactarate permease |
| ACIAD0128 | d-Glucarate dehydratase |
| ACIAD0130 | 5-Dehydro-4-deoxyglucarate dehydratase |
| ACIAD0131 | α-Ketoglutarate semialdehyde dehydrogenase |
| ACIAD0244 | Regulatory protein, P-II 2, for nitrogen assimilation |
| ACIAD2275 | Lipoate synthase |
| ACIAD2417 | Methyl transferase |
| ACIAD2876 | α-Ketoglutarate decarboxylase, component of the α-ketoglutarate dehydrogenase complex (E1) |
The four remaining mutants (ACIAD2447, -0244, -2275, and -2876) were also tested individually for growth on minimal medium supplemented with either d-glucarate or d-galactarate. All but one (ACIAD0244) show altered growth on both media. ACIAD2876 encodes the E1 subunit of the α-ketoglutarate dehydrogenase and ACIAD2275, a lipoate synthase that catalyzes the formation of lipoic acid, a cofactor required for function of the α-ketoglutarate dehydrogenase complex. Since the end product of d-glucarate degradation is α-ketoglutarate, a metabolite present in the tricarboxylic acid cycle, the essentiality of these two genes for growth on d-glucarate is expected. Moreover, two lipoate synthases are present in the Acinetobacter genome, and the growth of only one of the mutants is impaired on d-glucarate/d-galactarate. This suggests that only the product ACIAD2275 is involved in the α-ketoglutarate dehydrogenase complex for growth on these compounds. The other mutant with impaired growth on d-glucarate encodes a methyl transferase (ACIAD2447), and further investigations will be needed to connect the observed phenotype with the function of this gene.
Expression and Purification of the Enzymes Involved in d-Glucarate Degradation—The three enzymes from A. baylyi ADP1 were produced by cloning their respective CDS into pEXP5-N/TOPO vector for recombinant overexpression in E. coli. The corresponding vectors were transformed into BL21 DE3 cells and the proteins produced and purified using immobilized metal affinity chromatography, anion exchange, and gel filtration. Sorbitol and betaine were added to the culture medium to improve the yield of soluble and properly folded recombinant protein (18). Under these conditions, at least 3 mg of pure and soluble protein were obtained per liter of culture. The purified proteins had an apparent molecular mass of around 38, 55, and 62 kDa on SDS-PAGE, consistent with the calculated molecular masses of 34.96, 51.36, and 58, 48 kDa, for d-glucarate dehydratase, KDG dehydratase, and α-KGSA dehydrogenase, respectively. According to gel filtration experiments, d-glucarate dehydratase was purified as a homotetramer, as reported for the enzymes of P. putida and E. coli (6, 19). α-KGSA dehydrogenase is functional as a homodimer, as previously reported in P. putida (9). But, in contrast to earlier studies conducted by Dagley and Jeffcoat (13) in which KDG dehydratase from P. acidovorans was described as a dimer, the enzyme of A. baylyi ADP1 appears to be a homotetramer.
Functional Assay of the Putative d-Glucarate Degradation Pathway in a Coupled Assay with d-Glucarate Dehydratase, KDG Dehydratase, and α-KGSA Dehydrogenase—A tricoupled enzymatic assay, combining d-glucarate dehydratase, KDG dehydratase, and α-KGSA dehydrogenase, was set up to generate α-ketoglutarate from d-glucarate. The reactions could be monitored by assaying NADPH and α-ketoglutarate. Results reported in Table 2 are consistent with those expected from the global reaction presented in Fig. 1. For each mole of d-glucarate consumed, 1 mol of NADPH (generated by α-KGSA dehydrogenase) and 1 mol of α-ketoglutarate were formed. Since the reactions were monitored using highly purified proteins, it is highly unlikely that the observed products result from other uncharacterized and unexpected activities. Furthermore, LC/MS experiments were conducted to detect each intermediate of the d-glucarate degradation pathway. First, 4 mm d-glucarate was incubated alone in 2 ml of 10 mm phosphate buffer, pH 7.5, containing 5 mm MgSO4.20 μl of the mixture were injected in the LC/MS system. d-Glucarate was detected only in the negative ionization mode at m/z 209.0303, with an accuracy of 2.7 ppm. In a second step, 10 μgof d-glucarate dehydratase were added to the sample and incubated for 1 h. KDG was monitored in the positive ionization mode at m/z 193.0341 (accuracy: 3.6 ppm). As expected, d-glucarate was completely converted by d-glucarate dehydratase (13), since it was no longer detected. In a third step, 10 μg of KDG dehydratase were added to the previous sample and incubated for a further 1 h. The conversion was complete, since KDG could be no longer be detected. The product was detected in the positive ionization mode with a measured m/z 131.0335 (accuracy: 7 ppm). Finally, 10 μgof α-KGSA dehydrogenase were allowed to react with the previous mix for 1 h. All α-KGSA was converted to α-ketoglutarate, as previously reported (20). The product was detected in the positive ionization mode with a measured value identical to the theoretical one for the mass of the MH+ form of α-ketoglutarate: 147.0293. MS/MS experiments yielded three fragments with measured masses of 129.02, 115.15, and 101.08. Injection of a preparation of commercial α-ketoglutarate gave the same retention time and mass and yielded the same fragmentation pattern, further confirming the identity of the enzymatic product. In conclusion, LC/MS analyses confirmed the identity of each metabolite, confirming in turn the involvement of each candidate gene in the degradation of d-glucarate.
TABLE 2.
Stoichiometry of the tricoupled enzymatic assay
Values correspond to the average of two replicates.
|
Concentration |
||
|---|---|---|
| Initial | Final | |
| μm | ||
| Substrate | ||
|
d-Glucarate
|
150 ± 3
|
0
|
| Products | ||
| NADPH | 0 | 141 ± 5 |
| α-Ketoglutarate | 0 | 139 ± 11 |
Enzymatic Characterization of A. baylyi ADP1 d-Glucarate Dehydratase Activity—Formation of the α-keto acid semicarbazone could not be continuously monitored, since semicarbazide inhibits d-glucarate dehydratase activity (not shown). Kinetic analyses were therefore performed in an end point assay, and the parameters are reported in Table 3.
TABLE 3.
Kinetic parameters for d-glucarate dehydratase and KDG dehydratase
Values correspond to the average of two replicates.
| Enzyme | Km | kcat | kcat/Km |
|---|---|---|---|
| μm | s-1 | s-1m-1 | |
| d-Glucarate dehydratase | 101 ± 15 | 6.39 ± 0.26 | 6.33 × 10⁴ |
| KDG dehydratase | 203 ± 6 | 3.90 ± 0.04 | 1.92 × 10⁴ |
Enzymatic Characterization of A. baylyi ADP1 KDG Dehydratase Activity—Kinetic constants of KDG dehydratase were determined using a coupled assay with an excess of α-KGSA dehydrogenase. Preliminary experiments with saturating concentrations of KDG were conducted to set up an assay with adequate amounts of enzymes. Under these conditions, the rate of formation of NADPH was strictly proportional to the amount of KDG dehydratase and independent of the amount of α-KGSA dehydrogenase. The kinetics of KDG dehydration/decarboxylation were hyperbolic, and the constants are reported in Table 3.
Enzymatic Characterization of A. baylyi ADP1 α-KGSA Dehydrogenase Activity—First, the kinetic constants of α-KGSA dehydrogenase for NAD+ and NADP+ were evaluated with α-KGSA as the substrate. The assays were performed by varying NAD+ or NADP+ concentration at a saturating concentration of α-KGSA and determining the initial rates of reaction for each cofactor. In a second set of experiments, the kinetic constants of α-KGSA dehydrogenase for various substrates, including α-KGSA, were determined in the presence of NAD+ or NADP+. The cofactor concentrations were kept constant while varying the substrate concentration. α-KGSA used in these experiments was produced enzymatically from d-glucarate in a coupled assay using d-glucarate dehydratase and KDG dehydratase simultaneously. The α-KGSA formed was assayed afterward by purified α-KGSA dehydrogenase and NADP+. As reported above, the conversion of d-glucarate to α-ketoglutarate is complete, as indicated by data in Table 2 and LC/MS experiments. Indeed, the α-KGSA assay with purified α-KGSA dehydrogenase confirmed that all d-glucarate was converted to α-KGSA by the enzymatic system. Thus, α-KGSA concentrations used here for the determination of the kinetic constants of α-KGSA dehydrogenase did not need to be corrected. In conclusion, both kcat and Km values presented here are probably not apparent ones.
Kinetics of α-KGSA dehydrogenation were sigmoidal, as illustrated in Fig. 2A. Values of v at various substrate concentrations were fit using nonlinear regression, according to the general Hill equation,
 |
(Eq. 1) |
where S50 is the substrate concentration showing a half-maximal velocity, n is the Hill coefficient, and Vmax is the maximal velocity. The Hill coefficient n was also determined from plots of log(v/(Vmax – v) versus log S (Hill plot) using linear regression (Table 4). The cooperative behavior is unambiguously illustrated in Fig. 2B by the nonlinearity of the Eadie-Hofstee plot (v versus v/[S]). Cooperativity in α-KGSA dehydrogenation was observed with both NAD+ and NADP+. The resulting kinetic parameters are presented in Table 4.
FIGURE 2.

Comparison of the steady-state kinetic behavior of α-KGSA and propanal oxidation by α-KGSA dehydrogenase of A. baylyi ADP1, in the presence of 100μm NADP+ in Activity Buffer. A, plot of v versus [S] forα-KGSA oxidation, with a line drawn using the SigmaPlot software (Systat Software, Inc.) and Equation 1. B, Eadie-Hofstee representation (v versus v/[S]) of the values presented in A. α-KGSA oxidation experiments were performed with an enzyme concentration of 0.25 μg/ml. C, plot of v versus [S] for propanal oxidation, with a line drawn using the Michaelis-Menten equation. D, Eadie-Hofstee representation (v versus v/[S]) of the values presented in C. Propanal oxidation experiments were performed with an enzyme concentration of 6 μg/ml.
TABLE 4.
Kinetic parameters of α-KGSA dehydrogenation determined from a sigmoidal Vmax model
Values correspond to the average of two replicates.
| Cofactor | Vmaxa | S50a | n |
|---|---|---|---|
| nmol product, s-1 nmol enzyme-1 | μm | ||
| NADP+b | 68.5 ± 2.5 | 22 ± 2 | 2.0 ± 0.2a (1.4 ± 0.1)d |
| NAD+c | 87.7 ± 3.3 | 42 ± 3 | 1.9 ± 0.2a (1.3 ± 0.1)d |
Each value represents the parameter determined by the nonlinear least squares method.
NADP+ concentration was 100 μm.
NAD+ concentration was 4 mm.
Each value represents the parameter determined by the linear least squares method (see “Results and Discussion”).
Conversely, kinetics of α-KGSA dehydrogenation conducted with a fixed α-KGSA concentration and increasing NAD+ or NADP+ concentrations were hyperbolic. Although α-KGSA dehydrogenase is active with both NAD+ and NADP+, it can be considered as an NADP+-preferring enzyme, since it is 58 times more efficient with NADP+, as indicated by the ratios kcat/K NADP+ and kcat/Km NAD+ (Table 5). This difference lies in the lower value of Km, since kcat values are not affected by the nature of the pyridine nucleotide. These experimental results are in agreement with the presence of a serine at position 181. A serine or threonine residue at position 181 is a structural determinant of NADP+ specificity in aldehyde dehydrogenases, whereas a glutamate residue is typically found at this position in enzymes that prefer NAD+ (21). More surprisingly, when various aldehydes were tested as substrates for α-KGSA dehydrogenase, the initial rates of dehydrogenation never indicated a cooperative behavior. The saturation curves of v versus [S] for the purified enzyme were always hyperbolic, as illustrated in Fig. 2C for propanal dehydrogenation and confirmed in Fig. 2D by the linearity of the Eadie-Hofstee representation. Kinetic parameters for these aldehydes were thus determined using the Michaelis-Menten equation (Table 5). Results indicate that A. baylyi ADP1 α-KGSA dehydrogenase is rather substrate-specific. Although the enzyme could oxidize several aldehydes, they are poorly metabolized, since the ratios kcat/Km only ranged from 7 × 10⁻⁴% (succinic semialdehyde in the presence of NAD+) to 0.367% (glutaraldehyde in the presence of NAD+) of the value obtained with α-KGSA in the presence of NADP+ (Table 5). Furthermore, considering glutaraldehyde dehydrogenation, the kinetic parameters presented here are apparent ones, since in this study each glutaraldehyde molecule is oxidized twice, on both aldehyde groups (not shown).
TABLE 5.
Kinetic parameters of α-KGSA dehydrogenase oxidations determined from a hyperbolic Vmax model
Values correspond to the average of two replicates.
| Substrate | Km | kcat | kcat/Km |
|---|---|---|---|
| μm | s-1 | s-1m-1 | |
| NAD+ (α-KGSA)a | 870 ± 60 | 57.00 ± 1.00 | 6.5 × 10⁴ |
|
NADP+
(α-KGSA)a |
15 ± 2
|
55.00 ± 2.00
|
3.7 × 10⁶ |
| Succinate semialdehyde | |||
| NADP+b | 450 ± 70 | 0.06 ± 0.01 | 1.3 × 10² |
|
NAD+c |
1660 ± 200
|
0.05 ± 0.01
|
3.0 × 101 |
| Propanal | |||
| NADP+b | 1050 ± 40 | 2.07 ± 0.03 | 2.0 × 10³ |
|
NAD+c |
300 ± 50
|
0.58 ± 0.03
|
1.9 × 10³ |
| Glutaraldehyde | |||
| NADP+b | 310 ± 30 | 4.13 ± 0.08 | 1.3 × 10⁴ |
| NAD+c | 100 ± 10 | 0.65 ± 0.01 | 6.5 × 10³ |
| Acetaldehyde (NADP+)b | 3900 ± 900 | 0.41 ± 0.03 | 1.0 × 10² |
α-KGSA concentration was 300 μm.
NADP+ concentration was 100 μm.
NAD+ concentration was 4 mm.
Although α-KGSA dehydrogenases have been characterized after purification (9, 15, 20, 22), none of them has been described as showing sigmoidal kinetics so far. The first study of purified α-KGSA dehydrogenase involved in glucarate degradation was conducted on the native enzyme from P. putida (9). Although the authors did not mention non-Michaelian kinetics, we nevertheless decided to confirm the behavior of the recombinant enzyme from P. putida using the same experimental conditions as those applied for Acinetobacter, since it has been shown that investigations conducted by different groups using different experimental procedures could lead to different conclusions concerning the allosteric behavior of the threonine deaminase of E. coli K-12 (23). Although three distinct α-KGSA dehydrogenase activities have been reported in P. putida (9, 22), the availability of its complete genome sequence (24) allowed us to identify the gene most likely involved in d-glucarate degradation. According to the proposed gene annotation, the genes in P. putida involved in d-glucarate degradation are mostly co-located on the genome. In this cluster, an α-KGSA dehydrogenase (encoded by PP3602) shares 57.39% identity with the one from A. baylyi ADP1. Hence, this gene has been cloned for expression in E. coli, and the protein has been purified to homogeneity. The kinetic parameters of α-KGSA dehydrogenase from P. putida with α-KGSA as the substrate were determined in the presence of NADP+ (presence of a serine at position 181). In contrast to A. baylyi ADP1, the α-KGSA dehydrogenase of P. putida shows hyperbolic kinetics (not shown) with a Km value for α-KGSA of 14.0 ± 1.5 μm and a kcat value of 197 ± 5 s–1. The Km value is in the same range as the one published earlier (22). Therefore, the sigmoidal behavior of the enzyme seems to be a unique feature of A. baylyi ADP1 rather than a property of the family of glucarate pathway α-KGSA dehydrogenases. Because the experiments were conducted with highly purified recombinant protein, the sigmoidal behavior of α-KGSA dehydrogenase of A. baylyi ADP1 could not be attributed to the presence of two distinct enzymes. Our hypothesis is that the mechanism involves a conformational change induced by α-KGSA binding. The calculated value of the Hill coefficient, for both NAD+ and NADP+, is consistent with one binding site per subunit, since the functional enzyme is a homodimer (see above). Binding of a ligand to one subunit of the α2 dimer may cause a conformational change that increases the binding affinity of the second subunit for the ligand, leading to positive homotropic cooperativity. However, it is unknown if this allosterism is best described by the concerted MWC (25) or the sequential KNF (26) model. On the other hand, considering the low “performance constant” (i.e. kcat/Km) (27) of the other substrates, one could hypothesize that the binding of the poor substrates did not induce the conformational change to activate the enzyme, leading to hyperbolic patterns.
One could hypothesize that as α-KGSA dehydrogenase undergoes allosteric activation by its own substrate, the enzyme could be negatively regulated by its product, α-ketoglutarate. However, no inhibitory effect was observed with this molecule or with its closely related compound, glutamate. Indeed, we did not identify any inhibitor for the α-KGSA dehydrogenase of A. baylyi ADP1.
The d-Glucarate Degradation Gene Cluster; Transcription and Expression Analysis—The gene context of the d-glucarate degradation pathway is shown in Fig. 3. ACIAD0128 to -0131 are transcribed in the same orientation together with a putative transcriptional regulator (ACIAD0132). The d-glucarate/d-galactarate permease (ACIAD0127) is transcribed on the opposite strand together with a d-galactarate dehydratase (ACIAD0126).
FIGURE 3.
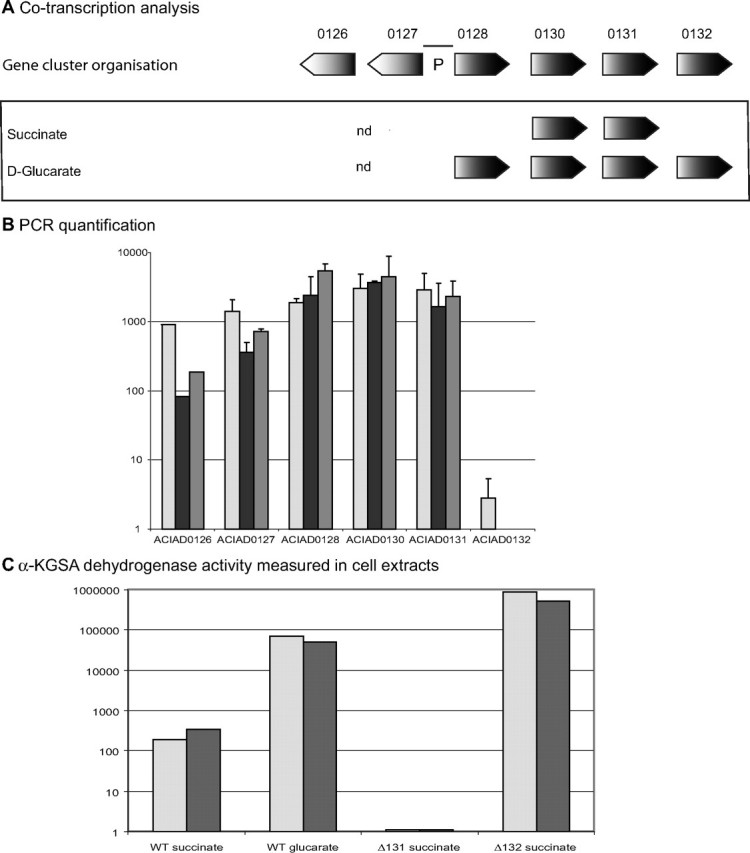
Transcriptional and enzymatic analysis of d-glucarate degradation in A. baylyi ADP1. A, diagram of gene clusters involved in d-glucarate/d-galactarate degradation. For each medium, genes are present if evidence of co-transcription of two consecutive genes was found. nd, the experiment was not performed. The black line at the top (P) refers to the 373-bp region located between ACIAD0127 and ACIAD0128 containing the putative operon promoter. B, results of the quantitative PCR analysis. Two independent experiments were considered except for ACIAD0126. The induction reported on the y axis is calculated as 2n (where n represents the difference in number of PCR cycles required to reach a defined amount of PCR product between RNA extracted from the wild type (WT) grown on succinate and the strain/grown under the conditions tested). Light gray, gray, and black boxes correspond to experiments performed with wild type grown on d-glucarate, ΔACIAD0132 grown on succinate, and ΔACIAD0132 grown on d-glucarate, respectively. C, α-KGSA dehydrogenase activity measured in cell extracts. Values correspond to the average of three replicates. Light gray and gray boxes represent experiments triggered with 1.5 mm d-glucarate and 200 μm α-KGSA, respectively. Experiments done with d-glucarate were conducted in Activity Buffer containing 5 mm MgCl2 and 100 μm NADP+. Activities are expressed in pmol of α-ketoglutarate/min/mg of protein.
The co-transcription of these genes was assayed on reverse transcribed RNA by using PCR primers designed to generate specific fragments if two consecutive genes are transcribed on the same RNA molecule. We detect specific PCR products that indicate the presence of RNA molecules overlapping ACIAD0128/0130, ACIAD0130/0131, and ACIAD0131/0132 when wild type A. baylyi ADP1 cells are grown on minimal medium supplemented with d-glucarate. In contrast, when cells are grown on succinate, only the presence of RNA molecules overlapping ACIAD0130/0131 was detected. These data are in favor of the transcription of these genes as an operon only in the presence of d-glucarate. The level of transcription of ACIAD0126 to ACIAD0132 was analyzed by real time PCR under two different growth conditions: succinate versus d-glucarate. The results are reported in Fig. 3. When grown on d-glucarate, the transcription level of ACIAD0126, ACIAD0127, ACIAD0128, ACIAD0130, and ACIAD0131 increases by a factor of 1000 as compared with succinate (Fig. 3). Surprisingly, such an enhancement of the transcription level is not found for ACIAD0132, although co-transcription of ACIAD0132 and ACIAD0131 has been suggested. This apparent contradiction could be resolved if one assumes that the PCR product detected in the co-transcription analysis represents, in fact, a very small number of RNA molecules. The lack of induction of transcription of ACIAD0132 as compared, for instance, to ACIAD0131 argues for the hypothesis that the co-transcription of ACIAD0131 and ACIAD0132 is probably a minor feature and that the transcription of ACIAD0132 is mainly controlled by its own promoter, which could reside within ACIAD0130 or -0131. Alternatively, a partial attenuation could also explain the lower level of ACIAD0132 transcripts. In the mutant background, ΔACIAD0132, grown on both succinate and d-glucarate, the level of transcription of ACIAD0126/0127/0128/0130/0131 is comparable with the level of transcription found in wild type cells grown on d-glucarate, indicating the possible role of ACIAD0132 as a transcriptional repressor. It can be hypothesized that in the absence of d-glucarate, the protein encoded by ACIAD0132 binds a DNA sequence interfering with, for instance, the binding of RNA polymerase, thus preventing efficient gene transcription. In the presence of d-glucarate, this metabolite, or a derivative, binds the repressor, causing a conformational change resulting in its inability to bind the promoter, thus allowing an efficient transcription of the operon. This type of negative transcriptional regulation was described in 1961 by Jacob and Monod (28). It should be noted that this regulatory effect affects the two gene clusters that are located on two different strands (Fig. 3).
Furthermore, we measured NADP+-dependent α-KGSA dehydrogenation in crude lysates from cells with different genetic backgrounds and grown under different conditions (succinate or d-glucarate as the carbon source). Reactions were triggered either with α-KGSA or d-glucarate to monitor the global activity of the d-glucarate degradation pathway. Results are reported in Fig. 3. Both substrates were used at a saturating concentration; α-KGSA was used at 200 μm (S50 = 22 μm), and d-glucarate was used at a concentration of 1.5 mm (Km = 101 μm). α-KGSA dehydrogenase activity in cell extracts from the mutant ΔACIAD0131 grown on succinate as the sole carbon source was undetectable under our experimental conditions. The absence of activity even when the reaction was triggered by α-KGSA indicates that, in contrast to P. putida, no gene with a significant α-KGSA dehydrogenase activity is constitutively expressed in A. baylyi ADP1 (22, 29). Only a very slight α-KGSA dehydrogenase activity could be detected in the lysate from wild type cells grown on succinate using both d-glucarate and α-KGSA to trigger the reaction. These results are consistent with the low level of ACIAD0128, ACIAD0130, and ACIAD0131 transcripts detected in wild type cells grown on succinate (Fig. 3). In contrast, α-KGSA dehydrogenase activity was strongly enhanced when measured in extracts from wild type cells grown on d-glucarate. This increase could be observed both with α-KGSA and d-glucarate as substrates. Once again, these results are in good agreement with the high increase detected in the transcription level of ACIAD0128, ACIAD0130, and ACIAD0131 in wild type cells grown on d-glucarate compared with those grown on succinate (Fig. 3). The strongest α-KGSA dehydrogenase activity was detected in lysates from the mutant ΔACIAD0132 grown on succinate. These results are consistent with the role of ACIAD0132 as a transcriptional repressor. Moreover, these data suggest that the derepression of the operon transcription is not complete in the presence of d-glucarate.
Conclusion—Taking advantage of the availability of the complete collection of single-gene deletion mutants of A. baylyi ADP1, we have identified and kinetically characterized the enzymes involved in the degradation of d-glucarate by A. baylyi ADP1. The genes encoding these enzymes were easily identified by the high throughput profiling of the whole mutant collection for growth on a medium containing d-glucarate as the sole carbon source. This has led to the report of a gene coding for a KDG dehydratase and cooperative behavior for an α-KGSA dehydrogenase. Furthermore, identification of these genes within a single organism facilitated their transcription and expression analysis and enabled us to propose a model for the regulation of this metabolic pathway. This model is reminiscent of the well known negative regulation of the lac operon. A complementary study concerning the relative efficiencies of the d-galactarate and d-glucarate pathways is currently in progress.
This work illustrates the potential of such a resource for the improvement of functional genomics. This mutant collection should enhance the identification of gene function and the elucidation of aspects of metabolism that remain to be characterized, in particular catabolic pathways, via the analysis of growth phenotypes on defined compounds that can be degraded by this bacterium.
Supplementary Material
Acknowledgments
We are very grateful to George Cohen for continuous support and helpful discussions. We also thank Agnes Pinet for excellent technical assistance and Susan Cure for reading the manuscript.
This work was supported in part by the Commissariat à l'Energie Atomique. The costs of publication of this article were defrayed in part by the payment of page charges. This article must therefore be hereby marked “advertisement” in accordance with 18 U.S.C. Section 1734 solely to indicate this fact.
The on-line version of this article (available at http://www.jbc.org) contains supplemental Table S1 and Fig. S1.
Footnotes
The abbreviations used are: KDG, d-5-keto-4-deoxyglucarate; α-KGSA, α-ketoglutarate semialdehyde; CDS, coding sequence; GDH, d-glucarate dehydratase; LC, liquid chromatography; MS, mass spectrometry.
References
- 1.Barbe, V., Vallenet, D., Fonknechten, N., Kreimeyer, A., Oztas, S., Labarre, L., Cruveiller, S., Robert, C., Duprat, S., Wincker, P., Ornston, L. N., Weissenbach, J., Marliere, P., Cohen, G. N., and Medigue, C. (2004) Nucleic Acids Res. 32 5766–5779 [DOI] [PMC free article] [PubMed] [Google Scholar]
- 2.de Berardinis, V., Vallenet, D., Castelli, V., Besnard, M., Pinet, A., Cruaud, C., Samair, S., Lechaplais, C., Gyapay, G., Richez, C., Durot, M., Kreimeyer, A., Le Fèvre, L., Schächter, V., Pezo, V., Döring, V., Scarpelli, C., Médigue, C., Cohen, G. N., Marlière, P., Salanoubat, M., and Weissenbach, J. (2008) Mol. Syst. Biol. 4 174. [DOI] [PMC free article] [PubMed] [Google Scholar]
- 3.Trudgill, P. W., and Widdus, R. (1966) Nature 211 1097–1099 [DOI] [PubMed] [Google Scholar]
- 4.Blumenthal, H. J., and Fish, D. C. (1963) Biochem. Biophys. Res. Commun. 11 239–243 [DOI] [PubMed] [Google Scholar]
- 5.Kay, H. D. (1926) Biochem. J. 20 321–329 [DOI] [PMC free article] [PubMed] [Google Scholar]
- 6.Gulick, A. M., Hubbard, B. K., Gerlt, J. A., and Rayment, I. (2000) Biochemistry 39 4590–4602 [DOI] [PubMed] [Google Scholar]
- 7.Hubbard, B. K., Koch, M., Palmer, D. R., Babbitt, P. C., and Gerlt, J. A. (1998) Biochemistry 37 14369–14375 [DOI] [PubMed] [Google Scholar]
- 8.Hosoya, S., Yamane, K., Takeuchi, M., and Sato, T. (2002) FEMS Microbiol. Lett. 210 193–199 [DOI] [PubMed] [Google Scholar]
- 9.Koo, P. H., and Adams, E. (1974) J. Biol. Chem. 249 1704–1716 [PubMed] [Google Scholar]
- 10.Sharma, B. S., and Blumenthal, H. J. (1973) J. Bacteriol. 116 1346–1354 [DOI] [PMC free article] [PubMed] [Google Scholar]
- 11.Jeffcoat, R., Hassall, H., and Dagley, S. (1969) Biochem. J. 115 977–983 [DOI] [PMC free article] [PubMed] [Google Scholar]
- 12.Jeffcoat, R., Hassall, H., and Dagley, S. (1969) Biochem. J. 115 969–976 [DOI] [PMC free article] [PubMed] [Google Scholar]
- 13.Dagley, S., and Jeffcoat, R. (1975) Methods Enzymol. 42 272–276 [DOI] [PubMed] [Google Scholar]
- 14.Hassall, H., Jeffcoat, R., and Dagley, S. (1969) Biochem. J. 114 78P–79P [DOI] [PMC free article] [PubMed] [Google Scholar]
- 15.Watanabe, S., Yamada, M., Ohtsu, I., and Makino, K. (2007) J. Biol. Chem. 282 6685–6695 [DOI] [PubMed] [Google Scholar]
- 16.Metzgar, D., Bacher, J. M., Pezo, V., Reader, J., Doring, V., Schimmel, P., Marliere, P., and de Crecy-Lagard, V. (2004) Nucleic Acids Res. 32 5780–5790 [DOI] [PMC free article] [PubMed] [Google Scholar]
- 17.Macgee, J., and Doudoroff, M. (1954) J. Biol. Chem. 210 617–626 [PubMed] [Google Scholar]
- 18.Kreimeyer, A., Perret, A., Lechaplais, C., Vallenet, D., Medigue, C., Salanoubat, M., and Weissenbach, J. (2007) J. Biol. Chem. 282 7191–7197 [DOI] [PubMed] [Google Scholar]
- 19.Gulick, A. M., Palmer, D. R., Babbitt, P. C., Gerlt, J. A., and Rayment, I. (1998) Biochemistry 37 14358–14368 [DOI] [PubMed] [Google Scholar]
- 20.Watanabe, S., Kodaki, T., and Makino, K. (2006) J. Biol. Chem. 281 28876–28888 [DOI] [PubMed] [Google Scholar]
- 21.Cobessi, D., Tete-Favier, F., Marchal, S., Azza, S., Branlant, G., and Aubry, A. (1999) J. Mol. Biol. 290 161–173 [DOI] [PubMed] [Google Scholar]
- 22.Adams, E., and Rosso, G. (1967) J. Biol. Chem. 242 1802–1814 [PubMed] [Google Scholar]
- 23.Eisenstein, E. (1991) J. Biol. Chem. 266 5801–5807 [PubMed] [Google Scholar]
- 24.Nelson, K. E., Weinel, C., Paulsen, I. T., Dodson, R. J., Hilbert, H., Martins dos Santos, V. A., Fouts, D. E., Gill, S. R., Pop, M., Holmes, M., Brinkac, L., Beanan, M., DeBoy, R. T., Daugherty, S., Kolonay, J., Madupu, R., Nelson, W., White, O., Peterson, J., Khouri, H., Hance, I., Chris Lee, P., Holtzapple, E., Scanlan, D., Tran, K., Moazzez, A., Utterback, T., Rizzo, M., Lee, K., Kosack, D., Moestl, D., Wedler, H., Lauber, J., Stjepandic, D., Hoheisel, J., Straetz, M., Heim, S., Kiewitz, C., Eisen, J. A., Timmis, K. N., Dusterhoft, A., Tummler, B., and Fraser, C. M. (2002) Environ. Microbiol. 4 799–808 [DOI] [PubMed] [Google Scholar]
- 25.Monod, J., Wyman, J., and Changeux, J. P. (1965) J. Mol. Biol. 12 88–118 [DOI] [PubMed] [Google Scholar]
- 26.Koshland, D. E., Jr., Nemethy, G., and Filmer, D. (1966) Biochemistry 5 365–385 [DOI] [PubMed] [Google Scholar]
- 27.Koshland, D. E. (2002) Bioorg. Chem. 30 211–213 [DOI] [PubMed] [Google Scholar]
- 28.Jacob, F., and Monod, J. (1961) J. Mol. Biol. 3 318–356 [DOI] [PubMed] [Google Scholar]
- 29.Adams, B., and Rosso, G. (1966) Biochem. Biophys. Res. Commun. 23 633–640 [DOI] [PubMed] [Google Scholar]
Associated Data
This section collects any data citations, data availability statements, or supplementary materials included in this article.