Abstract
The influence of vocal fold geometry and stiffness on phonation onset was experimentally investigated using a body-cover physical model of the vocal folds. Results showed that a lower phonation threshold pressure and phonation onset frequency can be achieved by reducing body-layer or cover-layer stiffness, reducing medial surface thickness, or increasing cover-layer depth. Increasing body-layer stiffness also restricted vocal fold motion to the cover layer and reduced prephonatory glottal opening. Excitation of anterior–posterior modes was also observed, particularly for large values of the body-cover stiffness ratio. The results of this study were also discussed in relation to previous theoretical and experimental studies.
INTRODUCTION
Voice production results from a complex fluid–structure interaction within the glottis, by which self-sustained vibration is induced in the vocal folds. The strength of this glottal fluid–structure interaction is often characterized by the phonation threshold pressure, which is defined as the minimum lung pressure that initiates self-sustained vocal fold vibration (Titze, 1988). A better understanding of the dependence of the phonation threshold pressure on the geometrical and mechanical properties of the vocal folds would provide useful insights into how variations in vocal fold properties affect the fluid–structure interaction within the glottis. Clinically, such insight may help surgeons to better plan and evaluate possible treatment options for voice disorders.
Ideally, investigation of the dependence of phonation threshold pressure on vocal fold biomechanics should be conducted either in human subjects or using realistic larynx models in which the physiology and physics of voice production are properly reproduced. However, due to difficulties in the measurement and control of vocal fold properties (both geometry and stiffness) in human subjects (Solomon et al., 2007), systematic investigation of the influence of individual vocal fold properties on phonation onset in such studies is difficult, and many of such studies (Verdolini-Marston et al., 1990; Verdolini et al., 1994; Titze, 1992; Solomon et al., 2007) thus focused on the relationship between phonation threshold pressure and phonation onset frequency. Similarly, although in vivo and ex vivo larynx models have been widely used in phonation research (Moore et al., 1987; Sercarz et al., 1992; Döllinger and Berry, 2006; Döllinger et al., 2005) and have provided valuable insights into phonatory physics, these studies generally focused on other aspects of phonation, and phonation threshold pressure was often not measured.
Theoretically, the first investigation of phonation threshold pressure was conducted by Ishizaka (1981, 1988), in which the phonation threshold pressure and onset frequency were solved numerically in the two-mass model. The dependence of phonation threshold pressure on control parameters of the two-mass model (e.g., individual mass and stiffness) was subsequently investigated in later studies (e.g., Lucero, 1993; Steinecke and Herzel, 1995; Lucero and Koenig, 2005). However, as pointed out by Titze (1988), translation of findings from lumped-mass models to practical applications is difficult due to a lack of direct correspondence between model parameters and realistic vocal fold geometry and mechanical properties.
A first attempt to relate phonation threshold to directly measurable vocal fold properties was made in Titze (1988). In a surface wave model of the vocal folds, Titze (1988) showed that phonation threshold pressure increased with increasing vocal fold damping, increasing surface wave speed, increasing glottal opening, decreasing prephonatory glottal divergence angle (less divergent or more convergent), and decreasing medial surface thickness along the flow direction. Lucero and Koenig (2007) recently extended this model to include an explicit relationship between phonation threshold pressure and onset frequency. Later experiments by Titze and his colleagues (Titze et al., 1995; Chan et al., 1997) confirmed the positive dependence of the phonation threshold pressure on vocal fold damping and the negative dependence on the medial surface thickness. These experiments also showed that, in contrast to the predicted monotonic dependence on glottal opening and glottal divergence angle, an optimal value exists for both glottal divergence angle and glottal opening at which the phonation threshold pressure was minimal. Later analysis by Lucero (1996, 1998) showed that the existence of optimal prephonatory glottal opening and glottal divergence angle can be properly predicted when viscous flow dissipation and flow separation within a divergent glottis were taken into consideration in the surface wave model.
However, the surface wave model did not attempt to relate phonation threshold to either vocal fold stiffness or inner-layer vocal fold geometry. Instead, the influence of vocal fold stiffness and inner-layer vocal fold geometry was lumped into the mucosal wave speed, which was used as a control parameter in the surface wave model. Because the mucosal wave speed strongly depends on vocal fold geometry, stiffness, and boundary conditions (Boessenecker et al., 2007; Zhang, 2009), an explicit relationship between phonation threshold pressure and vocal fold geometry and stiffness is thus still missing. As the physical model used in Titze et al. (1995) and Chan et al. (1997) was essentially a cover-only model of the vocal folds, the influence of body-layer geometry and stiffness on phonation onset was therefore not experimentally investigated, either.
Recently, phonation onset mechanisms were investigated in a continuum model of the vocal folds using a linear stability analysis (Zhang et al., 2007), which showed that phonation onset results from a mode-coupling effect of the glottal flow which synchronizes two vocal fold eigenmodes to the same frequency. Zhang (2010) further showed that phonation threshold pressure depended on the frequency spacing and the coupling strengths between the two synchronizing eigenmodes. As both vocal fold eigenmodes and their coupling strength are highly dependent on vocal fold geometry and stiffness, these studies indicate a complex relationship between phonation threshold pressure and the underlying geometrical and material properties of the vocal folds. Furthermore, this series of theoretical studies have provided some new insight into the physics of phonation onset. For example, in a two-dimensional one-layer continuum model of the vocal folds, Zhang (2008) was able to predict the optimal glottal divergence angle reported in Chan et al. (1997) and showed that such optimal glottal divergence angle existed even when the flow separation was fixed to the superior edge of the medial surface. In a body-cover vocal fold model, Zhang (2009) showed that an increase in both the body- and cover-layer stiffnesses led to an increase in phonation threshold pressure and phonation onset frequency. Zhang (2010) further showed that an increase in the medial surface thickness reduced the coupling strength and therefore led to increased phonation threshold pressure, which contrasts with the experimental observation in Chan et al. (1997). These recent theoretical results thus point to the need for further and systematical experimental investigation of the influence of vocal fold geometry and stiffness on phonation threshold characteristics.
In this study, the influence of individual vocal fold properties on phonation threshold pressure and onset frequency was experimentally investigated by systematically varying vocal fold properties (both geometry and stiffness) one at a time. Although one of the goals was to experimentally validate the previous theoretical predictions of Zhang (2009, 2010), the data thus collected can be used in future studies for validation of currently existing or future theoretical phonation models. As changes in one vocal fold property often lead to concomitant alteration in other vocal fold properties in in vivo or ex vivo larynx models (e.g., laryngeal muscle activation often changes both vocal fold stiffness and geometry), physical models with well-controlled geometrical and mechanical properties were used in this study. Such control over geometry and stiffness allowed us to vary vocal fold properties one at a time, which was critical to the success of this study. In contrast to the cover-only physical model used by Titze and colleagues (Titze et al., 1995; Chan et al., 1997,), a two-layer physical model of the vocal folds was used in this study, which provided a better reproduction of the physiological structure of the vocal folds (Hirano, 1974) and allowed the influence of body-layer vocal fold properties to be investigated. Although similar vocal fold models were used in previous studies (Drechsel and Thomson, 2008; Pickup and Thomson, 2009), these studies focused on other aspects of phonation, and the dependence of phonation threshold pressure and onset frequency on vocal fold properties was not systematically investigated.
EXPERIMENTAL SETUP
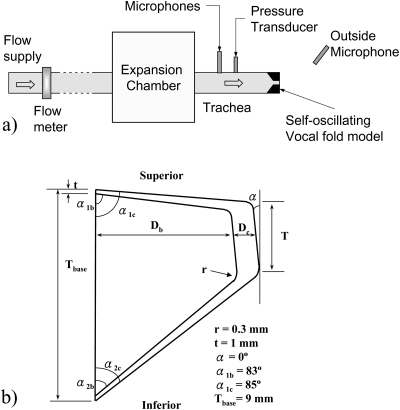
The experimental setup is similar to that used in previous studies (Zhang et al., 2006, 2009). More details of the setup can be found in these previous studies. As shown in Fig. 1a, the setup consisted of an expansion chamber (with a rectangular cross section of the dimension 23.5 × 25.4 cm and 50.8 cm long) simulating the lungs, an 11.7-cm-long straight circular PVC tube (inner diameter of 2.54 cm) simulating the tracheal tube, and a self-oscillating model of the vocal folds. The expansion chamber was connected upstream to a pressurized airflow supply through a 15.2-m-long rubber hose. No vocal tract was used in this study in order to avoid possible source–tract interaction.
Figure 1.
Sketch of (a) the experimental setup and (b) the coronal cross-sectional geometry of the two-layer physical model.
The vocal fold models were made by mixing a two-component liquid polymer solution (Ecoflex 0030, Smooth On, Inc.) with a silicone thinner solution, similar to previous studies (Thomson et al., 2005; Zhang et al., 2006,). In this study, a ratio of 1:1 was used for the two components of the liquid polymer solution and the silicone thinner solution ratio was varied depending on the desired model stiffness. The Young’s modulus of the cured silicone compound was measured using the indentation method with an indenter diameter of 1 mm and an indentation depth of 1 mm (Chhetri et al., 2011 ). Note that varying composition ratio of the polymer solution may also change the viscosity of the resulting vocal fold model, which was not measured in this study. The two-layer structure of the vocal fold model was achieved by first constructing the body layer and, after the body layer was completely cured (generally after 1 day), adding the compound solution for the cover layer on top of the cured body layer. The two layers generally bonded so well that they never came apart during vibration.
For simplicity, the physical models had a uniform cross-sectional geometry along the anterior–posterior direction. The cross-sectional geometry was defined in the same way as that used in Zhang (2009, 2010) [Fig. 1b]. Although more geometrical variations were possible, only variations in medial surface thickness T and body-cover depth ratio Dc/Db (with a constant overall vocal fold depth) were considered in this study. The medial surface thickness has been shown to be an important factor affecting phonation threshold pressure (Titze, 1988; Zhang, 2010). For vocal fold models of large contrast in body-cover stiffness, variations in body-cover depth ratio are expected to significantly affect the effective depth of vibration, which was shown to be an important factor in the determination of phonation frequency (Titze et al., 1988). In this study, six vocal fold geometries with unique combinations of the medial surface thickness and body-cover depth ratio (Table TABLE I.) were designed and used. In addition to variations in these two geometric parameters, the body-layer stiffness and cover-layer stiffness were independently varied for all six geometries.
Table 1.
Geometrical parameters of the six two-layer vocal fold models.
| Geometry | Medial surface thickness T (mm) | Body-layer depth Db (mm) | Cover-layer depth Dc (mm) |
|---|---|---|---|
| G1 | 3 | 6 | 1.5 |
| G2 | 4.5 | 6 | 1.5 |
| G3 | 3 | 5 | 2.5 |
| G4 | 2 | 6 | 1.5 |
| G5 | 2 | 5 | 2.5 |
| G6 | 2 | 4 | 3.5 |
Phonation threshold pressure and onset frequency were measured for each vocal fold model using a flow-ramp experimental procedure, i.e., the flow rate was increased in discrete increments from zero to a value above onset (or a very high flow rate if no vibration was observed). At each step, after a delay of about 2–3 s after the flow rate change, the mean subglottal pressure, the mean flow rate, and the acoustic pressure inside the tracheal tube (2 cm from the entrance of the glottis) and outside were measured for a 1 s period. The sound pressure in the tracheal tube was measured using a probe microphone (B&K 4182, Denmark), which was mounted flush with the inner wall of the tracheal tube, 2 cm upstream from the vocal fold plates. The time-averaged subglottal pressure was measured at 2 cm upstream from the glottal entrance using a pressure transducer (Baratron type 220D, MKS Instruments, Inc., Andover, MA). The volumetric flow rate through the orifice was measured using a precision mass-flow meter (MKS type 558A, MKS Instruments, Inc., Andover, MA) at the inlet of the setup. This procedure was repeated for each vocal fold model. For some models, a superior view of the vibrating vocal folds was recorded using a high-speed digital camera (Fastcam-Ultima APX, Photron USA) at a frame rate of 2 000 fps and an image resolution of 1024 × 1024 pixels.
RESULTS
Effects of body-layer stiffness
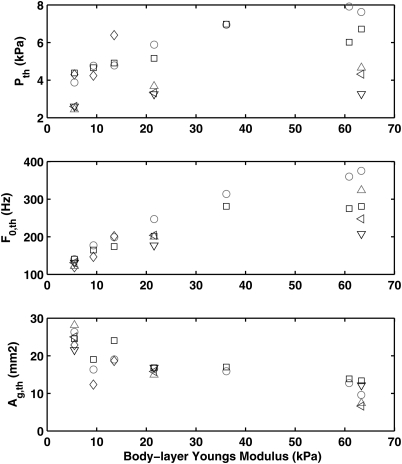
Figure 2 shows the phonation threshold pressure, Pth, and onset frequency F0,th, as a function of the body-layer Young’s modulus. For all conditions shown in Fig. 2, the cover-layer Young’s modulus was kept approximately constant around 5.51 kPa by using the same composition ratio for the three-component polymer solution. Figure 2 shows that both the phonation threshold pressure and onset frequency generally increased with increasing body-layer stiffness. This is consistent with the prediction of Zhang (2009). Comparison among different geometries showed that the amount of increase in phonation threshold pressure and frequency with increasing body-layer stiffness was the largest for G1, and became smaller with increasing cover-layer depth (compare G1 to G3, G4 to G5 and G6). Note that, for geometry G2, phonation onset was not observed for body-layer Young’s modulus above 14 kPa in the flow range investigated. The difference in phonation threshold due to geometrical variations is further discussed in Secs. III C and III D.
Figure 2.
(Color online) The phonation threshold pressure Pth (a), onset frequency F0,th (b), and estimated prephonatory glottal opening area Ag,th (c) as a function of the body-layer Young’s modulus. The cover layer stiffness was kept constant at 5.51 kPa. ○: G1; ◊: G2; □: G3; Δ: G4; ⊲: G5; ∇:G6. Values were shown only for cases in which self-oscillation was observed. Note that no self-oscillation was observed for geometry G2 at large values of the body-layer Young’s modulus (above around 14 kPa).
Figure 2c shows the estimated prephonatory glottal opening area as a function of the body-layer stiffness. For a given phonation threshold subglottal pressure Pth and a threshold flow rate at onset Qth, the prephonatory glottal opening area was estimated as
| (1) |
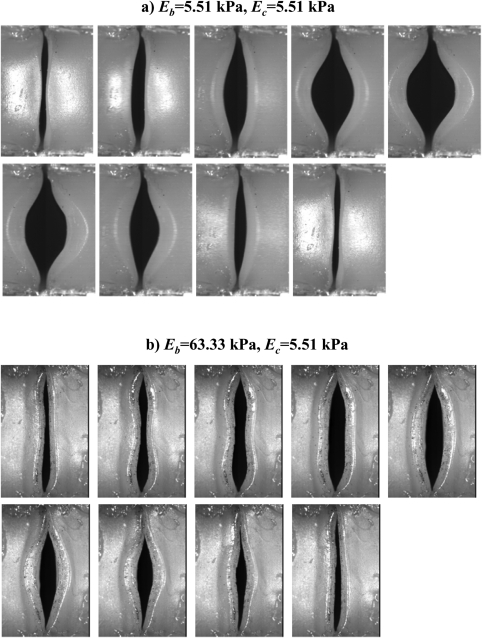
where ρ is air density. Figure 2c shows that the prephonatory glottal opening area generally decreased with increasing body-layer Young’s modulus. This suggests that a stiff-body layer is able to provide better mechanical support to the vocal fold against airflow and help maintain small glottal opening. This was further confirmed by Fig. 3, which contrasts the vocal fold vibration pattern of a soft body to that of a stiff body. Both recordings were taken at a subglottal pressure slightly above onset. The maximum glottal opening in the stiff body [Fig. 3b] was about half of that in the soft-body model [Fig. 3a]. Figure 3 also clearly showed that increasing body-layer stiffness restricted the vocal fold motion to the cover layer, consistent with the prediction of Zhang (2009). The vertical (inferior–superior) motion of the vocal fold body was much reduced in the stiff-body model [Fig. 3b] compared to the soft-body model [Fig. 3a], particularly in the body-layer (or lateral) region of the superior surface. Due to this reduced vertical motion, the glottal opening in the stiff-body model was much smaller than that in the soft-body model, although the vibration was recorded at a higher subglottal pressure for the stiff-body model than for the soft-body model (due to the higher phonation threshold pressure associated with the stiff-body model).
Figure 3.
Superior view of a soft-body (a) and a stiff-body (b) vocal fold model during a typical oscillating cycle.
Another important feature to note in Fig. 3 is that, for the stiff-body model, an anterior–posterior eigenmode of the vocal fold was excited [e.g., the second and third pictures in Fig. 3b]. In this study, the anterior–posterior modes were generally more strongly excited in stiff-body models and less excited in soft-body models.
Effects of cover-layer stiffness
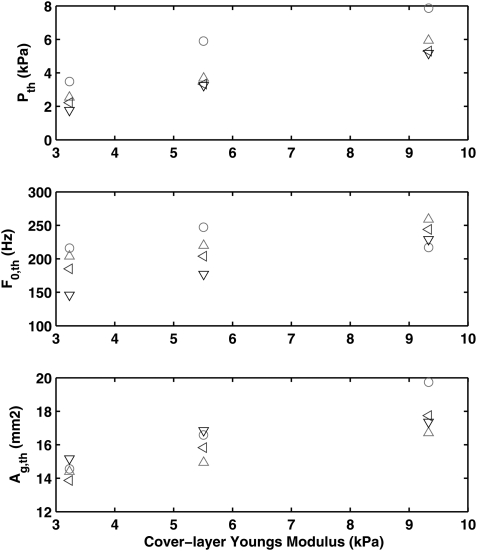
Figure 4 shows the phonation threshold pressure, onset frequency, and estimated prephonatory glottal opening area as a function of the cover-layer Young’s modulus, for geometries G1, G4, G5, and G6. For all conditions, the body-layer Young’s modulus remained the same around 21.56 kPa. Figure 4 shows that, for all geometries, phonation threshold pressure increased with increasing cover-layer stiffness.
Figure 4.
(Color online) The phonation threshold pressure Pth (a), onset frequency F0,th (b), and estimated prephonatory glottal opening area Ag,th (c) as a function of the cover-layer Young’s modulus. The body-layer stiffness was kept constant at 21.56 kPa. ○: G1; Δ: G4; ⊲: G5; ∇: G6.
Except for geometry G1, increasing cover-layer stiffness also increased the phonation onset frequency. The increase in phonation onset frequency was the largest for geometry G6, and became less significant with decreasing cover-layer depth. For geometry G1, the phonation onset frequency first increased but then decreased with increasing cover-layer stiffness. Note that G1 was the geometry with the minimum cover-layer depth. The exact mechanisms behind this decrease in phonation onset frequency are not clear.
Increasing cover-layer Young’s modulus also led to increased prephonatory glottal opening area [Fig. 4c], probably due to the increased phonation threshold pressure. This is in contrast to the case of increasing body-layer stiffness, which reduced glottal opening [Fig. 2c].
Effects of medial surface thickness
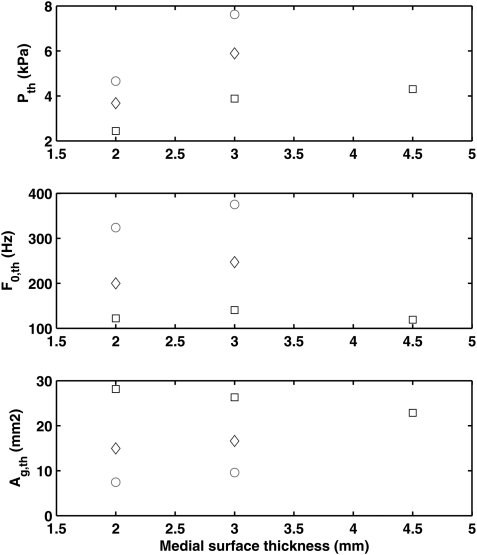
Figure 5 shows the effects of varying medial surface thickness on phonation threshold pressure, onset frequency, and estimated prephonatory glottal opening area. Note that variations in medial surface thickness were achieved by adjusting the entrance angles of the vocal folds (α2b and α2c) accordingly. Three values of the medial surface thickness (2, 3, and 4.5 mm) were used. For each medial surface thickness, three vocal fold models with three different values of the body-layer Young’s modulus were used while the cover-layer Young’s modulus remained constant at 5.51 kPa.
Figure 5.
(Color online) The phonation threshold pressure Pth (a), onset frequency F0,th (b), and estimated prephonatory glottal opening area Ag,th (c) as a function of the medial surface thickness T. ○: Eb = 63.33 kPa; ◊: Eb = 21.56 kPa; □: Eb = 5.51 kPa. The cover layer stiffness Ec = 5.51 kPa for all cases shown.
For all three body-layer Young’s moduli, increasing medial surface thickness led to increased phonation threshold pressure and onset frequency. For G2 with the largest value of medial surface thickness (4.5 mm), phonation was not even observed in the flow range investigated, except for the model with the lowest body-layer Young’s modulus. The increase in phonation threshold (both pressure and frequency) with increasing medial surface thickness became more significant with increasing body-layer Young’s modulus.
Figure 5c shows that the prephonatory glottal area decreased with increasing medial surface thickness for the case of Eb = 5.51 kPa [squares in Fig. 5c], but increased for the other two cases shown. However, the positive relation between the phonation threshold pressure and the medial surface thickness was observed for all three cases. This indicates that the prephonatory glottal area was at least not the primary factor underlying this positive relation between the phonation threshold pressure and the medial surface thickness.
Effects of body-cover depth ratio
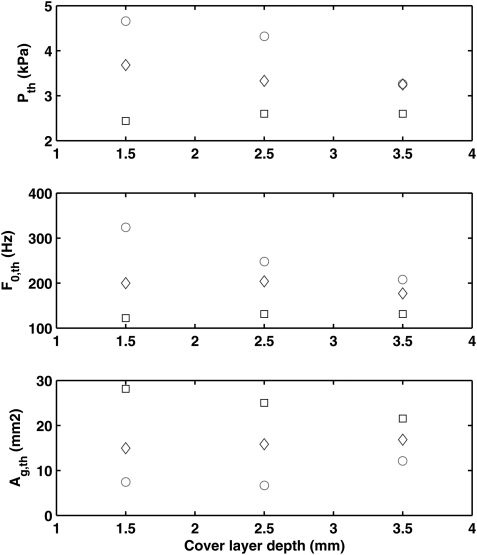
Figure 6 shows the phonation onset characteristics as a function of cover-layer depth. Note that, in this study, increasing cover-layer depth was accompanied by a decreasing body-layer depth so that the overall depth remained constant (Table TABLE I.). Figure 6 shows that both phonation threshold pressure and onset frequency decreased with increasing cover-layer depth, and this effect became more prominent with increasing contrast in body-cover stiffness. When the body and cover layers had similar Young’s moduli (squares in Fig. 6), the effect of varying body-cover depth ratio was minimal, as expected.
Figure 6.
(Color online) The phonation threshold pressure Pth (a), onset frequency F0,th (b), and estimated prephonatory glottal opening area Ag,th (c) as a function of the cover layer depth Dc. ○: Eb = 63.33 kPa; ◊: Eb = 21.56 kPa; □: Eb=5.51 kPa. The cover layer stiffness Ec = 5.51 kPa for all cases shown.
COMPARISON TO SIMULATIONS
Although an original motivation of this study was to validate the predictions of the linear stability model of Zhang (2009), it was soon realized that such direct and quantitative comparison was difficult. The study of Zhang (2009) considered a two-dimensional plane-strain structural model for the vocal folds, which corresponded to the extreme case of an infinitely long three-dimensional model. This contrasts with the finite-length three-dimensional physical models that were constrained at the anterior and posterior end surfaces. A direct consequence of this boundary constraint is that the three-dimensional models generally have higher in vacuo eigenfrequencies than the corresponding plane-strain two-dimensional models (Cook et al., 2008). Our initial attempt was to scale the two-dimensional plane-strain models so that the in vacuo eigenfrequencies matched those of the three-dimensional models. However, comparison of the eigenfrequencies between the two-dimensional plane-strain and three-dimensional models indicates that different scaling factors are required to match different eigenmodes. These scaling factors also vary with vocal fold geometry and stiffness conditions. This scaling approach was considered difficult to implement in practical applications and thus was not further pursued.
Another major difference results directly from the two-dimensional nature of the Zhang (2009) model, in which the anterior–posterior eigenmodes were excluded by design. However, such anterior–posterior modes were clearly observed in this study (Fig. 3). It is likely that the presence of the anterior–posterior modes would affect the interaction between non-anterior–posterior modes and the resulting phonation threshold pressure. Such interactions cannot be properly included in the two-dimensional models.
Due to these difficulties, detailed comparison between experiment and the prediction from the two-dimensional plane-strain models is not presented in this paper. It is anticipated that such comparison will be made in future studies when the two-dimensional model of Zhang (2009, 2010) is extended to include three-dimensional effects.
SUMMARY AND DISCUSSION
Using a two-layer isotropic physical vocal fold model, this study showed that a lower phonation threshold pressure can be achieved by reducing either body-layer or cover-layer stiffness, which is consistent with the prediction of Zhang (2009). Increasing body-cover stiffness ratio also gradually restricted vocal fold motion to the cover layer, consistent with Zhang (2009). The results also showed that vocal fold geometry had significant influence on phonation threshold. Specifically, a lower phonation threshold pressure can also be achieved by reducing medial surface thickness or increasing the cover-layer depth. These observations are consistent with the predictions of Zhang (2010). Zhang (2010) showed that phonation threshold pressure depended on the frequency spacing and coupling strength [refer to Zhang (2010) for a mathematical definition] between the two synchronizing eigenmodes, and increasing medial surface thickness reduces the coupling strength between the two synchronizing eigenmodes and thus increases phonation threshold pressure. On the other hand, increasing cover-layer depths is expected to reduce overall vocal fold stiffness and the frequency spacing, thereby reducing phonation threshold pressure.
It may seem that the positive relation between medial surface thickness and phonation threshold pressure observed in this study contradicts the experimental observation of Chan et al. (1997). However, as pointed out in Zhang (2010), this seeming contradiction is “likely due to the multivariable dependence of phonation threshold.” Depending on the values of other vocal fold properties (geometry, body-cover stiffness ratio, etc.), varying the medial surface thickness may have different or even opposite influence on phonation threshold pressure. The physical model used in Chan et al. (1997) was a cover-only model, which was quite different from the two-layer model used in this study. It is possible that an increase in the medial surface thickness of their physical model actually enhances the coupling strength and thus increases phonation threshold pressure. Validation of this hypothesis requires conducting simulations using the exact vocal fold geometry and stiffness conditions as used in the experiments of Chan et al. (1997). This work is currently under way and will be reported in a future study.
Regarding the contradiction between the results of this study and the prediction of Titze (1988), which showed the medial surface thickness was inversely related to phonation threshold pressure, we note that the mucosal wave speed in Titze’s (1988) wave model is not an independent variable and varies with both vocal fold geometry (including medial surface thickness) and stiffness (Boessenecker et al., 2007; Zhang, 2009). It is possible that an increase in medial surface thickness may significantly increase the mucosal wave speed so that the overall effect is to increase the phonation threshold pressure. Therefore, in this sense, the positive correlation between medial surface thickness and phonation threshold pressure observed in this study was not in direct contradiction with the prediction of Titze (1988).
It is also important to note the differences between the physical models used in this study and realistic human vocal folds. One difference is the idealized geometry of the physical models as compared to human vocal folds. In particular, the physical model has a uniform cross-sectional geometry along the anterior–posterior direction, whereas human vocal folds exhibit large variation in both geometry and stiffness along this direction (Hirano and Kakita, 1985). Another important difference is that each of the two layers of the physical model of this study was isotropic, whereas both layers in humans are generally considered anisotropic or at least only transversely isotropic (Hirano and Kakita, 1985), with much higher stiffness in the anterior–posterior direction. The influence of the realistic and anisotropic material properties of the vocal folds and their variations on phonation threshold will be further explored in future studies.
ACKNOWLEDGMENTS
This study was supported by Research Grant Nos. R01 DC009229 and R01 DC 011299 from the National Institute on Deafness and Other Communication Disorders, National Institutes of Health.
References
- Boessenecker, A., Berry, D. A., Lohscheller, J., Eysholdt, U., and Döllinger, M. (2007). “Mucosal wave properties of a human vocal fold,” Acta Acust. Acust. 93, 815–823. [Google Scholar]
- Chan, R., Titze, I. R., and Titze, M. (1997). “Further studies of phonation threshold pressure in a physical model of the vocal fold mucosa,” J. Acoust. Soc. Am. 101, 3722–3727. 10.1121/1.418331 [DOI] [PubMed] [Google Scholar]
- Chhetri, D. K., Zhang, Z., and Neubauer, J. (2011). “Measurement of Young’s modulus of vocal fold by indentation,” J. Voice 25, 1–7. 10.1016/j.jvoice.2009.09.005 [DOI] [PMC free article] [PubMed] [Google Scholar]
- Cook, D., Nauman, E., and Mongeau, L. (2008). “Reducing the number of vocal fold mechanical tissue properties: Evaluation of the incompressibility and planar displacement assumptions,” J. Acoust. Soc. Am. 124, 3888–3896. 10.1121/1.2996300 [DOI] [PMC free article] [PubMed] [Google Scholar]
- Döllinger, M., and Berry, D. A. (2006). “Computation of the three-dimensional medial surface dynamics of the vocal folds,” J. Biomech. 39, 369–374. 10.1016/j.jbiomech.2004.11.026 [DOI] [PubMed] [Google Scholar]
- Döllinger, M., Berry, D. A., and Berke, G. S. (2005). “Medial surface dynamics of an in vivo canine vocal fold during phonation,” J. Acoust. Soc. Am. 117, 3174–3183. 10.1121/1.1871772 [DOI] [PubMed] [Google Scholar]
- Drechsel, J. S., and Thomson, S. L. (2008). “Influence of supraglottal structures on the glottal jet exiting a two-layer synthetic, self-oscillating vocal fold model,” J. Acoust. Soc. Am. 123, 4434–4445. 10.1121/1.2897040 [DOI] [PMC free article] [PubMed] [Google Scholar]
- Hirano, M. (1974). “Morphological structure of the vocal cord as a vibrator and its variations,” Folia Phoniatr. (Basel) 26, 89–94. 10.1159/000263771 [DOI] [PubMed] [Google Scholar]
- Hirano, M., and Kakita, Y. (1985). “Cover-body theory of vocal fold vibration,” in Speech Science: Recent Advances, edited by Daniloff R. G. (College-Hill Press, San Diego: ), pp. 1–46. [Google Scholar]
- Ishizaka, K. (1981). “Equivalent lumped-mass models of vocal fold vibration,” in Vocal Fold Physiology, edited by Stevens K. N. and Hirano M. (University of Tokyo, Tokyo: ), pp. 231–244. [Google Scholar]
- Ishizaka, K. (1988). “Significance of Kaneko’s measurement of natural frequencies of the vocal folds,” in Vocal Physiology: Voice Production, Mechanisms and Functions, edited by Fujimara Osamu (Raven, New York: ), pp. 181–190. [Google Scholar]
- Lucero, J. C. (1993). “Dynamics of the two-mass model of the vocal folds: Equilibria, bifurcations, and oscillation region,” J. Acoust. Soc. Am. 94, 3104–3111. 10.1121/1.407216 [DOI] [Google Scholar]
- Lucero, J. C. (1996). “Relation between the phonation threshold pressure and the prephonatory glottal width in a rectangular glottis,” J. Acoust. Soc. Am. 100, 2551–2554. 10.1121/1.417365 [DOI] [PubMed] [Google Scholar]
- Lucero, J. C. (1998). “Optimal glottal configuration for ease of phonation,” J. Voice 12, 151–158. 10.1016/S0892-1997(98)80034-9 [DOI] [PubMed] [Google Scholar]
- Lucero, J. C., and Koenig, L. L. (2005). “Phonation thresholds as a function of laryngeal size in a two-mass model of the vocal folds (L),” J. Acoust. Soc. Am. 118, 2798–2801. 10.1121/1.2074987 [DOI] [PubMed] [Google Scholar]
- Lucero, J. C., and Koenig, L. L. (2007). “On the relation between the phonation threshold lung pressure and the oscillation frequency of the vocal folds,” J. Acoust. Soc. Am. 121, 3280–3283. 10.1121/1.2722210 [DOI] [PubMed] [Google Scholar]
- Moore, D. M., Berke, G. S., Hanson, D. G., and Ward, P. H. (1987). “Videostroboscopy of the canine larynx: The effects of asymmetric laryngeal tension,” Laryngoscope 97, 543–553. [DOI] [PubMed] [Google Scholar]
- Pickup, B. A., and Thomson, S. L. (2009). “Influence of asymmetric stiffness on the structural and aerodynamic response of synthetic vocal fold models,” J. Biomech. 42, 2219–2225. 10.1016/j.jbiomech.2009.06.039 [DOI] [PMC free article] [PubMed] [Google Scholar]
- Sercarz, J. A., Berke, G. S., Ming, Y., Gerratt, B. R., and Natividad, M. (1992). “Videostroboscopy of human vocal fold paralysis,” Ann. Otol. Rhinol. Laryngol. 101, 567–577. [DOI] [PubMed] [Google Scholar]
- Solomon, N. P., Ramanathan, P., and Makashay, M. J. (2007). “Phonation threshold pressure across the pitch range: Preliminary test of a model,” J. Voice 21, 541–550. 10.1016/j.jvoice.2006.04.002 [DOI] [PubMed] [Google Scholar]
- Steinecke, I., and Herzel, H. (1995). “Bifurcations in an asymmetric vocal fold model,” J. Acoust. Soc. Am. 97, 1874–1884. 10.1121/1.412061 [DOI] [PubMed] [Google Scholar]
- Thomson, S. L., Mongeau, L., and Frankel, S. H. (2005). “Aerodynamic transfer of energy to the vocal folds,” J. Acoust. Soc. Am. 118, 1689–1700. 10.1121/1.2000787 [DOI] [PubMed] [Google Scholar]
- Titze, I. R. (1988). “The physics of small-amplitude oscillation of the vocal folds,” J. Acoust. Soc. Am. 83, 1536–1552. 10.1121/1.395910 [DOI] [PubMed] [Google Scholar]
- Titze, I. R. (1992). “Phonation threshold pressure: A missing link in glottal aerodynamics,” J. Acoust. Soc. Am. 91, 2926–2935. 10.1121/1.402928 [DOI] [PubMed] [Google Scholar]
- Titze, I. R., Jiang, J., and Drucker, D. G. (1988). “Preliminaries to the body-cover theory of pitch control,” J. Voice 1, 314–319. 10.1016/S0892-1997(88)80004-3 [DOI] [Google Scholar]
- Titze, I. R., Schmidt, S., and Titze, M. (1995). “Phonation threshold pressure in a physical model of the vocal fold mucosa,” J. Acoust. Soc. Am. 97, 3080–3084. 10.1121/1.411870 [DOI] [PubMed] [Google Scholar]
- Verdolini, K., Titze, I., and Fennell A. (1994). “Dependence of phonatory effort on hydration level,” J. Speech Hear. Res. 37, 1001–1007. [DOI] [PubMed] [Google Scholar]
- Verdolini-Marston, K., Titze, I. R., and Druker, D. G. (1990). “Changes in phonation threshold pressure with induced conditions of hydration,” J Voice 4, 142–151. 10.1016/S0892-1997(05)80139-0 [DOI] [Google Scholar]
- Zhang, Z. (2008). “Influence of flow separation location on phonation onset,” J. Acoust. Soc. Am. 124, 1689–1694. 10.1121/1.2957938 [DOI] [PMC free article] [PubMed] [Google Scholar]
- Zhang, Z. (2009). “Characteristics of phonation onset in a two-layer vocal fold model,” J. Acoust. Soc. Am. 125, 1091–1102. 10.1121/1.3050285 [DOI] [PMC free article] [PubMed] [Google Scholar]
- Zhang, Z. (2010). “Dependence of phonation threshold pressure and frequency on vocal fold geometry and biomechanics,” J. Acoust. Soc. Am. 127, 2554–2562. 10.1121/1.3308410 [DOI] [PMC free article] [PubMed] [Google Scholar]
- Zhang, Z., Neubauer, J., and Berry, D. A. (2006). “The influence of subglottal acoustics on laboratory models of phonation,” J. Acoust. Soc. Am. 120, 1558–1569. 10.1121/1.2225682 [DOI] [PubMed] [Google Scholar]
- Zhang, Z., Neubauer, J., and Berry, D. A. (2007). “Physical mechanisms of phonation onset: A linear stability analysis of an aeroelastic continuum model of phonation,” J. Acoust. Soc. Am. 122, 2279–2295. 10.1121/1.2773949 [DOI] [PubMed] [Google Scholar]
- Zhang, Z., Neubauer, J., and Berry, D. A. (2009).“Influence of vocal fold stiffness and acoustic loading on flow-induced vibration of a single-layer vocal fold model,” J. Sound Vib. 322, 299–313. 10.1016/j.jsv.2008.11.009 [DOI] [PMC free article] [PubMed] [Google Scholar]


