Abstract
Two novel ternary nanocatalysts, f-MWCNTs-CdS and f-MWCNTs-Ag2S were successfully constructed by covalent grafting of fourth generation (G4) hyperbranched, crosslinked poly(amidoamine) (PAMAM) to carboxylated multi-walled carbon nanotubes (MWCNTs-COOH) and subsequent deposition of CdS or Ag2S quantum dots (QDs). The structural transformation, surface potential, and morphology of functionalized MWCNTs (f-MWCNTs) and nanocatalysts were characterized by UV-vis spectrophotometer, Fourier transform infrared spectroscopy, powder X-ray diffraction, Raman spectroscopy, thermogravimetric analysis, scanning electron microscopy and energy dispersive spectroscopy. Transmission electron microscopy reveals the effective anchoring of QDs on f-MWCNTs. The catalytic activity of nanocatalysts was evaluated by photodegradation of methyl orange under illumination of UV light. The coupling of MWCNTs, PAMAM and CdS or Ag2S QDs significantly enhanced the catalytic efficiency of nanocatalysts. The rate constants for degradation of methyl orange in presence of nanocatalysts were calculated using the Langmuir-Hinshelwood model. Overall, the excellence in photodegradation was accomplished by hybridizing f-MWCNTs with CdS or Ag2S
Keywords: Carbon nanotubes, Cadmium sulfide, Silver sulfide, Poly(amidoamine), Photocatalyst
1. Introduction
Since their discovery, carbon nanotubes (CNTs) have attracted considerable attention owing to their superlative mechanical, thermal and electronic properties [1]. The large surface area, high chemical stability and good electrical conductivity of CNTs rendered them as excellent supports or carriers for catalysts [2–4]. The presence of extended, delocalized π-electron systems makes these CNTs very useful for managing charge transfer and charge transport, when combined with photoexcited electron donors, such as organic materials or inorganic nanoparticles [5]. To optimize the use of CNTs in catalytic application, it is often necessary to assemble nanostructures onto their surfaces. Hence the hybrid nanostructures of CNTs and semiconductor nanoparticles are expected to produce active photocatalysts by their excellent adsorption and charge transfer abilities [6–9]. Recently a great deal of effort has been devoted to improve the photocatalytic efficiency of semiconductors by combining with CNTs. [10–12].
Currently, dye containing wastewater generated by various sources has caused severe ecological problems due to their toxicity. Most of these dyes are resistant to biodegradation and direct photolysis, and many N-containing dyes such as methyl orange (MO) undergo natural reductive anaerobic degradation to yield potentially carcinogenic aromatic amines. Therefore removal of such toxic dyes from water has become most important issue in environmental science. For this purpose, photocatalysis is believed to be a promising technology, whereas rapid recombination of photo-carriers is the main obstruction of this process. This obstacle can overcome by utilization of semiconductor photocatalysts. Among the semiconductor photocatalysts, TiO2 is the most explored one, while the wide band gap energy (3.2 eV) has hindered its sufficient utilization of photo-energy. In view of this CdS and Ag2S with band gap energy of 2.42 and 1.0 eV, respectively are considered to be excellent photo-responsive catalysts [13–18]. However, CdS and Ag2S quantum dots (QDs) are known to form aggregation during synthesis, which results in the reduction of their photocatalytic efficiency. Use of CNTs as support to stabilize the QDs could avoid the formation of aggregation.
In this contribution, we described the effective immobilization of CdS and Ag2S QDs on poly(amidoamine) (PAMAM) grafted multi-walled carbon nanotubes (MWCNTs). The PAMAM macromolecules grown on MWCNTs were used as a platform for the deposition of CdS and Ag2S QDs. The functionalized MWCNTs (f-MWCNTs) and resultant nanocatalysts, f-MWCNTs-CdS and f-MWCNTs-Ag2S were characterized UV-vis spectrophotometer, Fourier transform infrared spectroscopy (FTIR), Raman spectroscopy, powder x-ray diffraction (XRD), scanning electron microscopy (SEM), transmission electron microscopy (TEM), x-ray energy dispersive spectroscopy (EDS) and thermogravimetric analysis (TGA). Both f-MWCNTs-CdS and f-MWCNTs-Ag2S nanocatalysts are stable and water dispersible. The photodegradation of methyl orange in presence of f-MWCNTs-CdS and f-MWCNTs-Ag2S nanocatalysts has been explored. To best of our knowledge, the photocatalytic activity of f-MWCNTs-CdS and f-MWCNTs-Ag2S nanocatalysts has not been reported.
2. Experimental
All the reagents were purchased from Sigma-Aldrich and used without further purification unless otherwise noted. All aqueous solutions were prepared with ultrapure water obtained from the Milli-Q Plus system (Millipore). Tetrahydrofuran (THF) was dried over sodium benzophenone under nitrogen and freshly distilled prior to use.
2.1. Construction of fourth generation (G4) hyperbranched, crosslinked PAMAM on MWCNTs
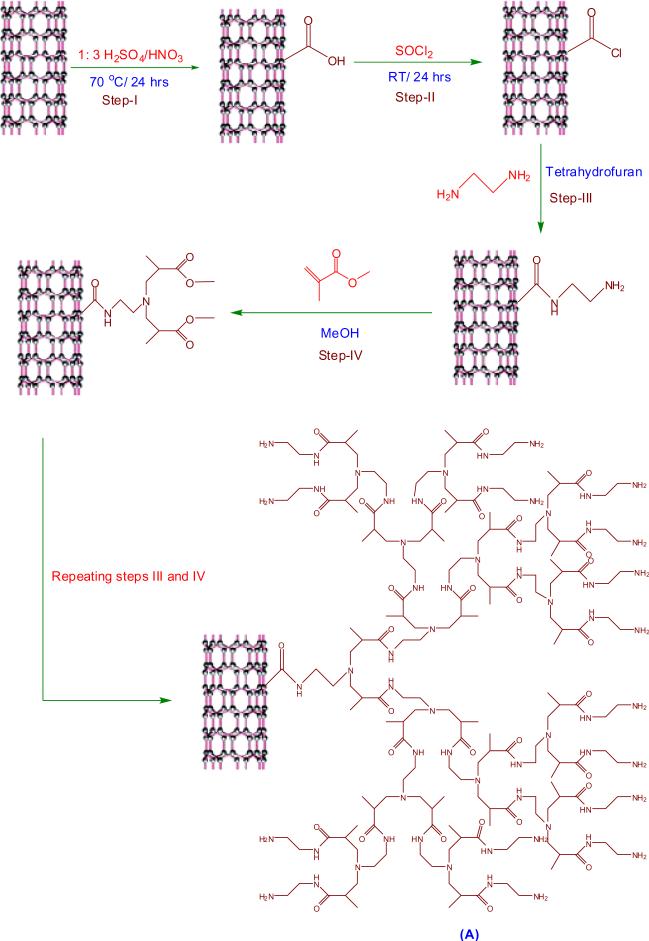
Pristine MWCNTs (p-MWCNTs) was refluxed under stirring at 70 °C in the mixture of 1:3 (v/v) HNO3 and H2SO4 for 24 h, which was followed by centrifugation and repeated washings with DI water [19,20]. The carboxylated MWCNTs (MWCNTs-COOH) thus obtained were dried under vacuum at 40 °C and reacted with excess of SOCl2 at room temperature for 24 h. The resulting acylated MWCNTs (MWCNTs-COCl) were separated by centrifugation, subsequently washed with anhydrous THF and dried in vacuum at 40 °C for 12 h. Then MWCNTs-COCl were dispersed in THF by sonication for 15 min and allowed to react with excess of ethylenediamine at 60 °C for 12 h. Then the functionalized MWCNTs with G4- hyperbranched, crosslinked PAMAM (f-MWCNTs) were obtained by repeating the Michael addition of methylmethacrylate to the surface amino groups and amidation of terminal ester groups with ethylenediamine. The estimated value of nitrogen (N) present in f-MWCNTs was found to be 6.42% (C= 76.05% and H= 2.51%). The overall procedure for grafting of PAMAM macromolecules onto MWCNTs is illustrated in Scheme 1.
Scheme 1.
Covalent grafting of PAMAM dendrimers onto MWCNTs.
2.2. Typical experiment
2.2.1. Preparation of f-MWCNTs-QDs nanocatalysts
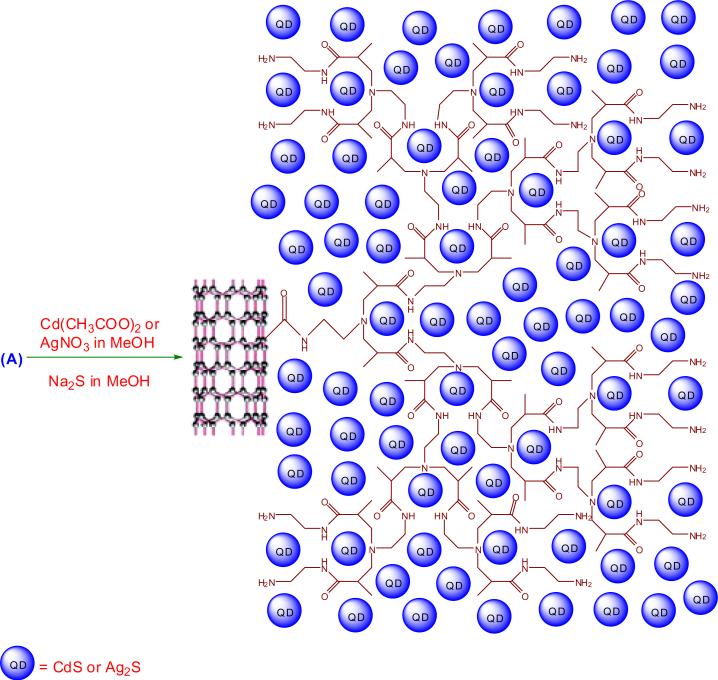
The PAMAM functionalized MWCNTs (f-MWCNTs) (20 mg) were dispersed in 20 mL methanol by sonicating for 10 min and a solution of metal salt (0.01 mol L−1 Cd(CH3COO)2 or 0.02 mol L−1 AgNO3) in 20 mL methanol was added. The resulting mixture was sonicated for additional 15 mins in order to drive the coordination reaction to complete. Then a freshly prepared solution of Na2S in methanol (20 mL, 0.01 mol L−1) was added drop wise to the mixture, followed by combination of vigorous stirring and sonication for 15 mins. The suspension thus formed was then stirred under ambient condition for 6 h. The resulting f-MWCNTs-CdS and f-MWCNTs-Ag2S nanocatalysts were centrifuged and subsequently washed with methanol and DI water. Then the nanocatalysts were dried in vacuum at 40 °C for 12 h. The deposition of QDs on f-MWCNTs is schematically depicted in Scheme 2.
Scheme 2.
Deposition of CdS and Ag2S QDs on f-MWCNTs.
2.3. Control experiments
For comparison, two control experiments were performed using MWCNTs-COOH and CdS and Ag2S QDs.
2.3.1. Preparation of CdS and Ag2S QDs
The CdS and Ag2S QDs were prepared according to similar procedure mentioned for preparation of f-MWCNTs-QDs nanocatalysts without f-MWCNTs.
2.4. Photocatalytic Activity
The photocatalytic activity of MWCNTs-COOH, QDs and f-MWCNTs-QDs nanocatalysts was evaluated by degradation efficiency of methyl orange (MO) under irradiation of ultraviolet (UV) light. The degradation was carried out in natural atmosphere, without any external source of aeration. In each experiment, 40 mg of catalyst was suspended in 80 ml aqueous solution of methyl orange (20 mg L−1). This suspension was then sonicated for 5 min and magnetically stirred in dark for 1 h in order to establish adsorption/desorption equilibrium of methyl orange molecules on the surface of catalyst. Then it was transferred to a double walled quartz photocatalytic reactor with water circulation facility to maintain the reaction mixture at room temperature. The suspension was then irradiated with a 450W medium pressure mercury lamp (Hanovia, PC 451050) under constant stirring. At a given interval of time, 5 ml of suspension was taken out, centrifuged and the concentration of MO was analyzed by measuring its absorbance at 464 nm using UV-vis spectrophotometer. The normalized concentration of MO after illuminating to UV light was calculated as C/C0, where C0 is the initial concentration of MO and C is the concentration of MO measured after illumination at a particular interval of time.
2.5. Characterization
The UV-vis absorption spectra were recorded on a Varian Carry 50 Bio UV-vis spectrophotometer and the FTIR spectra were obtained by Thermo-Nicolet IR 2000 spectrometer (KBr pellet). Thermogravimetric analyses were performed with a Perkin Elmer Diamond TG/DTA instrument at a heating rate of 10 °C/min in air. Raman spectra were recorded by a Renishaw R-3000QE system at room temperature in the backscattering configuration using an Argon ion laser with wavelength 785 nm. Powder XRD patterns were recorded at the rate of 3°/min on a Scintag X-ray diffractometer, model PAD X, equipped with a Cu Kα photon source (45 kV, 40 mA). SEM pictures were obtained by JEOL JXA-8900 instrument and the EDS measurements were performed with a ThermoNoran EDS System 6 attached to SEM. TEM measurements were performed on a Hitachi H-8100 microscope at 200 kV. The elemental analysis was performed using Thermo Scientific FLASH 2000 CHNS/O analyzer.
3. Results and Discussion
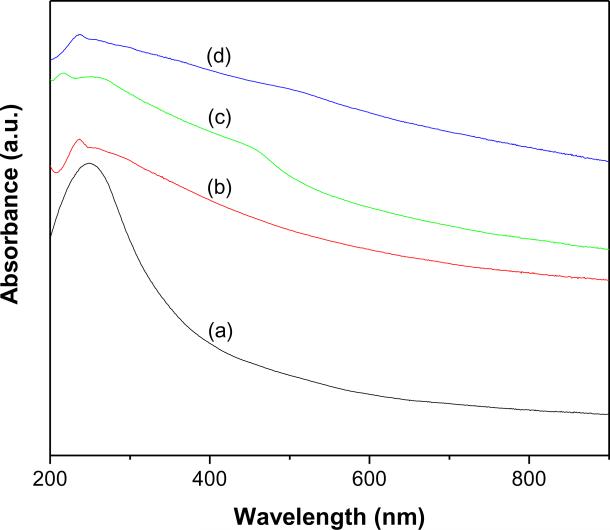
The UV-vis absorption spectra of MWCNTs-COOH, f-MWCNTs and f-MWCNTs-CdS and f-MWCNTs-Ag2S nanocatalysts dispersed in water are shown in Fig. 1. The aqueous suspension of MWCNTs-COOH showed the typical absorption band at 249 nm, which is attributed to C=C bonds of MWCNTs (Fig. 1a) [22]. The VanHove singularities of MWCNTs are usually lost after a high degree of covalent functionaliztion, which are ascribable to disruption of the delocalized π-conjugation in the sp2-hybridized nanotubes [23]. The characteristic absorption band of MWCNTs in the spectrum of f-MWCNTs appeared at 237 nm (Fig. 1b). The blue shift observed in the characteristic band of f-MWCNTs evidences the existence of covalently bonded PAMAM and their strong interaction with MWCNTs. The spectrum of f-MWCNTs-CdS nanocatalysts (Fig. 1c) displayed a shoulder band at 459 nm, which is the characteristic band of CdS QDs [24]. However, the spectrum of f-MWCNTs-Ag2S nanocatalysts (Fig. 1d) displayed an absorption tail between 450 and 600 nm, which corresponds to Ag2S QDs [25]. The semiconductor nanoparticles attached to CNTs usually show charge-transfer bands in the UV-vis absorption spectrum [26]. However, no such charge-transfer bands were observed for f-MWCNTs-CdS and f-MWCNTs-Ag2S nanocatalysts, which suggest that deposition of CdS and Ag2S QDs on f-MWCNTs does not cause any significant modification in the energy states of MWCNTs [26].
Fig. 1.
UV-vis absorption spectra of (a) MWCNTs-COOH (b) f-MWCNTs (c) f-MWCNTs-CdS nanocatalyst and (d) f-MWCNTs-Ag2S nanocatalyst.
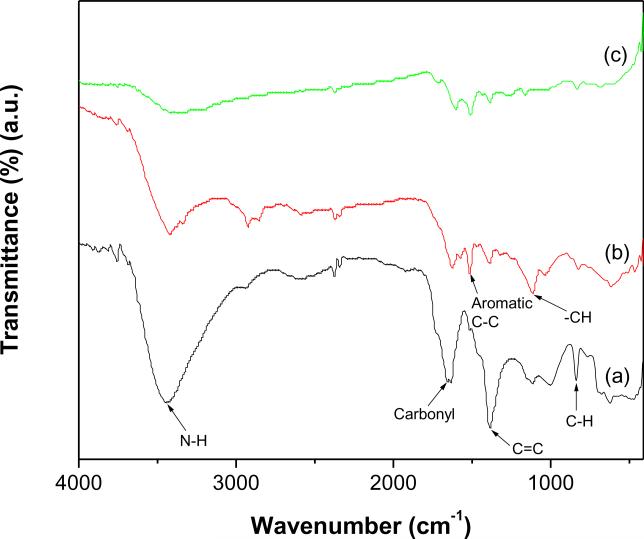
The FTIR spectra shown in Fig. 2 were used to monitor the surface modification of MWCNTs. The broad band displayed at 3440 cm−1 in the spectrum of f-MWCNTs (Fig. 2a) is ascribed to N-H stretching. The band appeared at 1649 cm−1 is attributed to carbonyl stretching of amide, which provides the strong evidence of formation of the amide linkage between MWCNTCOOH and ethylenediamine. The band related to C=O stretching of carboxylic groups was not observed around 1700 cm−1 (Fig. 2a). These results clearly demonstrate that carboxylic groups on MWCNTs-COOH are completely converted into amide groups, which confirms the successful grafting of PAMAM onto MWCNTs through covalent linkage [27]. In addition, the characteristic bands of MWCNTs were observed at 1520 cm−1 (aromatic C-C), 1380 (C=C), 1110 cm−1 (−CH) and 837 cm−1 (C-H para-aromatic out of plane vibration) [28]. All the bands displayed in the spectrum of f-MWCNTs (Fig. 2a) are present in the spectra of f-MWCNTs-CdS (Fig. 2b) and f-MWCNTs-Ag2S (Fig. 2c) nanocatalysts, the most obvious changes observed are in their band positions and intensities. The shifting of bands in f-MWCNTs-QDs nanocatalysts indicates the formation of stable hybrids between f-MWCNTs and QDs, and the strong interaction exists between them. The bands corresponding to various functional groups are intense in the spectrum of f-MWCNTs (Fig. 2a) while the intensity of the bands has diminished in the spectra of f-MWCNTs-QDs nanocatalysts (Fig.s 2b and c), which shows existence of large number of functional groups, thereby validating the functionalization process. The decreased intensity of bands in Figs. 2b and c demonstrates the conformational changes occurred in PAMAM by deposition of QDs. Overall, the IR results suggests that f-MWCNTs strongly interacted with QDs, an inference that is reinforced by the fact that repetitive washings of f-MWCNTs-QDs nanocatalysts could not remove QDs deposited on f-MWCNTs.
Fig. 2.
FTIR spectra of (a) f-MWCNTs (b) f-MWCNTs-CdS nanocatalyst and (c) f-MWCNTs-Ag2S nanocatalyst.
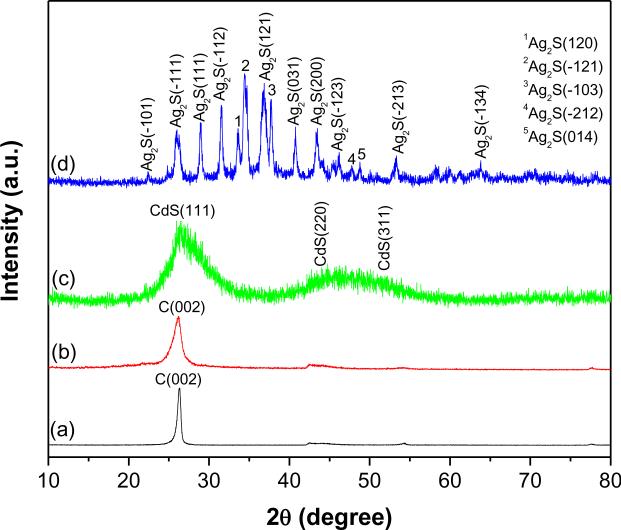
To further characterize the crystalline structure of QDs deposited on f-MWCNTs, XRD analysis was performed. Fig. 3 shows powder XRD patterns of p-MWCNTs, f-MWCNTs and f-MWCNTs-QDs nanocatalysts. The diffraction pattern of p-MWCNTs (Fig. 3a) displayed a peak at 26.3°, which is assigned to (0 0 2) plane of graphitic shells in the MWCNTs [29]. The diffraction pattern of f-MWCNTs (Fig. 3b) showed the characteristic diffraction peak of MWCNTs at 26.1°. On grafting of PAMAM, the characteristic peak of MWCNTs has not drastically shifted in f-MWCNTs, which indicates that general structure of MWCNTs is well retained after functionlization also. The f-MWCNTs-CdS nanocatalysts (Fig. 3c) showed a strong peak at 26.4° and a broad one around 47°, of these the initial peak resulted by overlapping of (0 0 2) plane from MWCNTs and (1 1 1) plane of cubic CdS, while the later peak is due to (0 0 2) reflection from MWCNTs. In Fig. 3c, it was expected to display two peaks around 43.8° and 51.7° from (2 2 0) and (3 1 1) planes of CdS, respectively (JCPDS 75-0581), whereas these bands merged and displayed a broad band due to nano size of CdS crystallites. In Fig. 3d, the diffraction peaks at 22.4°, 26.0°, 29.0°, 31.5°, 33.6°, 34.4°, 36.8°, 37.8°, 40.7°, 43.5°, 46.2°, 47.7°, 48.8°, 53.3° and 63.8° can be assigned to (−1 0 1), (−1 1 1), (1 1 1), (−1 1 2), (1 2 0), (−1 2 1), (1 2 1), (−1 0 3), (0 3 1), (2 0 0), (−1 2 3), (−2 1 2), (0 1 4), (−2 1 3) and (−1 3 4) planes of acanthite structure of Ag2S, respectively (JCPDS 14-0072). The observed results from XRD, confirms the successful deposition of CdS and Ag2S nanocrystals on f-MWCNTs. The mean crystallite size of CdS and Ag2S QDs calculated by Debye-Scherrer equation [30] was found to be 1.3 and 8.4 nm, respectively.
Fig. 3.
XRD patterns of (a) p-MWCNTs (b) f-MWCNTs (c) f-MWCNTs-CdS nanocatalyst and (d) f-MWCNTs-Ag2S nanocatalyst.
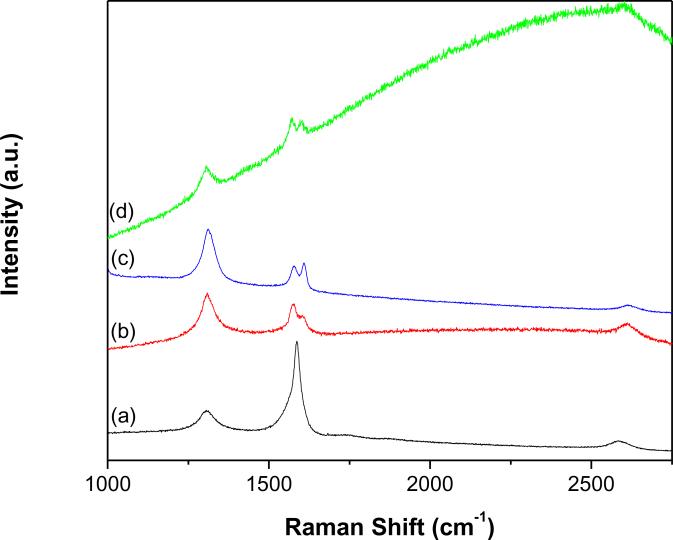
Raman spectroscopy provides the essential and useful information about covalent grafting of organic or polymeric functional groups onto MWCNTs. Fig. 4 shows the Raman spectra of p-MWCNTs (Fig. 4a), f-MWCNTs (Fig. 4b) and f-MWCNTs-CdS (Fig. 4c) and f-MWCNTs-Ag2S (Fig. 4d) nanocatalysts. All the spectra exhibited typical Raman characteristics of MWCNTs with a tangential G-band appearing in the region 1570–1610 cm−1 and a disorder-induced D-band appearing around 1310 cm−1. The G-band corresponds to Raman-active E2g, which is due to vibration mode corresponding to the movement in opposite directions of two neighboring carbon atoms in a single-crystal graphite sheet [31] and the D-band is associated with the presence of defects in the graphite layer [31]. Compare to p-MWCNTs, f-MWCNTs displayed strong differences in the relative intensity of D-band with respect to the main G-band. The relative increase in the intensity of D-band has been extensively utilized as an indication of perfect functionalization, as it reflects the hybridization of some carbon atoms from sp2 to sp3 [32]. In addition, f-MWCNTs and f-MWCNTs-QDs nanocatalysts displayed the D*-band around 2610 cm−1 and D2-band around 1605 cm−1. The D2-band is known to be directly affected by the disorder in nanotubes, this band is not observed for p-MWCNTs. The frequency of all the displayed bands is summarized in Table 1. The integrated intensity ratio of the D-band relative to the G-band (ID/IG) is extensively used as a measure of sidewall functionalization or introduction of defects on CNTs [33,34]. The observed intensity ratio of D- to G-band (Table 1) for f-MWCNTs (1.54) is higher than the ratio for p-MWCNTs (0.4), which suggests successful functionalization of p-MWCNTs through covalent grafting of PAMAM [35]. The ID/IG ratio for f-MWCNTs-CdS and f-MWCNTs-Ag2S nanocatalysts is 1.17 and 2.53, respectively, these values are differ from the value for f-MWCNTs (1.54), which indicates that the intrinsic disorder in f-MWCNTs was directly affected by deposition of QDs [36].
Fig. 4.
Raman spectra of (a) p-MWCNTs (b) f-MWCNTs (c) f-MWCNTs-CdS nanocatalyst and (d) f-MWCNTs-Ag2S nanocatalyst.
Table 1.
Raman frequencies displayed for p-MWCNTs, f-MWCNTs, f-MWCNTs-CdS nanocatalyst and f-MWCNTs-Ag2S nanocatalyst.
| Position of band (cm−1) |
ID/IG | ||||
|---|---|---|---|---|---|
| D-band | G-band | D2-band | D*-band | ||
| p-MWCNTs | 1306 | 1587 | - | 2583 | 0.40 |
| f-MWCNTs | 1310 | 1577 | 1604 | 2612 | 1.54 |
| f-MWCNTs-CdS nanocatalyst | 1305 | 1572 | 1603 | 2602 | 1.17 |
| f-MWCNTs-Ag2S nanocatalyst | 1311 | 1579 | 1608 | 2613 | 2.53 |
(−) denotes that D2-band was not displayed for p-MWCNTs.
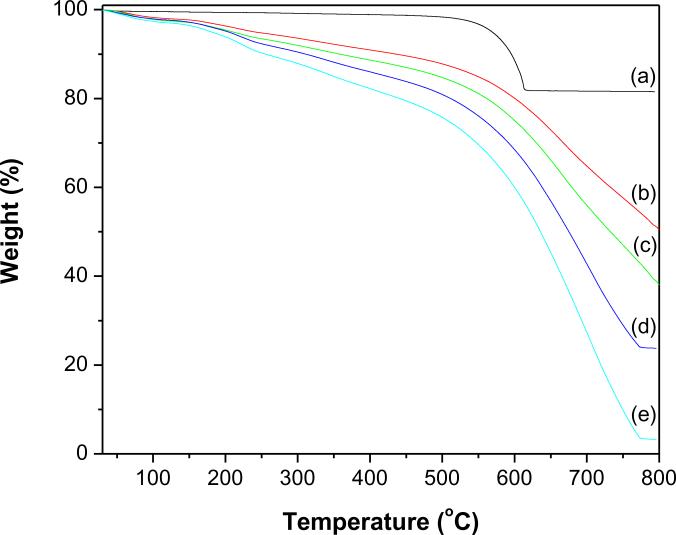
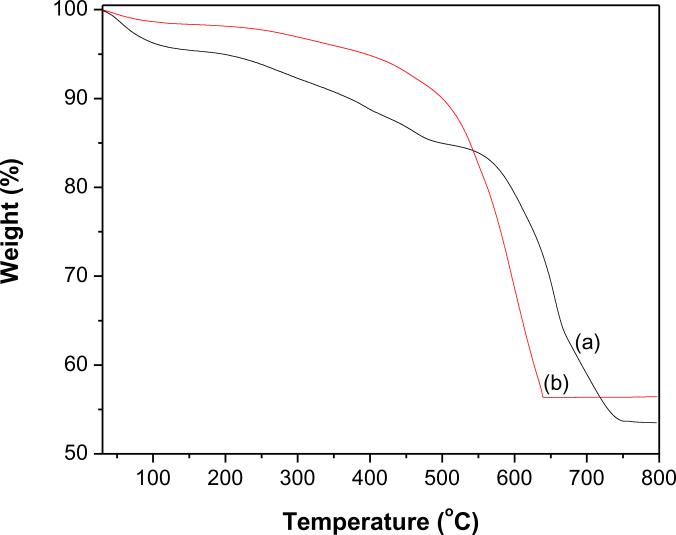
The degree of functionalization of MWCNTs-COOH and their successive modification by deposition of QDs were evaluated by TGA (Figs. 5and 6). All the profiles showed a minute weight loss below 110 °C due to loss of absorbed water. For MWCNTs-COOH (Fig. 5a) there is no significant weight loss (1.7%) was observed up to 500 °C, however, at the same temperature, MWCNTs-COOH functionalized with first generation PAMAM (f-MWCNTs/G1) (Fig. 5b) loses 12.2% of their weight, which demonstrates the existence of PAMAM on MWCNTs-COOH. The consecutive modification of MWCNTs-COOH with higher generation PAMAM, resulted in f-MWCNTs/G2 (Fig. 5c), f-MWCNTs/G3 (Fig. 5d) and f-MWCNTs/G4 or f-MWCNTs (Fig. 5e) and these exhibited a weight loss of 15.7, 19.1 and 24.8%, respectively at 500 °C. The linear increase in weight loss from f-MWCNTs/G1 to f-MWCNTs/G4 verifies the growth of hyperbranched, crosslinked PAMAM on MWCNTs-COOH. There are two major weight loss regions were observed in the profiles from f-MWCNTs/G1 to f-MWCNTs/G4 (Fig.s 5b–e). The initial weight loss in the region 300–550 °C may readily attributed to decomposition of PAMAM [36]. The following weight loss in the region 550–780 °C is owing to oxidative decomposition of MWCNTs [26]. The onset decomposition temperature for f-MWCNTs is around 300 °C, which is significantly higher than the boiling point of either ethylenediamine or methylmethacrylate. Such a high onset temperature for f-MWCNTs demonstrates that PAMAM is covalently linked to MWCNTs. This functionalization was further characterized by the residual mass remained at 800 °C, which is 49.7%, 37.1%, 23.8% and 3.2% for f-MWCNTs/G1, f-MWCNTs/G2, f-MWCNTs/G3 and f-MWCNTs/G4, respectively. The profiles of f-MWCNTs-QDs nanocatalysts (Figs. 6a and b) demonstrate that their thermal degradation behavior is different from f-MWCNTs and the deposition of QDs has markedly improved their thermal stability. The residual weight remained at 800 °C for f-MWCNTs-CdS and f-MWCNTs-Ag2S nanocatalysts is 53.5 and 56.4%, respectively, which indicates that QDs incorporated in both nanocatalysts are stable and strongly anchored. The weight loss due to QDs is not identified in Figs. 6a and b, which might be masked by the decomposition process of MWCNTs.
Fig. 5.
TGA profiles of (a) MWCNTs-COOH (b) f-MWCNTs/G1 (c) f-MWCNTs/G2 (d) f-MWCNTs/G3 and (e) f-MWCNTs/G4 or f-MWCNTs.
Fig. 6.
TGA profiles of (a) f-MWCNTs-CdS nanocatalyst and (b) f-MWCNTs-Ag2S nanocatalyst.
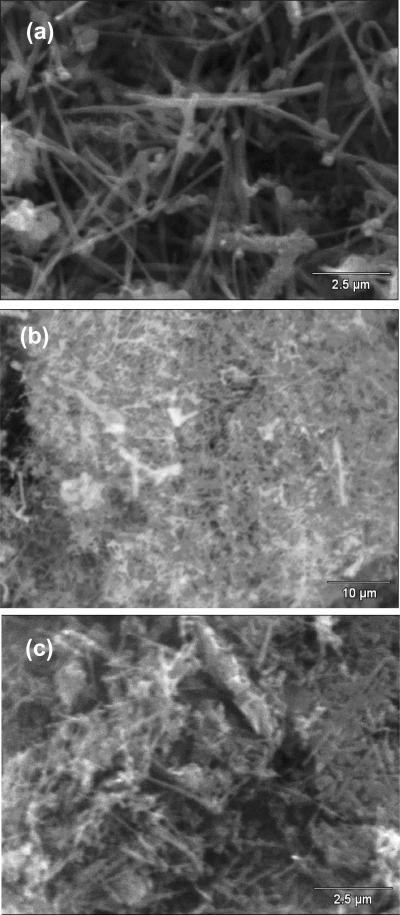
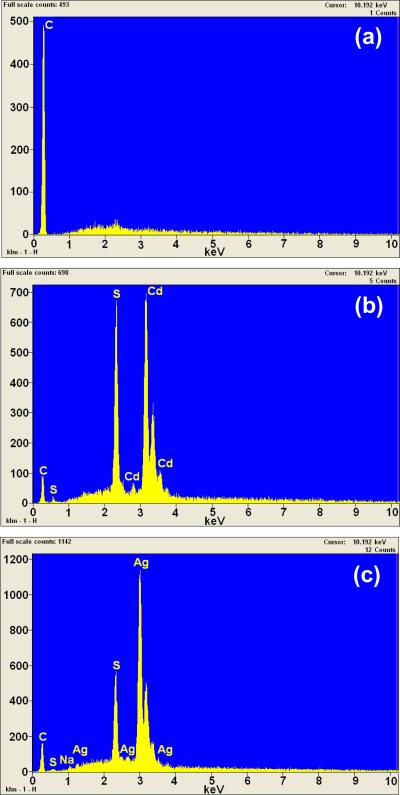
Fig. 7 shows the SEM images of f-MWCNTs (Fig. 7a) and f-MWCNTs-QDs nanocatalysts (Figs. 7b and c). The MWCNTs are loosely entangled and well dispersed after grafting of PAMAM (Fig. 7a). The high density of functional groups present on the surface of the f-MWCNTs could interact and simultaneously destroy the van der Waals forces among MWCNTs, which removed the entanglement of nanotubes and provided effective solubility to f-MWCNTs [37]. It can be seen from Figs. 7b and c that both CdS (Fig. 7b) and Ag2S (Fig. 7b) QDs have densely immobilized on f-MWCNTs. A large number of QDs are clearly observed onto f-MWCNTs, while it was difficult to determine their actual size and distribution due to the resolution limits of SEM. The elemental analysis data analyzed from EDS indicates the existence of C in f-MWCNTs (Fig. 8a). The spectrum of f-MWCNTs-CdS nanocatalysts (Fig. 8b) exhibit the presence of Cd, S and C elements, of these, Cd and S signals originated from CdS QDs, while the C signal is generated by MWCNTs. The atomic ratio of Cd to S in f-MWCNTs-CdS nanocatalysts was found to be 700:670, which is close to 1. The spectrum of f-MWCNTs-Ag2S nanocatalysts (Fig. 8c) shows the presence of Ag, S and C elements in the sample and the atomic ratio of Ag to S was found to be 1140:575, which is very near to 2. Thus EDS analysis quantitatively confirmed the existence of CdS and Ag2S QDs in f-MWCNTs-CdS and f-MWCNTs- Ag2S nanocatalysts, respectively.
Fig. 7.
SEM images of (a) f-MWCNTs (b) f-MWCNTs-CdS nanocatalyst and (c) f-MWCNTs-Ag2S nanocatalysts.
Fig. 8.
EDS of (a) f-MWCNTs (b) f-MWCNTs-CdS nanocatalyst and (c) f-MWCNTs-Ag2S nanocatalyst.
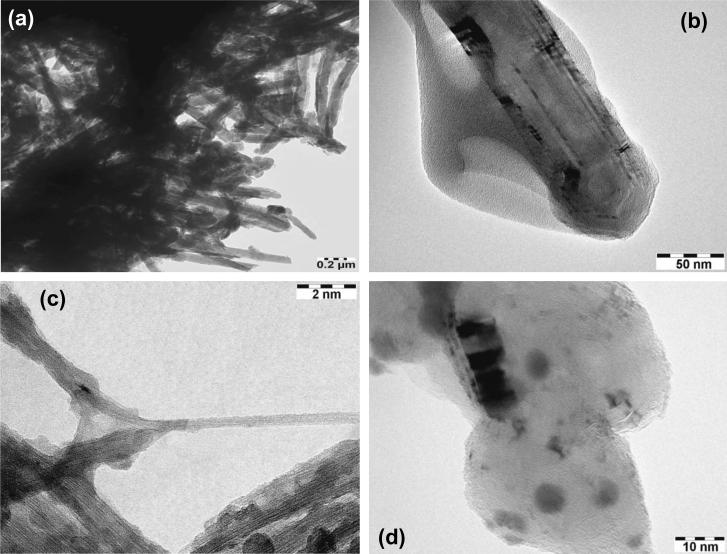
The direct evidence for the surface modification of MWCNTs and the successive deposition of CdS and Ag2S QDs was provided by TEM images illustrated in Fig. 9. The effective reduction in entanglement of MWCNTs by functionalizing them with PAMAM is obvious in Fig. 9a. In addition, the clear vicinity of PAMAM grafted to MWCNTs is noticeable in Fig. 9b, which demonstrates the effectiveness of our functionalization method. Figs. 9c and d provide clear evidence of coupling of MWCNTs, PAMAM and QDs in f-MWCNTs-QDs nanocatalysts. The CdS QDs (Fig. 9c) are non-spherical in shape and formed the clusters by aggregation, while Ag2S QDs (Fig. 9d) are nearly spherical and efficiently dispersed over f-MWCNTs. Both CdS and Ag2S QDs are well immobilized on f-MWCNTs. No loosely bound or free-standing QDs were observed in f-MWCNTs-QDs nanocatalysts. The average diameter of QDs obtained from TEM for CdS and Ag2S were found to be 1.5 and 9.2 nm, respectively, these values well agree with the values calculated from Debye-Scherrer equation.
Fig. 9.
TEM images of (a) and (b) f-MWCNTs (c) f-MWCNTs-CdS nanocatalyst and (d) f-MWCNTs-Ag2S nanocatalyst.
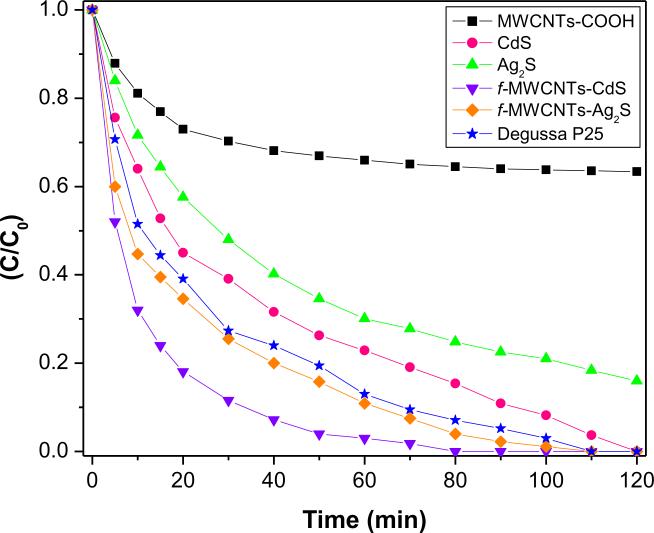
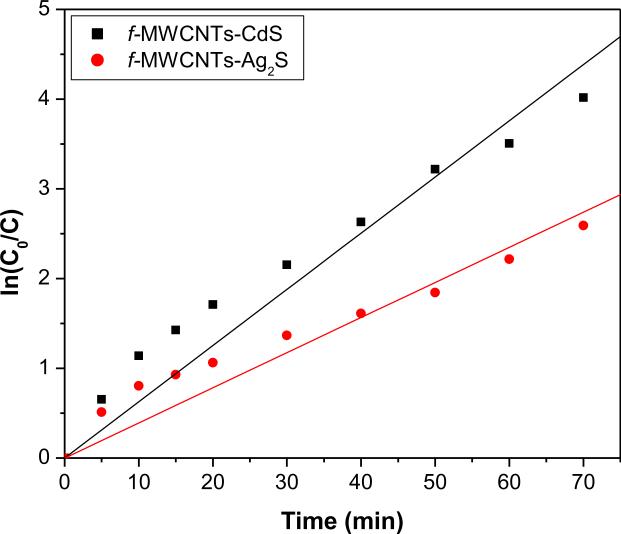
The catalytic activity of f-MWCNTs-QDs nanocatalysts was evaluated by photodegradation of MO and the results are compared with the efficiency of MWCNTs-COOH, CdS and/or Ag2S QDs and Degussa P25. No detectable degradation of MO was observed without any catalyst under illumination of UV light, which reveals that the degradation occurred was due to catalysts. The profiles for degradation of MO in presence of nanocatalysts are shown in Fig 10. It can be seen that f-MWCNTs-QDs nanocatalysts have higher degradation efficiency than MWCNTs-COOH, CdS and/or Ag2S QDs and Degussa P25. In presence of both f-MWCNTs-CdS and f-MWCNTs-Ag2S nanocatalysts, MO was completely degraded at 80 and 100 mins of illumination, respectively. Also, the total degradation of MO was occurred with CdS QDs and Degussa P25 at 120 and 110 mins of exposure, respectively, while MWCNTs-COOH and Ag2S QDs were unable for complete degradation of MO up to 120 mins of illumination. Hence the efficiency of f-MWCNTs-CdS and f-MWCNTs-Ag2S nanocatalysts is higher than their respective QDs and Degussa P25, which demonstrates that the presence of f-MWCNTs facilitates the catalytic activity of f-MWCNTs-QDs nanocatalysts. The existence of f-MWCNTs in f-MWCNTs-QDS nanocatalysts provides multiple benefits, primarily f-MWCNTs behaves like a dispersing agent and limit the size of QDs, which enhances the specific surface area of nanocatalysts. Thus, these nanocatalysts can adsorb MO more effectively in addition to O2, which leads to high degradation efficiency. Secondly the semiconductor nature of MWCNTs has the property of electron transfer, which inhabits the recombination rate of excited electron and hole (e−-h+) pairs from QDs under illumination of UV light [8,38]. The grafting of PAMAM onto MWCNTs-COOH provides favorable environment by generating more number of active sites for better immobilization of QDs, which enhances the density of QDs. Hence the observed improvement in the activity of f-MWCNTs-QDs nanocatalysts can be attributed to complex structure of f-MWCNTs and their strong interaction with QDs. Further to quantify the rate of reaction for the degradation of MO in presence of f-MWCNTs-QDs nanocatalysts, a simple first-order rate equation derived from Langmuir-Hinshelwood (L-H) model was used [39,40]. In the reported degradation experiments, initial concentration, C0 of MO was very small, under this condition the L-H equation becomes, ln(C0/C)=kat, where, ka is the apparent first order rate constant and t is the time of illumination. The rate constants calculated for degradation of MO in presence of f-MWCNTs-CdS and f-MWCNTs-Ag2S nanocatalysts were found to be 0.0626 and 0.0391 min−1, respectively (Fig. 11).
Fig. 10.
Photocatalytic degradation of MO in presence of MWCNTs-COOH, QDs, f-MWCNTs-QDs nanocatalysts and Degussa P25.
Fig. 11.
Langmuir-Hinshelwood plot for degradation of MO in presence of f-MWCNTs-QDs nanocatalysts.
The most important factor for the practical utility of a photocatalyst is its reusability and stability during the course of illumination. In general, the separation and recovery of suspended photocatalysts is difficult, whereas both f-MWCNTs-CdS and f-MWCNTs-Ag2S nanocatalysts were successfully recovered by simple centrifugation process after photolysis. The XRD patterns acquired after photolysis (Figs. S1 and S2) illustrates that there are no structural changes or detachment of QDs in nanocatalysts, which demonstrates the higher stability of f-MWCNTs-QDs nanocatalysts resulted from strong adherence of QDs. Thus f-MWCNTs as support for QDs can inhabit the photocorrosion and stabilizes the QDs in solution of MO.
4. Conclusions
Two novel nanocatalysts, f-MWCNTs-CdS and f-MWCNTs-Ag2S were produced by successful deposition of CdS and Ag2S QDs, respectively onto MWCNTs with dendrimer-mediated synthesis using NH2-terminated hyperbranched, crosslinked PAMAM. The synthetic strategy did not ruin structure of nanotubes, rather it realized the multiple functionalization of MWCNTs with PAMAM and QDs. Importantly, we succeeded in revealing the PAMAM on the surface of MWCNTs by TEM analysis. Since the successful replacement of weak van der Waals force among the pristine MWCNTs by strong electrostatic repulsive multiamine terminated, hyperbranched, crosslinked PAMAM resulted in the loosening of entanglement of f-MWCNTs. With increasing the generation of PAMAM, hydrophilicity of f-MWCNTs was enhanced. The cardinal advantage of f-MWCNTs-QDs nanocatalysts is admirable degradation efficiency of MO, which is an important organic dye pollutant of waste water produced from industrial processes. Both f-MWCNTs-QDs nanocatalysts are promising reusable photocatalysts and their superior catalytic performance originates in charge transfer processes through the interface of f-MWCNTs and QDs, which effectively reduces the recombination rate of electron-hole pairs. This method is indeed viable for hybridization of CNTs using various functional polymers and QDs to accomplish synergistic enhancement in their activity stemmed from each component.
Supplementary Material
Acknowledgements
The authors acknowledge the support from NIH-NIGMS grant #1SC3GM086245 and the Welch foundation.
Footnotes
Publisher's Disclaimer: This is a PDF file of an unedited manuscript that has been accepted for publication. As a service to our customers we are providing this early version of the manuscript. The manuscript will undergo copyediting, typesetting, and review of the resulting proof before it is published in its final citable form. Please note that during the production process errors may be discovered which could affect the content, and all legal disclaimers that apply to the journal pertain.
References
- [1].Iijima S. Nature. 1991;354:56–58. [Google Scholar]
- [2].Murugesan S, Myers K, Subramanian V. Appl. Catal. B: Environ. 2011;103:266–274. [Google Scholar]
- [3].Dai Y, Pan T, Liu W, Jehng J. Appl. Catal. B: Environ. 2011;103:221–225. [Google Scholar]
- [4].Zhang S, Shao Y, Yin G, Lin Y. Appl. Catal. B: Environ. 2011;102:372–377. [Google Scholar]
- [5].Robel I, Bunker BA, Kamat PV. Adv. Mater. 2005;17:2458. [Google Scholar]
- [6].Wang W, Serp P, Kalck P, Faria JL. Appl. Catal. B: Environ. 2005;56:305. [Google Scholar]
- [7].An G, Ma W, Sun Z, Liu Z, Han B, Miao S, Miao Z, Ding K. Carbon. 2007;45:1795–1801. [Google Scholar]
- [8].Ma L, Sun H, Zhang Y, Lin Y, Li J, Wang E, Yu Y, Tan M, Wang J. Nanotechnology. 2008;19:115709–115716. doi: 10.1088/0957-4484/19/11/115709. [DOI] [PubMed] [Google Scholar]
- [9].Wu H, Wang Q, Yao Y, Qian C, Zhang X, Wei X. J. Phys. Chem. C. 2008;112:16779–16783. [Google Scholar]
- [10].Martinez C, Canle M, Fernandez MI, Santaballa JA, Faria J. Appl. Catal. B: Environ. 2011;102:563–571. [Google Scholar]
- [11].Li S, Yu X, Zhang G, Ma Y, Yao J, Keita B, Louis N, Zhao H. J. Mater. Chem. 2011;21:2282–2287. [Google Scholar]
- [12].Yan Y, Sun H, Yao P, Kang S, Mu J. Appl. Surf. Sci. 2011;257:3620–3626. [Google Scholar]
- [13].Apte SK, Garaje SN, Mane GP, Vinu A, Naik SD, Amalnerkar DP, Kale BB. Small. 2011;7:957–964. doi: 10.1002/smll.201002130. [DOI] [PubMed] [Google Scholar]
- [14].Wang Q, Chen G, Zhou C, Jin R, Wang L. J. Alloys Compd. 2010;503:485–489. [Google Scholar]
- [15].Hu Y, Liu Y, Qian H, Li Z, Chen J. Langmuir. 2010;26:18570–18575. doi: 10.1021/la103191y. [DOI] [PubMed] [Google Scholar]
- [16].Wang C, Ao Y, Wang P, Hou J, Qian J, Zhang S. Mater. Lett. 2010;64:439–441. [Google Scholar]
- [17].Xie Y, Heo SH, Kim YN, Yoo SH, Cho SO. Nanotechnology. 2010;21:15703–15709. doi: 10.1088/0957-4484/21/1/015703. [DOI] [PubMed] [Google Scholar]
- [18].Neves MC, Nogueira JMF, Trindade T, Mendonca MH, Pereira MI, Monteiro OC. J. Photochem. Photobiol. A. 2009;204:168–173. [Google Scholar]
- [19].Neelgund GM, Oki A. Appl. Catal. A: Gen. 2011;399:154–160. doi: 10.1016/j.apcata.2011.03.050. [DOI] [PMC free article] [PubMed] [Google Scholar]
- [20].Neelgund GM, Olurode K, Luo Z, Oki A. Mater. Sci. Eng. C. (In Press) [Google Scholar]
- [21].Cheng Y, Qu H, Ma M, Xu Z, Xu P, Fang Y, Xu T. Eur. J. Med. Chem. 2007;42:1032–1038. doi: 10.1016/j.ejmech.2006.12.035. [DOI] [PubMed] [Google Scholar]
- [22].Xu L, Ye Z, Cui Q, Gu Z. Macromol. Chem. Phys. 2009;210:2194–2202. [Google Scholar]
- [23].Kong L, Wang J, Fu X, Zhong Y, Meng F, Luo T, Liu J. Carbon. 2010;48:1262–1270. [Google Scholar]
- [24].Weller H. Angew. Chem. Int. Edn. 1993;32:41–53. [Google Scholar]
- [25].Hota G, Jain S, Khila KC. Colloids Surf. A. 2004;232:119–127. [Google Scholar]
- [26].Wu HX, Cao WM, Chen Q, Liu MM, Qian SX, Jia NQ, Yang H, Yang SP. Nanotechnology. 2009;20:195604–195613. doi: 10.1088/0957-4484/20/19/195604. [DOI] [PubMed] [Google Scholar]
- [27].Lu X, Imae T. J. Phys. Chem. C. 2007;111:2416–2420. [Google Scholar]
- [28].Sun ZP, Zhang XG, Liang YY, Li HL. Electrochem, Comm. 2009;11:557–561. [Google Scholar]
- [29].Neelgund GM, Oki A. J. Nanosci. Nanotechnol. 2011;11:3621–3629. doi: 10.1166/jnn.2011.3756. [DOI] [PMC free article] [PubMed] [Google Scholar]
- [30].Cullity BD. Elements of X-Ray Diffraction. Edison-Wesley Publishing Company, Inc; 1978. [Google Scholar]
- [31].Georgakilas V, Voulgaris D, Vazquez E, Prato M, Guldi DM, Kukovecz A, Kuzmany H. J. Am. Chem. Soc. 2002;124:14318–14319. doi: 10.1021/ja0260869. [DOI] [PubMed] [Google Scholar]
- [32].Kim UJ, Furtado CA, Liu X, Chen G, Eklund PC. J. Am. Chem. Soc. 2005;127:15437–15445. doi: 10.1021/ja052951o. [DOI] [PubMed] [Google Scholar]
- [33].Jia N, Lian Q, Tian Z, Duan X, Yin M, Jing L, Chen S, Shen H, Gao M. Nanotechnology. 2010;21:45606–45613. doi: 10.1088/0957-4484/21/4/045606. [DOI] [PubMed] [Google Scholar]
- [34].Moona SY, Kusunosea T, Tanakab S, Sekino T. Carbon. 2009;47:2924–2932. [Google Scholar]
- [35].He N, Chen Y, Bai J, Wang J, Blau WJ, Zhu J. J. Phys. Chem. C. 2009;113:13029–13035. [Google Scholar]
- [36].Yuan W, Guohua J, Che J, Qi X, Xu R, Chang MW, Chen Y, Lim SY, Dai J, Chan-Park MB. J. Phys. Chem. C. 2008;112:18754–18759. [Google Scholar]
- [37].Sahoo NG, Cheng HKF, Li L, Chan SH, Judeh Z, Zhao J. Adv. Funct. Mater. 2009;19:3962–3971. [Google Scholar]
- [38].Wildoer JW, Venema LC, Rinzler AG, Smalley RE, Dekker C. Nature. 1998;391:59–63. [Google Scholar]
- [39].Xu YJ, Zhuang Y, Fu X. J. Phys. Chem. C. 2010;114:2669–2676. [Google Scholar]
- [40].Wang XH, Li JG, Kamiyama H, Moriyoshi Y, Ishigaki T. J. Phys. Chem. B. 2006;110:6804–6809. doi: 10.1021/jp060082z. [DOI] [PubMed] [Google Scholar]
Associated Data
This section collects any data citations, data availability statements, or supplementary materials included in this article.


