

Abstract
Determining the role of lipid raft nanodomains in G protein-coupled receptor signaling remains fraught by the lack of assays directly monitoring rafts in native membranes. We thus combined extensive biochemical and pharmacological approaches to a nanoscale strategy based on bioluminescence resonance energy transfer (BRET) to assess the spatial and functional influence of cholesterol-rich liquid-ordered lipid nanodomains on β2 adrenergic receptor (β2AR) signaling. The data revealed that whereas β2AR did not partition within liquid-ordered lipid phase, a pool of G protein and adenylyl cyclase (AC) were sequestered in these domains. Destabilization of the liquid-ordered phase by cholesterol depletion led to a lateral redistribution of Gαs and AC that favored interactions between the receptor and its signaling partners as assessed by BRET. This resulted in an increased basal and agonist-promoted β2AR-stimulated cAMP production that was partially dampened as a result of constitutive protein kinase A-dependent phosphorylation and desensitization of the receptor. This restraining influence of nanodomains on β2AR signaling was further substantiated by showing that liquid-ordered lipid phase stabilization using caveolin overexpression or increasing membrane cholesterol amount led to an inhibition of β2AR-associated signaling. Given the emerging concept that clustering of receptors and effectors into signaling platforms contributes to the efficacy and selectivity of signal transduction, our results support a model whereby cholesterol-promoted liquid-ordered lipid phase-embedding Gs and AC allows their lateral separation from the receptor, thus restraining the basal activity and controlling responsiveness of β2AR signaling machinery within larger signaling platforms.
The concept that signaling through membrane receptors occurs within large signaling complexes has been recently proposed (1–10). The formation of these signalosomes appears to be dependent mainly on specific protein-protein interactions between signaling partners (4, 11) occurring, in part, at an early stage following their synthesis (7, 9, 12). By controlling protein interaction probabilities (13, 14), the lateral organization of the signalosome within the embedding membrane could also influence signaling transduction fidelity and efficacy. The determination of the exact role of lateral membrane heterogeneities in signal transduction, however, remains poorly understood.
In the last decade, lateral membrane organization, which is governed by an intricate lipid-protein association, has been the subject of intense scrutiny that eventually led to the hypothesis of raft domains (15). Lipid rafts have been characterized as dynamic nanometer scale membrane domains of a size most likely less than 10 nm (16, 17). Their formation is driven by the tight packing of cholesterol with long and saturated acyl chain lipids that leads to the formation of a liquid-ordered phase segregating the embedded proteins away from the rest of the membrane (15, 18, 19). Flotation on sucrose gradient and resistance to solubilization by non-ionic detergents such as Triton X-100 has been commonly used to characterized raft protein and lipid content. Their capacity to be organized in higher order lateral domains, such as caveolae, gave rise to a sophisticated working model of the plasma membrane as a mosaic of actively maintained lateral domains (18, 20).
The canonical signaling pathway associated with the seven-transmembrane β2-adrenergic receptor (β2AR)5 leads to the regulation of cyclic AMP (cAMP) production through the activation of adenylyl cyclase (AC) by the stimulatory G protein, Gs (21). Several groups have shown that the β2AR is most likely present at the plasma membrane in large protein complexes containing most of the molecular actors necessary for both receptor activity and regulation (22–24). Interestingly, a near field optical microscopy study revealed β2AR clusters of ∼140 nm in diameter, which may represent the structural basis of these signaling complexes (6). The link between such signaling platforms, also called a signalosome, and the lipid-mediated lateral segregation of the signaling molecules remains however poorly understood.
Experimental observations made during the last 15 years led researchers to propose that cholesterol-enriched membrane lipid microdomains, and more specifically caveolae, may influence β2AR signal transduction properties by controlling its association with its signaling partners (22–24). However, such a model whereby β2AR signaling machinery confinement inside cholesterol-enriched caveolae promotes signal transduction is difficult to reconcile with the negative role that cholesterol seems to play on β2AR-associated effectors as well as with the rather low percentage of β2AR signalosomes actually localized in caveolae (6). Indeed, cholesterol depletion is generally found to increase β2AR-stimulated cAMP production (22, 25), whereas cholesterol supplementation has the inverse effect (26–28).
Considering the evolution of our understanding of the membrane lateral organization and the inherent multiple nature of membrane domains, one could argue that the role of cholesterol-enriched domains in the regulation of β2AR signaling efficacy may have been difficult to clarify in part because of the different resolution power of the various techniques used for studying signal transduction and to characterized lipid-rafts. To test this possibility, we performed a detailed analysis of the impact of cholesterol on the lateral membrane distribution of the β2AR signaling components as well as their coupling efficacy. For this purpose, we combined pharmacological, biochemical, and biophysical characterizations of the membrane environment of the β2AR and its effectors, Gαs and AC V/VI and of its functional consequences.
EXPERIMENTAL PROCEDURES
Constructs—FLAG-β2ARWT cloned into pcDNA3 was kindly provided by Dr. Stefano Marullo (Cochin Institute, Paris). HA-β2ARWT was described previously (29). cDNA of β2ARPKA-, as described (30), was subcloned into pcDNA3.1 following HindIII/EcoRI digestion. β2AR-Luc was described previously (31). Plasmid encoding the HA-caveolin-3 (Cav-3) and AC V-YFP constructs were kind gifts from Dr. R. G. Parton (University of Queensland Medical School, Australia) and Dr. Zvi Voegel (Weizmann Institute of Science, Rehovot, Israel), respectively. pGFP2-Gαs vector was described previously (32).
Cell Culture and Transfection—Human embryonic kidney 293S cells (HEK293) stably expressing FLAG-β2ARWT, HA-β2ARWT, or β2ARPKA- were maintained in Dulbecco's modified Eagle's medium supplemented with 10% fetal bovine serum, 100 units/ml penicillin and streptomycin, 2 mm l-glutamine, and 250 μg/ml Geneticin (all from Wisent, St. Bruno, CA). When needed, transient transfections were performed using FuGENE 6 transfection reagent (Roche Diagnostics) following the supplier's recommendation. Twenty-four hours after transfection, supplemented Dulbecco's modified Eagle's medium was renewed, and cells were cultured for an additional 24 h.
Cholesterol Depletion and Complementation—For cholesterol depletion experiments, HEK293 cells were rinsed once with phosphate-buffered saline (PBS) and incubated for 1 h at 37 °C with 2% 2-hydroxypropyl-β-cyclodextrin (w/v) (CD) or cholesterol oxidase (1 unit/ml) in Dulbecco's modified Eagle's medium. Following depletion treatment, membrane cholesterol concentration was restored by incubating cells with cholesterol-methyl-β-cyclodextrin inclusion complexes for 1 h at 37 °C (33). Membrane cholesterol content was measured using an Amplex Red™ cholesterol assay kit (Molecular Probes) following the supplier's recommendation.
Membrane Preparation—Cells were rinsed once with PBS, lysed in 5 mm Tris-HCl, pH 7.4, 2 mm EDTA along with protease inhibitors (5 μg/ml leupeptin, 5 μg/ml soybean trypsin inhibitor, and 10 μg/ml benzamidine), and homogenized with a Polytron homogenizer (Ultra-Turrax; Janke and Kunkel, Staufen, Germany) for 15 s. Homogenates were centrifuged at 500 × g for 5 min at 4 °C, and the resulting supernatant fraction was centrifuged at 25,000 × g for 20 min at 4 °C. Membrane pellets were then washed twice in the same buffer and centrifuged again. The resulting membrane pellets were finally resuspended in 75 mm Tris-HCl, pH 7.4, 5 mm MgCl2, 2 mm EDTA and the protease inhibitor mixture. Membranes were immediately used for adenylyl cyclase activity and/or radioligand binding assays. Protein content in the membrane preparation was evaluated using the Bradford protein assay (34) (Bio-Rad).
Radioligand Binding Assay—Radioligand binding assays were performed as described previously (35). Membrane proteins were incubated in a total volume of 0.5 ml in a buffer containing 75 mm Tris-HCl, pH 7.4, 5 mm MgCl2, 2 mm EDTA, protease inhibitors, and varying concentrations of β2AR ligands depending on the type of experiment. For competition experiments, [I125]cyanopindolol (CYP) was used at a concentration of 25 pm and competed by increasing concentrations of isoproterenol, whereas for saturation experiments increasing concentrations of [I125]CYP (2–400 pm) were used. Binding reactions were incubated at room temperature for 90 min and terminated by rapid filtration through glass fiber (GF/C) filters (Whatman) using ice-cold 25 mm Tris-HCl, pH 7.4. In some experiments, the binding reaction was carried out in the presence or absence of 250 μm Gpp(NH)p.
Adenylyl Cyclase Activity—Adenylyl cyclase activity was assessed according to the Salomon method (36). Membrane proteins were incubated in the absence or presence of various concentrations of isoproterenol, forskolin, Gpp(NH)p, or MnCl2 along with 0.1 mm cAMP, 53 μm GTP, 2.7 mm phosphoenolpyruvate, 0.1 mm isobutylmethylxanthine, 1 unit of myokinase, 0.2 unit of pyruvate kinase, and 0.12 mm ATP (106 cpm of [α-32P]ATP/assay) (NEN-Mandel) in a total volume of 50 μl. The samples were incubated at 37 °C for 20 min, and the reaction was stopped by the addition of 1 ml of a cold stop solution containing 0.4 mm ATP, 0.3 mm cAMP, and [3H]cAMP (50,000 cpm). cAMP was isolated by sequential chromatography using a Dowex gel column followed by filtration on an aluminum oxide column.
Biochemical Preparation of Light Density Membrane Microdomains—Detergent-free purification of cholesterol-enriched microdomains was carried out according to the protocol described by Song et al. (37). Briefly, after two washes in cold PBS, cells were scraped into 1 ml of 500 mm sodium carbonate, pH 11, and homogenized sequentially using a loose-fitting Dounce homogenizer (10 strokes), a Polytron tissue grinder (three 10-s bursts at 24,000 min-1), and a sonicator (three 20-s bursts, Branson Sonifier 250; Branson Ultrasonics). The homogenate was then adjusted to 40% sucrose by the addition of 1 ml of 80% sucrose prepared in MBS (25 mm MES, pH 6.5, 0.15 m NaCl), placed at the bottom of an Ultra-Clear centrifuge tube (Beckman Instruments), and overlaid with a 5–35% discontinuous sucrose gradient (6.5 ml of 35% sucrose/3.5 ml of 5% sucrose; both in MBS containing 250 mm sodium carbonate). An alternative detergent-free method of microdomain preparation developed by MacDonald and Pike (38) was also used to compare the two methods.
Detergent-resistant membranes (DRMs) were obtained by sucrose flotation after solubilization of either whole cells or membrane preparation as indicated in the legends for Figs. 5, 8, and 9. Briefly, cells or membranes where solubilized in ice-cold TKM buffer (50 mm Tris, pH 7.4, 25 mm KCl, 5 mm MgCl2, 1 mm EGTA) containing 1 or 0.1% Triton X-100 (v/v) (Sigma). The resulting preparations were loaded on a sucrose step gradient as described above, except that sucrose solutions were prepared in TKM instead of MBS buffer.
FIGURE 5.
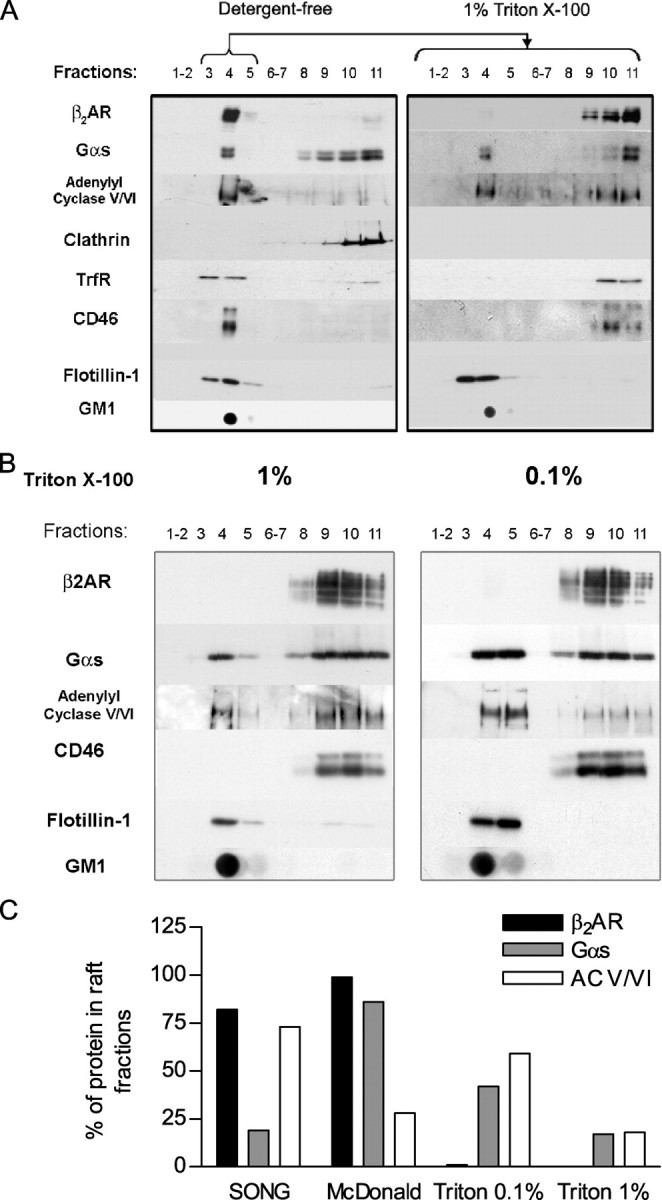
Comparison of the membrane distribution displayed by β2AR, Gαs, and AC V/VI proteins following preparation of low density membranes using detergent-free and/or detergent-based methods. Low density membranes of cells stably expressing β2AR (1 pmol/mg) were prepared following distinct biochemical protocols. A, light density fractions were first purified, following a sodium carbonate detergent-free method (Song method (37)), on a sucrose gradient (left panel). Light density membranes (fractions 3–5) were submitted to a secondary solubilization in the presence of 1% Triton X-100 (right panel) and fractionated on an additional sucrose gradient. The presence of β2AR, Gαs, AC V/VI, clathrin heavy chain, transferrin receptor (TrfR), CD46, and flotillin-1 was detected in each fraction by Western blot using the appropriate antibodies. GM1 was detected by dot-blot using peroxidase-coupled CTx. B, DRM were directly purified using a Triton X-100 lysis method followed by a separation on sucrose gradient. Lysis was performed in the presence of 1% (left panel) or 0.1% (right panel) Triton X-100. Detection of the different proteins was carried out as described in A. C, relative distributions of β2AR, Gαs, and AC V/VI in light density membranes were compared using a sodium carbonate-based method, another independent detergent-free method (MacDonald method (38)), or a classical Triton X-100-based method using increasing Triton X-100 concentrations (0.1 or 1%). Data correspond to the percentage of protein detected in the light density membrane fractions (fractions 3–5) compared with the total amount of protein detected and represent the mean ± S.E. of two to three independent experiments.
FIGURE 8.

Effect of cholesterol depletion on AC V/VI and Gαs submembrane distribution and on their respective association with β2AR. A, cells stably expressing 1 pmol/mg β2AR were subjected or not (Control) to cholesterol depletion using 2% CD for 1 h at 37 ° C, and to cholesterol reloading using CD-cholesterol complex (Complementation). Following these treatments, membranes were solubilized with 1% Triton X-100 and fractionated on a sucrose gradient. An equal volume of fractions from each sucrose gradient was analyzed for the presence of β2AR, Gαs, AC V/VI, and GM1 by Western blot using the appropriate antibodies. B, cells transiently expressing β2AR-RLuc and either GFP2-Gαs or AC V-YFP were cholesterol-depleted and reloaded as described in A. Immediately following treatment, cells were washed in PBS and treated or not (Vehicle) for 1 min with isoproterenol (Iso), and BRET was measured after addition of substrate. Results represent the mean ± S.E. of 3–5 independent experiments. ***, p < 0.001; **, p < 0.01; n.s.d., p > 0.05 (no significant difference).
FIGURE 9.

Caveolin-3 overexpression promotes Gαs/AC V/VI distribution into light density membranes and decreasesβ2AR signaling efficacy. Cells stably expressingβ2AR were transiently transfected with caveolin-3 or the empty vector (pcDNA3). A, the impact of Cav-3 on the membrane distribution of β2AR/Gαs/AC V/VI was determined by performing a Triton X-100-based preparation of light density microdomains. B, the effect of Cav-3 overexpression on the binding properties of β2AR was assessed by competing [I125]CYP binding with increasing concentrations of isoproterenol. C and D, cAMP production in the presence of increasing amount of isoproterenol (C) or a single maximal dose of MnCl2 (D; 100 mm) was measured. All of these pharmacological data represent the mean ± S.E. of three independent experiments performed in triplicate in the case of binding experiments and in duplicate in the case of the AC assay.
Gradients prepared with the different methods were centrifuged at 200,000 × g for 16–20 h in an SW 41 rotor (Beckman L70 Ultracentrifuge). Eleven 1-ml fractions were collected from the top of the gradients. The protein content of each fraction was measured using a Nano-Orange™ protein quantification kit (Molecular Probes).
Antibodies and Immunoblotting—Equal volumes of each gradient fraction (except for fractions 1–2 and 6–7, which were pooled together) were resolved on SDS-PAGE under reducing conditions and transferred onto polyvinylidene fluoride membranes (Immobilon) (except for CD46, which was detected from a separated gel run under nonreducing condition). For immunodetection, the following antibodies were used: anti-CD46 (clone J4-48) was from Immunotech; anti-β2AR (clone H-20), anti-AC V/VI (Clone C-17), and anti-Cav-3 were from Santa Cruz Biotechnology; anti-flotillin-1 and anti-clathrin heavy chain were from Transduction Laboratories; anti-transferrin receptor was from Zymed Laboratories Inc. Anti-Gαs antibody was a gift from Dr. Jean-Luc Guillaume (Institut Cochin, Paris), and anti-β2AR phosphoserine-specific antibody (2G3) (39) was a gift from Richard B. Clark (University of Texas, Houston). Immobilized antigen-antibody complexes were detected with the appropriate species-specific affinity-purified secondary horseradish peroxidase-conjugated antibodies (Amersham Biosciences) and developed using Chemiluminescence Reagent Plus (PerkinElmer Life Sciences). GM1 gangliosides were detected by dot-blot using peroxidase-coupled cholera toxin subunit B (CTx; Sigma).
GM1 Aggregation and Confocal Microscopy—To induce GM1 aggregation, Alexa Fluor 488-conjugated CTx (10 μg/ml; Molecular Probes) was first applied to the cells for 30 min at 4 °C (40) and then washed in PBS containing 0.2% bovine serum albumin (blocking buffer). A goat anti-CTx antibody (Calbiochem) was then applied for 30 min at 4 °C, and cells were finally incubated for 15 min at 37 °C. After three washes in cold PBS containing 0.5% bovine serum albumin (w/v), cells were fixed in 4% paraformaldehyde for 10 min on ice, permeabilized with 0.15% Triton X-100, and labeled with the appropriate primary antibody (either anti-HA (clone 12G5), anti-Cav-3, or anti-CD46). Following extensive washing, cells were incubated with the appropriate Alexa Fluor 594-conjugated secondary antibody (Molecular Probes) to reveal these antigens. Coverslips were mounted using Mowiol (Hoechst). Confocal laser scanning microscopic analysis was performed on a Leica TCS SP1 confocal microscope, and co-localization was performed by overlaying the images using Leica confocal software (LCS; Leica Microsystems, Heidelberg, Germany). Excitation and emission filters for the different labeled dyes were as follows: YFP (green): λex = 488 nm, λem = 540/25 nm; Texas Red (red): λex = 568 nm, λem = 610/30 nm.
BRET Assay—The propensity of the signaling molecules to distribute into liquid-ordered microdomains was determined using bioluminescence resonance energy transfer (BRET). Cells were transiently transfected for 48 h with β2AR C-terminally fused to the Renilla luciferase (β2AR-Rluc), γ-aminobutyric acid receptor 1 (GBR1) C-terminally fused to RLuc in the presence of GBR2 to favor GBR1 plasma membrane expression (41), or an RLuc fusion of one of the component of the heterotrimeric G protein (Gγ2 (Gγ2-Rluc) in the presence of its partners, Gαs and Gβ1, as described previously (32)). On the day of the experiment, living cells expressing similar amount of RLuc were fluorescently labeled with increasing concentrations of DiIC16 or FastDiI (Molecular Probes) at 4 °C for 5 min as described previously (42) in order to mark liquid-ordered or disordered membrane regions, respectively. BRET measurements were monitored in PBS following the addition of Coelenterazine h (5 μm, NanoLight Technology) using a multi-well plate reader, Mithras LB 940 (Berthold), which allowed the sequential integration of signals detected in the 480 ± 20 and 530 ± 20 nm windows for donor (Rluc-fused proteins) and acceptor (DiIC16 or FastDiI) light emission, respectively. BRET signal was determined by calculating the ratio of the light intensity emitted by the acceptor over the light intensity emitted by the donor. Values were corrected by subtracting the background BRET signal detected when the Rluc-coupled protein was expressed alone. The amount of fluorescent lipid probes loaded into plasma membrane was evaluated by measuring total fluorescence using the Mithras plate reader with excitation and emission filters at 485 and 535 nm, respectively. Expression of the Rluc-fused proteins was evaluated by measuring the total luminescence in the Mithras plate reader 10 min after the addition of Coelenterazine h, with the reading taken in the absence of emission filter.
To monitor the association between β2AR and its signaling partners, protein-protein BRET assays were performed. Cells were transfected with β2AR-RLuc alone or in combination with either AC V-YFP or GFP2-Gαs (in the presence of Gβ and Gγ) for 24 h (32) and seeded in polylysine-pretreated 96-well white plates with opaque bottoms for an additional 24 h. Following cholesterol depletion or successive cholesterol depletion and cholesterol complementation, cells were washed once with PBS. For BRET measurements (between β2AR-Luc and adenylyl cyclase V-YFP), Coelenterazine h was added at a final concentration of 5 μm, and readings were taken as described above for the protein-lipid BRET assays. For BRET2 measurements (2, 32) (between β2AR-Luc and GFP2-Gαs), DeepBlueC coelenterazine (Biotium, Inc.) was added at a final concentration of 5 μm, and readings were taken using the Mithras plate reader that allows sequential integration of signals detected in the 400 ± 70- and 515 ± 20-nm windows.
Data Analysis—Data obtained in BRET and pharmacological assays were analyzed using Prism 3.0 software. Statistical significance of the differences between the different conditions were calculated using one-way analysis of variance with a Bonferroni post-test for p values less than 0.05.
RESULTS
Membrane Cholesterol Regulates Both β2AR Membrane Distribution and Its Signaling Efficacy—The widely used HEK293 cells, previously shown to recapitulate the observations made in native systems concerning the role of cholesterol and raft microdomains on the regulation of β2AR signaling efficacy (22, 25, 26, 28), were chosen as the cell model system used in the present study. In agreement with what was previously observed in cardiomyocytes, COS, A6, Madin-Darby canine kidney, and Chinese hamster ovary cells (22–26, 28), heterologously expressed (Fig. 1A) as well as endogenous (data not shown) β2AR, Gαs, and AC V/VI were found to co-distribute with two raft molecular markers, flotillin and GM1, in light density membrane obtained from cell fractionation based on a detergent-free sodium carbonate preparation. The presence of the receptor in the light density sucrose gradient fractions is consistent with the generally held notion that β2AR is localized in cholesterol-enriched domains. This would be further supported by the observation that treatments with a cholesterol-depleting agent, CD (or methyl-β-cyclodextrin, data not shown), which reduced the cholesterol/protein ratio by more than 50% (from 38 ± 2.3 to 17.3 ± 1.4 ng of cholesterol/μg of proteins) without affecting cell viability, diminished the amount of receptor in those fractions (Fig. 1B). However, heterogeneity of the membrane fragments recovered in these light density fractions (see below and Fig. 5) could allow alternative interpretations.
FIGURE 1.

Cholesterol influences the membrane distribution of the β2AR as well as its signaling efficacy in HEK293 cells. A, low density membranes of cells stably expressing β2AR (1 pmol/mg) were prepared following a sodium carbonate detergent-free method (Song method (37)) and the presence of β2AR, Gαs, AC V/VI, clathrin, flotillin-1, and GM1 was detected by Western blot with the appropriate antibodies. B, cells were treated (CD) or not (vehicle) with 2% CD for 1 h at 37 °C, and low density membranes were prepared as described in A. The relative amount of receptor in each of the fractions was evaluated by measuring specific binding of the [I125]CYP antagonist (250 pm). The bar graph represents the mean ± S.E. of three independent experiments performed in triplicate. C, HEK293 cells expressing the endogenous level of β2AR (right panel) or stably expressing β2AR (left panel) were cholesterol-depleted (CD, □) or not (Vehicle, ▪) with 2% CD. Following this first depletion, cells were cholesterol-reloaded by incubating them with CD-cholesterol complexes to reverse cholesterol depletion (complementation, ▪). AC activity was evaluated by measuring cAMP production when whole cellular membranes were incubated in the presence of increasing isoproterenol concentrations. The inset in the right panel represents an enlargement of the ordinate to help visualize the differences. Data presented in C represent the mean ± S.E. of four independent experiments performed in duplicate.
Cholesterol Influence on β2AR signaling efficacy was then assessed by measuring cAMP production following CD treatment. As shown in Fig. 1C and Table 1, CD treatment increased both the basal and maximal isoproterenol-stimulated cAMP production without affecting the potency of the agonist. Decreasing the cholesterol content using cholesterol oxidase led to a similar increase in β2AR signaling efficacy (Table 1). Those effects were reversed following cholesterol repletion, which brought the cholesterol/protein ratio back to 51.7 ± 11.1 ng/μg proteins, confirming that the effects resulted from alterations in membrane cholesterol concentration (Table 1). Although the isoproterenol-stimulated cAMP production was significantly lower in nontransfected HEK293 cells expressing endogenous levels of β2AR, similar effects of CD treatment were observed, indicating that the effect observed in the HEK293-β2AR cells was not a consequence of receptor overexpression (Fig. 1C, right panel).
TABLE 1.
Pharmacological parameters derived from AC activity assays carried out in HEK293 stably expressing or not β2AR and treated initially for depletion (CD or cholesterol oxidase (CX)) or repletion (CD+Chol) in membrane cholesterol Cyclase experiments were analyzed by nonlinear regression using the GraphPad-Prism program. Basal, maximal, and Log EC50 parameters were derived from curve fitting. Values represent the means ± S.E. of three independent experiments performed in duplicate.
|
Dose-response
treatmenta |
Parameters |
HEK293 |
HEK293 FLAG-β2AR |
||||||
|---|---|---|---|---|---|---|---|---|---|
| Vehicle | CD | CD+Chol | CX | Vehicle | CD | CD+Chol | CX | ||
| Isoproterenol | Basal | 21.1 ± 3.1 | 38.4 ± 4.4 | 27.3 ± 5.8 | 43.4 ± 6.1 | 39.5 ± 4.5 | 69.4 ± 12.1 | 29.2 ± 3.4 | 75 ± 6.5 |
| Maximal | 100.0 ± 5.0 | 155.0 ± 6.5 | 126.1 ± 7.7 | 166.5 ± 9.0 | 100.0 ± 3.5 | 152.8 ± 8.3 | 75.3 ± 2.4 | 165 ± 9 | |
| Log EC50 (m) | –6.2 ± 0.1 | –6.5 ± 0.1 | –6.47 ± 0.2 | –6.4 ± 0.15 | –7.65 ± 0.2 | –7.8 ± 0.3 | –7.8 ± 0.2 | –7.5 ± 0.2 | |
| Gpp(NH)p | Basal | 60.7 ± 5.4 | 75.1 ± 14.4 | ND | 80 ± 11 | 58.8 ± 8.0 | 71 ± 5.8 | ND | 80 ± 3.8 |
| Maximal | 99.8 ± 4.2 | 194.4 ± 25.3 | ND | 205 ± 12 | 99.9 ± 3.3 | 126.4 ± 3.7 | ND | 119.2 ± 2.1 | |
| Log EC50 (m) | –4.7 ± 0.2 | –4.2 ± 0.3 | ND | –4.5 ± 0.2 | –5.2 ± 0.3 | –4.9 ± 0.2 | ND | –5.0 ± 0.1 | |
% maximal effect in control
To determine the site within the β2AR/Gαs/AC signaling cascade that was sensitized by the cholesterol depletion, we investigated functional responses to the nonhydrolysable GTP analogue, Gpp(NH)p, or MnCl2, which directly activates the G protein and the adenylyl cyclase, respectively. As shown in Fig. 2A and Table 1, CD treatment significantly increased the maximal Gpp(NH)p-stimulated cAMP production, whereas it was without effect on the MnCl2-promoted response. Those results suggest that the impact of cholesterol takes place upstream of AC, most likely at the receptor and/or G protein levels but not directly on the AC or phosphodiesterase catalytic activity. The observation that CD treatment potentiated the forskolin-stimulated AC activity (Fig. 2A and Table 1) is consistent with this notion because forskolin activates AC in a G protein-dependent manner (43). The idea that the effect does not reflect a nonspecific amplification of the cAMP production is further supported by the observation that CD treatment did not potentiate isoproterenol- and Gpp(NH)p-stimulated AC activity to the same extent (Table 1). Indeed, the potentiation of the Gpp(NH)p response was ∼100% compared with only ∼50% for the isoproterenol-stimulated AC activity. The direct effect of cholesterol depletion on the β2AR signaling cascade is further supported by the observation that the relative CD-promoted potentiation of the isoproterenol and Gpp(NH)p responses was influenced by the β2AR expression level. In cells overexpressing β2AR, CD treatment had its dominant potentiating effect on the receptor-stimulated response (∼50%) rather than the G protein-stimulated response (∼25%). This clearly indicates a role for the β2AR-stimulated cascade in the observed effect of CD.
FIGURE 2.

Effects of cholesterol depletion on basal, isoproterenol-, forskolin-, Gpp(NH)p-, and MnCl2-stimulated AC activity. Cells stably expressing β2AR were treated (CD, □) or not (Vehicle, ▪) with 2% CD for 1 h at 37 °C to promote cholesterol depletion. A, an AC assay was performed on total cellular membranes in the presence or not (Basal) of 50 μm forskolin, 500 μm Gpp(NH)p, or 100 mm MnCl2 as indicated. B, the importance of β2AR/Gαi coupling on the impact of cholesterol depletion on β2AR signaling properties was assessed by treating the cells or not (Vehicle) with pertussis toxin (PTX) 16 h prior to the experiment. An AC assay was performed on cell membranes in the absence (Basal) or presence of 10 μm isoproterenol. All of the data shown represent the mean ± S.E. of three independent experiments carried out in triplicate and are expressed as a function of the maximal specific AC activity measured under vehicle conditions (without any depletion of the membrane) in each case.
As it has been proposed that cholesterol-enriched microdomains could promote coupling of β2AR to the inhibitory heterotrimeric G protein, Gi (24), we tested the potential role of Gi in the action of CD treatment. For this purpose, the effect of CD was assessed following Gi inactivation with pertussis toxin. As shown in Fig. 2B, pertussis toxin treatment did not affect the impact of CD treatment on either basal or isoproterenol-stimulated AC activity. Indeed, although treatment with pertussis toxin increased AC activity in both cases, the amplitude of the CD-promoted potentiation was similar to that observed under control conditions. These results indicate that the effect of cholesterol depletion on signaling efficacy did not result from a decreased β2AR/Gαi coupling.
Membrane Cholesterol-mediated Regulation of β2AR/G Protein Coupling—The fact that cholesterol appears to modulate the β2AR/Gαs/AC pathway at the level of the receptor and/or Gs led us to assess the influence of cholesterol on receptor/G protein coupling. To pharmacologically monitor this coupling, competition of the radioiodinated antagonist [125I]CYP binding with isoproterenol was performed on membranes derived from HEK293-β2AR, pretreated or not with CD or cholesterol oxidase. None of these cholesterol-depleting treatments had any effect on either the binding affinity or the Bmax of the antagonist [125I]CYP (Table 2). They led however to a rightward shift of the biphasic binding competition curve by isoproterenol (Fig. 3A and Table 3). Analysis revealed that CD-promoted cholesterol depletion induced a significant decrease in the apparent affinity of the receptor high affinity agonist binding state (Log IC50 for isoproterenol increased from -9.49 ± 0.29 to -7.80 ± 0.26; Table 3). This effect was reversible, as cholesterol reloading of the membranes almost completely restored the high affinity binding state to its control value (Table 3).
TABLE 2.
Binding parameters of [I125]cyanopindolol derived from saturation experiments carried out in membrane of HEK293 cells stably expressing β2AR and treated with different cholesterol-depleting agents Saturation experiments were analyzed by nonlinear regression using the GraphPad-Prism program. Bmax and Kd parameters were derived from the curve fitting. Values represent the means ± S.E. of four independent experiments performed in triplicate.
| Treatment | n | Bmax | Kd | R2 |
|---|---|---|---|---|
| pmol/mg | pm | |||
| Vehicle | 4 | 6.58 ± 0.46 | 32.59 ± 6.59 | 0.89 |
| CD | 4 | 6.84 ± 1.55 | 26.90 ± 5.95 | 0.93 |
| Cholesterol oxidase (1 unit/ml) | 4 | 6.54 ± 0.62 | 43.48 ± 10.47 | 0.93 |
FIGURE 3.
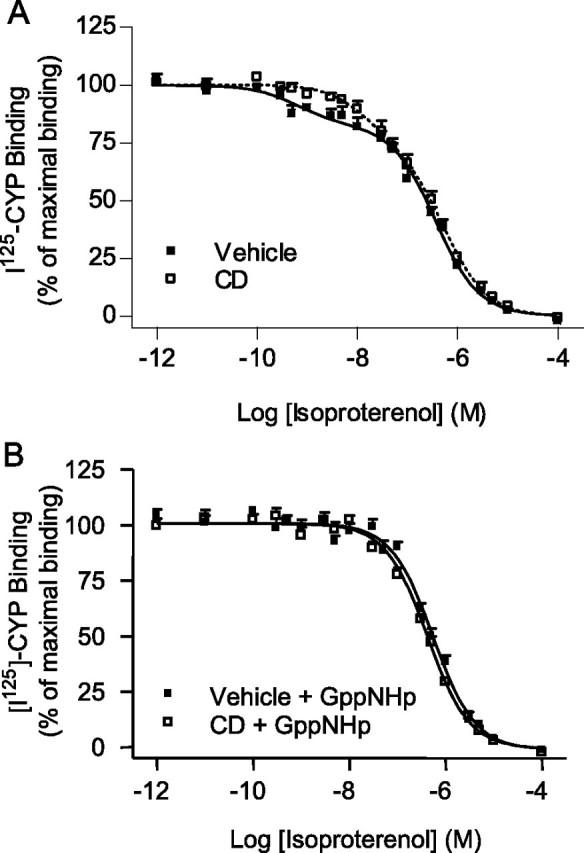
Effects of cholesterol depletion on β2AR high affinity binding state and coupling to G protein. Cells stably expressing β2AR (6.58 pmol.mg-1) were treated (CD, □) or not (Vehicle, ▪) with 2% CD for 1 h at 37 °C to promote cholesterol depletion. A, competition of [125I]CYP binding with increasing amounts of isoproterenol was then performed on total cellular membranes. B, binding competition experiments were performed in the presence of an excess of Gpp(NH)p. Data represent the mean ± S.E. of nine independent experiments (A) and three independent experiments (B), all carried out in triplicates. The binding parameters of these experiments are compiled in Table 2.
TABLE 3.
Binding parameters of isoproterenol derived from competition experiments against [I125]cyanopindolol carried out in HEK293 cells stably expressing β2AR and treated with different cholesterol-depleting agents Binding experiments were performed in the presence or absence of 250 μm Gpp(NH)p. Data were analyzed using GraphPad-Prism curve-fitting software and comparing the best fit values obtained using nonlinear regression for one versus two competition binding sites. Values represent the means ± S.E. of n independent experiments performed in triplicate. The p value (best fit probability value) and R2 (expressing the goodness of the fit) are also indicated.
| Treatment | n | Best fita | p value | Fraction Hb | Log[IC50H]c | Log[IC50L]d | R2 |
|---|---|---|---|---|---|---|---|
| % | |||||||
| Vehicle | 9 | 2 | P < 0.0001 | 19.2 ± 2.7 | –9.49 ± 0.29 | –6.72 ± 0.08 | 0.90 |
| CD | 9 | 2 | P < 0.0001 | 25.8 ± 6.4 | –7.80 ± 0.26 | –6.26 ± 0.09 | 0.95 |
| Cholesterol repletion | 2 | 2 | P < 0.0001 | 17.2 ± 3.1 | –9.35 ± 0.33 | –6.38 ± 0.07 | 0.94 |
| CXe (1 unit/ml) | 5 | 2 | P < 0.0001 | 22.4 ± 2.4 | –8.99 ± 0.19 | –6.54 ± 0.06 | 0.92 |
| CD KT5720 | 3 | 2 | p < 0.01 | 18.3 ± 5.7 | –9.2 ± 0.54 | –7 ± 0.12 | 0.94 |
| Vehicle + Gpp(NH)p | 3 | 1 | p > 0.05 | –6.26 ± 0.04 | 0.94 | ||
| CD + Gpp(NH)p | 3 | 1 | p > 0.05 | –6.38 ± 0.03 | 0.97 |
Indicates the best fit between one or two binding sites
Percentage of β2AR in high affinity binding state
IC50 of isoproterenol for high affinity binding state of β2AR
IC50 of isoproterenol for low affinity binding state of β2AR
CX, cholesterol oxidase
A loss in high affinity agonist binding is classically attributed to a reduction in the coupling of the receptor to its cognate G protein (44). Given the recent indications that a fraction of the receptor and G protein may be preassembled (2, 32), the high affinity agonist binding state most likely reflects both preexisting and agonist-induced engagement of the receptor and its cognate G protein. To determine whether the loss in agonist binding affinity promoted by CD resulted from such uncoupling or from a reduction of the intrinsic affinity of the receptor for isoproterenol, the effect of the cholesterol depletion was assessed following direct receptor uncoupling using Gpp(NH)p. As shown in Table 3 and Fig. 3B, CD did not further decrease the affinity of the β2AR for isoproterenol in the presence of Gpp(NH)p, indicating that cholesterol depletion affected β2AR ligand binding properties by uncoupling the receptor from its G protein. Confirming this hypothesis, cholesterol depletion treatment did not affect the high affinity binding site of the receptor when binding assays were carried out in cells expressing a receptor covalently linked to the Gαs subunit (β2AR-Gαs; supplemental Fig. S1).
Together, these results indicate that cholesterol controls β2AR signaling efficacy through a modulatory action involving the receptor/G protein and/or the G protein/adenylyl cyclase interactions but not the intrinsic activity of the adenylyl cyclase itself. The increase in receptor-stimulated cAMP production following CD treatment may, however, appear surprising, considering that cholesterol depletion led to an apparent uncoupling of the receptor from the G protein as indicated by the loss in agonist high affinity binding described above. A potential explanation for this apparent paradox could be that the increased basal cAMP production, resulting from the cholesterol depletion, leads to PKA-mediated receptor desensitization and attenuates β2AR/Gs coupling. Consistent with this notion, PKA-dependent phosphorylation of the β2AR has been shown previously to promote receptor uncoupling (30, 45, 46).
Influence of Cholesterol on β2AR/G Protein Coupling Is Mediated by PKA—To directly test whether the cAMP-dependent phosphorylation of the β2AR by PKA occurs upon cholesterol depletion, the phosphorylation state of the receptor was assessed using an anti-phosphoserine antibody directed against one of the β2AR PKA phosphorylation sites (39). As shown in Fig. 4A, CD treatment led to a notable increase in the receptor phosphorylation level. In contrast, no such CD-promoted phosphorylation was observed in a β2AR mutant lacking its two PKA phosphorylation sites (S261A, S262A, S345A, S346A; β2ARPKA-) (45, 46). We therefore examined the effect of cholesterol depletion on receptor/G protein coupling for both wild-type β2AR and β2ARPKA-. In contrast to the CD-promoted decrease in the high affinity agonist binding state observed for the wild-type β2AR, cholesterol depletion did not affect the agonist binding profile of β2ARPKA- (Fig. 4B and Table 3), consistent with a role for PKA-mediated phosphorylation in the uncoupling phenotype. A similar inhibition of the CD-promoted decrease in the high affinity agonist binding state was observed upon inhibition of PKA activity by KT5720 (Fig. 4B, right panel, and Table 3) confirming the role of this kinase in the phenomenon.
FIGURE 4.

Cholesterol depletion induces β2AR phosphorylation, which in turn is responsible for loss of high affinity binding state. A, nontransfected cells (Mock) as well as cells stably expressing 1–3 pmol.mg-1 of either β2ARWTorβ2ARPKA- were treated (CD) or not (-) with 2% CD for 1 h at 37 °C. Total membranes were solubilized, and the receptor phosphorylation state was assessed by Western blot analysis (IB) on 5 μg of protein using an antibody directed against phosphorylated Ser262 amino acid of the receptor. Upper panel, immunoblot using the anti-phospho-Ser262 antibody. Lower panel, immunoblot using an anti-β2AR antibody. Data are representative of five independent experiments. B, cells stably expressing 1–3 pmol.mg-1 of either β2ARWT (leftmost and rightmost panels) or β2ARPKA- (middle panel) were treated (CD, □) or not (vehicle, ▪) with 2% CD for 1 h at 37 °C to promote cholesterol depletion. Inhibition of PKA with 5 μm KT5720 was performed 2 h prior to depletion with CD (rightmost panel, ▪). [125I]CYP binding on total membranes was competed with increasing isoproterenol concentrations. Data represent the mean ± S.E. of three independent experiments carried out in triplicate. C, cells stably expressing equivalent amount (700 fmol.mg-1) of either β2ARWT (▪/□) or β2ARPKA- (•/○) were cholesterol-depleted (empty symbols) or not (filled symbols) with 2% CD for 1 h at 37 °C. An adenylyl cyclase assay was then performed in the presence of increasing concentrations of isoproterenol. D, cAMP production was measured in the presence of Gpp(NH)p (0.5 mm). The data shown in C and D represent the mean ± S.E. of three independent experiments carried out in triplicate.
In agreement with the notion that cholesterol depletion leads to a PKA-promoted desensitization of the receptor, the CD-dependent potentiation of β2AR-stimulated AC activity was found to be greater in cells expressing β2ARPKA- than in those expressing an identical number of wild-type receptor (Fig. 4C). This greater cAMP response was receptor-specific, as CD treatment led to identical increase in Gpp(NH)p-stimulated cAMP production in both β2ARPKA- and β2ARWT-expressing cells (Fig. 4D).
Altogether, these results suggest a model whereby cholesterol depletion increases β2AR signaling efficacy downstream of the receptor and results in a higher cAMP production. This elevation of cAMP concentration in turn promotes the phosphorylation and uncoupling of the receptor, leading to a partial desensitization that does not completely overcome the potentiating effect of cholesterol depletion. Although these results provide a reasonable explanation for the decrease in the high affinity agonist binding state in the face of an increased signaling efficacy, they do not provide a mechanistic explanation for the potentiating effect of cholesterol depletion. In fact, one could expect that co-localization of signaling partners within cholesterol-enriched fractions may favor signaling efficacy rather than inhibit it, as suggested by the potentiating effect of the cholesterol depletion. Because of the apparent paradox between the potentiating effect of cholesterol depletion and the proposed co-localization of β2AR, Gαs, and AC V/VI, the submembrane localization of the three signaling partners was reassessed using alternative approaches.
Membrane Partition Properties of β2AR Differ from Those of Its Signaling Partners—Light density membrane fractions such as those obtained using the sodium carbonate procedure (37) most likely correspond to a mixed population of both raft and non-raft domains, which may display distinct biophysical properties (18, 47). This heterogeneity is illustrated in Fig. 5A (left panel) by the detection, in light density fractions, of two classically raft-excluded proteins, the transferrin receptor and CD46 (40, 48–50). It follows that the presence of β2AR, Gαs, and AC V/VI in light density fractions could result from the embedment of these proteins in distinct membrane domains.
To test this hypothesis, we assessed the resistance of membrane distribution of those three signaling partners to a nonionic detergent solubilization (51) following sedimentation of the low density membranes isolated via the sodium carbonate method. As shown in Fig. 5A (right panel), β2AR, as well as CD46 and transferrin receptor, appears to be solubilized largely in the presence of 1% Triton X-100, leading to their exclusion from DRM fractions classically associated with cholesterol-rich raft nanodomains. In contrast, a significant proportion of Gαs and AC V/VI remained in DRM fractions along with two canonical raft markers, flotillin-1 and GM1. Similar results were obtained when whole cells were directly solubilized with 1% Triton X-100 (Fig. 5B, left panel).
Several studies suggest that the level of order acquired by raft lipid components may vary concentrically around the core and correlate with their resistance to non-ionic detergents (52, 53). To determine whether β2AR sensitivity to Triton X-100 solubilization results from its partition in raft peripheral region, we compared β2AR, AC V/VI, and Gαs sucrose gradient distribution following less stringent solubilization with 0.1% Triton X-100. Lowering the detergent concentration increased, as expected, the proportion of Gαs and AC V/VI recovered in DRM, whereas the distribution of β2AR remained identical to that observed using 1% Triton X-100 (Fig. 5B), confirming the weak propensity of β2AR to be distributed in detergent-resistant membranes. These results, therefore, suggests that a β2AR-surrounding lipid environment displays biophysical properties differing from that containing an important population of Gαs and/or AC V/VI proteins.
To further probe the distinct biophysical properties of β2AR-embedded membrane domains and those of its signaling partners, we used another detergent-free method. Using the method developed by MacDonald and Pike (38), we found that β2AR and Gαs are considerably enriched in light density fractions, whereas the bulk of AC V/VI is found in heavy density fractions. A comparison of the results obtained with those three different microdomain preparations (carbonate calcium (37), MacDonald (38), or DRM methods) revealed that fractionation profiles of β2AR, Gαs, and AC V/VI are highly dependent on the methods used (Fig. 5C). Interestingly, each method leads to the identification of a couple of partners co-distributing together in light density membrane fractions, which differs from the one identified by the two other methods. These data therefore support the notion that each of these three signaling partners has a unique biophysical partition signature, which may reflect the specificity of their immediate membrane environment and the fact that the fractionation method identifies components that share specific biophysical properties but do not necessarily reside in the same nanodomain in situ. This does not exclude the possibility that fractions of the receptor and its effectors may reside in the same nanodomains. For instance, receptor and Gs molecules engaged in preassembled β2AR/Gs complexes ought to be within the same nanodomains.
Given the complexity of the membrane fractionation analysis, it is difficult to determine with certainty whether β2AR is present within cholesterol-enriched raft nanodomains. To address this question, we assessed the nature of the β2AR membrane environment by two additional independent methods that are based on different principles but assess the localization of proteins in situ. First, the cellular distribution of the receptor was assessed by microscopy following GM1-CTx-induced patching of the rafts (40). Second, β2AR membrane distribution was monitored using a newly developed protein-lipid BRET assay performed in living cells. Confocal immunofluorescence microscopy (Fig. 6) revealed that the co-localization between GM1 and β2AR was much weaker than that observed between GM1 and heterologously expressed Cav-3. However, some co-localization could be seen between GM1 and β2AR, suggesting proximity between some of the receptors and the aggregated GM1-containing nanodomains. Although this is not a proof of inclusion of β2AR in caveolae-like structures, the receptor may be present in the vicinity of aggregated nanodomains. Because confocal microscopy does not have the resolution needed to reach a definitive conclusion on the presence or absence of β2AR within native raft nanodomains, the ability of β2AR to partition into liquid ordered regions of the membrane was thus directly probed by monitoring BRET between the Renilla luciferase fused to the C terminus of the receptor (receptor C-terminally fused to β2AR-Rluc, used as the energy donor), and fluorescently labeled lipids distributing in the ordered (DiIC16) or disordered (FastDiI) phase of the membrane (42, 54–57). Similar to fluorescence resonance energy transfer (FRET), BRET typically occurs over distances of less than 10 nm. It follows that BRET signals observed for the different acceptor/donor ratios will reflect the propensity of the receptor to distribute into lipid domains of distinct natures. We thus compared BRET signals obtained with β2AR-RLuc with that of GBR1, a receptor displaying the same seven-transmembrane domain topology but that is known to be highly enriched in DRM (58). As shown in Fig. 7A, for comparable amounts of receptors (as assessed by the amount of luminescence detected for cells transfected with GBR1-RLuc or β2AR-RLuc) and a given concentration of FastDiI fluorescent probe, the BRET signals detected were very similar. In contrast, the BRET signal observed between GBR1-RLuc and DiIC16 was much larger than in the case of the β2AR-RLuc (Fig. 7B). The difference in BRET signals observed with GBR1 and β2AR did not result from distinct energy acceptor/donor ratios, as it was seen for all ratios tested (Fig. 7, right panels). Interestingly, BRET signals measured between GBR1-RLuc and FastDiI or DiIC16 lipid probes evolved hyperbolically with the acceptor/donor ratio. In contrast, when considering β2AR-RLuc, only the BRET obtained with FastDiI followed such a hyperbolic function, whereas the weak BRET detected with DiIC16 increased linearly with the acceptor/donor ratio. This linear BRET augmentation results most likely from random collision between β2AR-RLuc and DiIC16, whereas the hyperbolic increase between GBR1-RLuc and DiL16 reflects the propensity of this receptor to partition in liquid-ordered regions of the membrane. Thus, as already suggested by the sensitivity of the β2AR to Triton X-100 solubilization (Fig. 5) and its exclusion from GM1-containing membrane domains (Fig. 6), the BRET data indicate that β2AR is excluded from DilC16-containing liquid-ordered environments and most likely from raft nanodomains.
FIGURE 6.

Analysis of β2AR submembrane localization by confocal microscopy. Cells stably expressing β2AR were transiently transfected with Cav-3, and the co-localization of β2AR or Cav-3 with cholera toxin-induced clusters of GM1-containing microdomains was evaluated by confocal microscopy.
FIGURE 7.

Monitoring of β2AR membrane distribution in living cells by BRET. Live cells transiently expressing β2AR-RLuc, GBR1-RLuc/GBR2, or Gγ2-RLuc/Gαs/Gβ1 were labeled with DiIC16 or FastDiI for 5 min. The BRET between each of the luciferase-fused proteins and FastDiI (A) or DiIC16 (B) was monitored. In each case, the bar graph (left panels) represents a comparison of the BRET measured when equivalent amount of β2AR, GBR1-RLuc, or Gγ2-RLuc and similar total levels of fluorescent acceptor (FastDiI or DiIC16) were present. BRET saturation curves (right panels) were obtained by plotting the net BRET as a function of the [acceptor]/[donor] ratio. Data represent the mean ± S.E. of three independent experiments performed in duplicate.
The usefulness of the BRET method in assessing the propensity of a protein to partition in liquid-ordered domains of the membrane was confirmed by the observation that the Gγ subunit, already shown to be resistant to Triton X-100 extraction (59, 60), led to a sizable BRET signal with both FastDiI (Fig. 7A) and DiIC16 (Fig. 7B) when fused at its N terminus with RLuc and expressed in the presence of Gαs and Gβ subunits (32). This also confirms that a fraction of the G protein is localized into an ordered lipid environment from which the receptor appears to be excluded. Because DilC16 may not label all liquid-ordered nanodomains, our BRET data did not permit us to exclude the presence of β2AR in some nanodomains, but they clearly indicate that the receptor displays a membrane distribution distinct from Gs.
Taken together, biochemical (Fig. 5) and BRET (Fig. 7) analyses are consistent with the notion that a fraction of Gs and AC is segregated away from the receptor in raft nanodomains, whereas another fraction of these effectors (including preassembled β2AR/Gs complexes) co-localizes with the receptor outside of these raft nanodomains.
Cholesterol Restrains the Probability of Interaction between β2AR and Its Signaling Partners—Taken together, the results presented so far suggest that, in contrast to the β2AR, a significant fraction of its signaling partners (Gαs and AC V/VI) are embedded in liquid-ordered nanodomains of the membrane. It follows that the increased signaling efficacy observed upon cholesterol depletion could result from novel productive interactions occurring between the receptor and a population of Gαs and AC that are raft-embedded under basal conditions. Consistent with this notion, we observed that CD-promoted cholesterol depletion led to a reversible release of AC V/VI, Gαs, and GM1 from the DRMs into higher density fractions, which resulted in their complete co-distribution with β2AR (Fig. 8A). To directly test whether this CD-promoted increase in co-fractionation does indeed result in enhanced interaction between the receptor and its signaling partners in native plasma membrane, we again took advantage of the BRET method to monitor agonist-promoted interactions between β2AR-RLuc and GFP2-Gαs or AC V-YFP (2, 3, 32) upon cholesterol depletion. As shown in Fig. 8B, CD treatment promoted a significant increase in agonist-promoted BRET between receptor and Gαs or AC V, consistent with the notion that cholesterol depletion favors interaction between the partners. Although the basal signal detected between the β2AR-RLuc and AC V-YFP was increased following cholesterol depletion, the slight increase monitored between β2AR-RLuc and GFP-Gαs did not reach statistical significance. The influence of cholesterol depletion on the BRET values did not result from a nonspecific effect of the treatments, as CD was without effect on the BRET observed between β2AR-Rluc and β2AR-YFP (data not shown). Treatment with isoproterenol did not change the distribution of β2AR in sucrose gradient following Triton X-100 solubilization but slightly reduced the proportion of Gαs found in light density fractions (supplemental Fig. S2). This may indicate that the equilibrium between raft and non-raft nanodomain-localized G proteins can be affected by the activated receptor present outside of these rafts.
β2AR Signaling Efficacy Is Determined by Its Lateral Separation from Gs and AC V/VI Proteins—To directly test the hypothesis that signaling efficacy can be controlled by lateral entrapment of a fraction of Gαs and AC in raft nanodomains away from the receptor, we assessed the influence of the raft scaffolding protein, Cav-3, on the membrane distribution of the signaling partners as well as on β2AR coupling and signaling efficacies. As shown in Fig. 9A, Cav-3 overexpression increased the proportion of Gαs and AC V/VI recovered in DRM fractions without influencing the membrane distribution of the β2AR. This redistribution of Gαs and AC V/VI away from β2AR led to a correspondent decrease in the receptor-stimulated AC activity (Fig. 9C). Such reduction in the agonist-promoted AC activity was accompanied by an increase in the high affinity state of the receptor for isoproterenol (Fig. 9B), most likely reflecting a reduced constitutive desensitization of the receptor (Fig. 3). These results therefore suggest that the Cav-3-promoted increase in the proportion of Gs and AC in liquid-ordered nanodomains restricts the number of effectors available for receptor productive interactions; hence the reduced cAMP production and ensuing diminished desensitization. However, Cav-3 overexpression was without effect on the intrinsic AC activity as assessed by MnCl2 stimulation on AC (Fig. 9D). Those functional effects observed following Cav-3 overexpression most likely reflect the influence of this protein on the dynamic organization of raft nanodomains and may be related to its potential impact on the membrane cholesterol concentration (61–64). Indeed, similar results were observed when membrane cholesterol concentration was artificially increased following a treatment using a CD and cholesterol mixture (data not shown) without prior cholesterol depletion.
DISCUSSION
The influence of cholesterol manipulation on the signaling properties of β2AR led us to assess the biophysical properties of the membrane environment surrounding the receptor and its effectors. The comparison of three independent light density membrane preparations, believed to represent lipid raft domains, showed that the relative enrichment of β2AR, Gαs, and AC V/VI in these fractions was highly dependent on the technique used. Given that each of these techniques may select distinct pools of membranes fragments with heterogeneous lipid composition (18, 47), the different results obtained by the three techniques suggest that, individually, they do not have the resolution power that would allow attribution of specific lipid domain environments to the β2AR signaling components.
By providing access to a higher level of resolution, which may reflect more faithfully the molecular organization of the protein complexes within native membranes, protein-lipid and protein-protein BRET assays allowed us to clearly establish that, whereas the β2AR was largely excluded from liquid-ordered lipid nanodomains, a pool of G proteins and AC V were sequestered within these domains. Such a distribution is consistent with the fact that Gαs and AC V/VI showed high affinity for liquid-ordered lipid phases, as indicated by their resistance to Triton X-100 solubilization, whereas the β2AR was readily solubilized even by low non-ionic detergent concentration. The exclusion of β2AR from the liquid-ordered lipid rafts is also supported by the lack of β2AR co-localization with aggregated GM1-containing rafts observed under confocal immunofluorescence microscopy.
The idea that a pool of Gs and AC found in the liquid-ordered lipid phase is sequestered away from the β2AR is consistent with the observation that cholesterol depletion led to increased agonist-promoted molecular collisions between the receptor and its partners (illustrated by BRET), which resulted into an increase in receptor-mediated cAMP production.
In agreement with previous studies (25, 26, 28), we observed that cholesterol depletion increased the efficacy but not the potency of the receptor-stimulated AC activity. Such behavior has been predicted to occur following increased availability of G protein when considering either receptor/G protein or G protein/AC collisional coupling or precoupled models (65, 66). An increase in basal and β2AR-stimulated cAMP production efficacy, with no effect on the potency, has also been reported following overexpression of AC V or VI in mice and rats cardiac cells (67–69). Therefore, an increase in the available pools of AC V/VI and/or Gαs for the β2AR is most likely responsible for the observed increase in basal and isoproterenol-stimulated cAMP production following cholesterol depletion-mediated rafts disruption.
An intriguing and apparently paradoxical observation of the present study is that the increase in β2AR signaling efficacy promoted by cholesterol depletion is accompanied by a reduction in the high affinity state of the receptor for its agonist, isoproterenol. Indeed, loss of the high affinity state for agonists is classically viewed as an index of receptor/G protein uncoupling, which should lead to a reduced and not an increased signaling efficacy (44). However, increased signaling activity and receptor desensitization are phenomena that are intrinsically linked to one another, with the latter often resulting from the former. In fact, our data indicate that the loss of high affinity agonist binding is the consequence of the elevated signaling efficacy leading to PKA-dependent receptor desensitization. This hypothesis is supported by the observation that treatment with CD led to an increased PKA-dependent phosphorylation of β2AR and that mutation of all PKA phosphorylation consensus sites (β2ARPKA-)completely blocked the loss of agonist high affinity binding sites. The occurrence of a partial desensitization of the receptor-stimulated AC activity following cholesterol depletion is further supported by the greater CD-promoted increase in AC activity observed in cells expressing the desensitization-resistant β2ARPKA-. This indicates that the increased signaling efficacy observed for β2ARWT is attenuated by the constitutive desensitization process.
For other receptors, cholesterol actions have been attributed to its direct allosteric effects on G protein-coupled receptor conformation as reflected by changes in the receptor high affinity agonist binding, irrespective of the G protein coupling state (70–75). Such direct cholesterol action on the receptor cannot account for the effects observed in the present study because the influence of cholesterol depletion on the high affinity agonist binding was entirely dependent on G protein coupling, as illustrated by its sensitivity to Gpp(NH)p and the lack of effect on the β2ARPKA-.
Altogether, our results suggest a model whereby CD induces the release of raft embedded pool of AC and Gαs that become available to engage the receptor, despite the recently suggested effect of cyclodextrin on the global viscosity of the membrane (76). Therefore, our results indicate that the increased availability of effector pools resulting from nanodomain disruption overcomes the influence that increased viscosity could have on partner collision.
Our results are consistent with the model proposing that CD treatment, which releases Gs and/or AC from raft nanodomains, increases the probability of interaction between receptor and G protein leading to an increased signaling that is partially blunted by the ensuing receptor desensitization. Thus, the decreased affinity of the receptor for the G protein resulting from phosphorylation and desensitization is overcome by the increased amount of G protein available for interaction.
Ianoul et al. (6) recently showed that β2AR clusters into 140-nm-size structures, proposed to represent embedded receptors into large signaling platforms often called signalosomes, where β2AR, Gs, and AC may be co-localized (22, 23). For their part, nanodomains such as rafts have been proposed to have a diameter of 5–10 nm (16). Signaling platforms may thus be composed of many of those liquid-ordered lipid nanodomains, which would allow for lateral sequestration of AC and Gs pools away from the receptor within the larger platform. Thus, although the overall structure of those signalosomes may be independent of the presence of nanodomains in the membrane, as has been proposed for the T cell signaling platforms (4, 11), nanodomains may be important in regulating the intrinsic activity of those signaling clusters. Because of its nanometric scale resolution (≤10 nm), the use of BRET allowed us to monitor the lipid environment of the partners and their molecular association, unveiling not only the existence of lateral sequestration at the raft nanodomain scale but also their functional consequences. We thus propose a model whereby nanolateral sequestration “tones down” the basal signaling noise that would result from random collision within signalosomes, which in part would favor optimal signaling efficacy and responsiveness upon agonist stimulation.
This idea could be reconciled with the G protein-coupled receptor precoupling model (2, 32, 77–79) in that the fraction of β2AR precoupled to Gs is excluded from nanodomains. Release of Gs and AC from raft nanodomains following CD treatment would increase the available pool of effectors for engagement by the receptor (Fig. 10). The extent of lateral sequestration within the liquid-ordered lipid phase would hence determine the responsiveness of the system. This is consistent with the observation that both direct membrane cholesterol loading and caveolin overexpression lead to dampening of signaling efficacy, most likely by stabilizing the liquid-ordered phase and increasing the proportion of sequestered effectors. Caveolin could play this role through its cholesterol transporting activity (61–64). However, this does not exclude the previously suggested possibility that caveolin may also dampen signaling efficacy through a direct inhibitory interaction between caveolin and cyclase (22).
FIGURE 10.
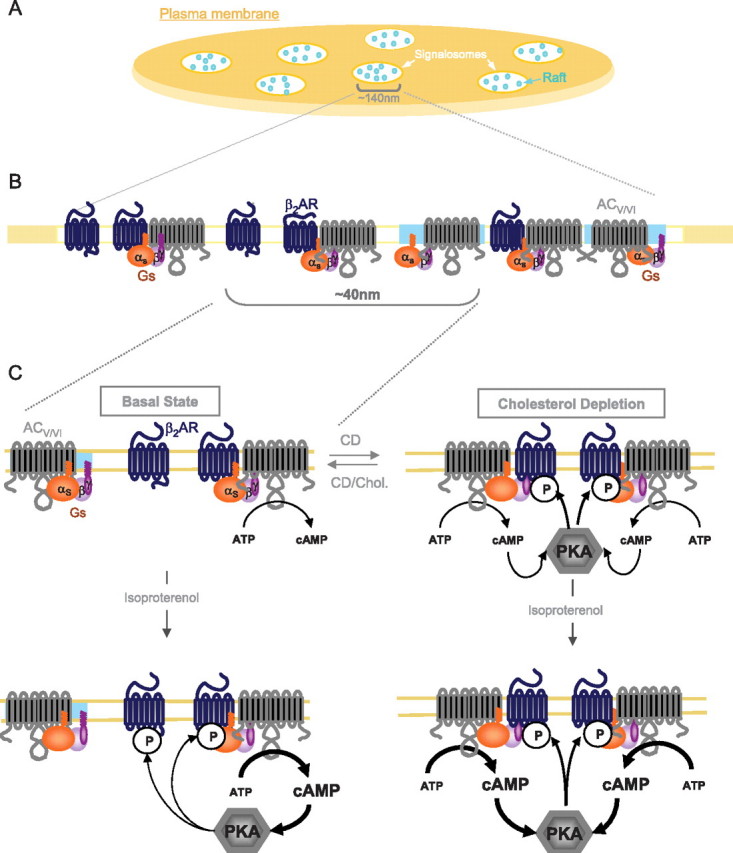
Nanoscale organization of β2AR signal transduction within the signalosome. A, schematic representation of a plasma membrane region. Signaling clusters/signalosomes (in white) and rafts nanodomains (in turquoise) are illustrated. B, magnification of a β2AR-enriched signaling cluster (as proposed by Ianoul et al. (6)) embedding cholesterol-driven liquid-ordered lipid nanodomains. The illustration shows the receptor being excluded from these nanodomains while Gs and AC V/VI partition in both raft and non-raft regions of the signaling cluster. C, model for the cholesterol-dependent regulation of β2AR signaling efficacy. Following cholesterol depletion, rafts are disrupted, leading to the release of a sequestered pool of AC V/VI and Gs, which become available for β2AR engagement. This increases the probability of productive interaction, leading to both elevated signaling efficacy and cAMP production. This augmentation in cAMP production promotes PKA-dependent phosphorylation of the β2AR, which in turn provokes β2AR desensitization and functional uncoupling from Gs.
A model reconciling our data with already published observations indicating that β2AR is present in caveolin-containing signaling platforms (∼140 nm) found in cells such as cardiomyocytes (6, 22, 23) is presented in Fig. 10. Signaling platforms may embed several nanodomains (∼10 nm) with distinct biophysical properties that can separate fractions of the different signaling partners so as to regulate the signaling efficacy within the signalosome.
Independently of the global model considered, our data clearly show that isolation of the β2AR from liquid-ordered lipid nanodomains, where a fraction of its key effectors are located, limits β2AR signaling and explains the cholesterol-mediated inhibition of this receptor. Although we cannot preclude the possibility that some β2AR may occupy caveolar environments in some model systems (6, 24), the consistency with which raft disruption via cholesterol depletion activates β2AR signaling (22–25) and cholesterol supplementation inhibits (26–28) receptor activity strongly argue that nanoscale receptor isolation is a general characteristic of β2AR signaling.
Supplementary Material
Acknowledgments
We thank Stephano Marullo, Roger G. Parton, and Zvi Voegel for providing FLAG-β2ARWT, Cav-3, and AC V-YFP expression vectors, respectively. We are also thankful to Graciela Pineyro for insightful discussions and to Monique Lagacé for careful reading and comments on the manuscript as well as constant intellectual support.
This work was supported by grants from the Canadian Institute for Health Research (CIHR) and the Heart and Stroke Foundation of Canada (to M. B.). The costs of publication of this article were defrayed in part by the payment of page charges. This article must therefore be hereby marked “advertisement” in accordance with 18 U.S.C. Section 1734 solely to indicate this fact.
The on-line version of this article (available at http://www.jbc.org) contains supplemental Figs. S1 and S2.
Footnotes
The abbreviations used are:β2AR,β2 adrenergic receptor; AC, adenylyl cyclase; BRET, bioluminescence resonance energy transfer; Cav, caveolin; CD, 2-hydroxypropyl-β-cyclodextrin; CTx, cholera toxin; CYP, cyanopindolol; DRM, detergent-resistant membrane; GBR, γ-aminobutyric acid receptor; GFP, green fluorescent protein; GM1, monosialotetrahexosylganglioside; Gpp(NH)p, guanosine 5′-(β,γ-imido)triphosphate; HA, hemagglutinin; HEK, human embryonic kidney; MES, 4-morpholineethanesulfonic acid; PBS, phosphate-buffered saline; PKA, protein kinase A; Rluc, Renilla luciferase; YFP, yellow fluorescent protein; WT, wild type.
References
- 1.Bouvier, M. (2001) Nat. Rev. Neurosci. 2 274-286 [DOI] [PubMed] [Google Scholar]
- 2.Gales, C., Van Durm, J. J., Schaak, S., Pontier, S., Percherancier, Y., Audet, M., Paris, H., and Bouvier, M. (2006) Nat. Struct. Mol. Biol. 13 778-786 [DOI] [PubMed] [Google Scholar]
- 3.Rebois, R. V., Robitaille, M., Gales, C., Dupre, D. J., Baragli, A., Trieu, P., Ethier, N., Bouvier, M., and Hebert, T. E. (2006) J. Cell Sci. 119 2807-2818 [DOI] [PubMed] [Google Scholar]
- 4.Douglass, A. D., and Vale, R. D. (2005) Cell 121 937-950 [DOI] [PMC free article] [PubMed] [Google Scholar]
- 5.Krawczyk, C., Bachmaier, K., Sasaki, T., Jones, R. G., Snapper, S. B., Bouchard, D., Kozieradzki, I., Ohashi, P. S., Alt, F. W., and Penninger, J. M. (2000) Immunity 13 463-473 [DOI] [PubMed] [Google Scholar]
- 6.Ianoul, A., Grant, D. D., Rouleau, Y., Bani-Yaghoub, M., Johnston, L. J., and Pezacki, J. P. (2005) Nat. Chem. Biol. 1 196-202 [DOI] [PubMed] [Google Scholar]
- 7.Dupre, D. J., Robitaille, M., Ethier, N., Villeneuve, L. R., Mamarbachi, A. M., and Hebert, T. E. (2006) J. Biol. Chem. 281 34561-34573 [DOI] [PubMed] [Google Scholar]
- 8.Balijepalli, R. C., Foell, J. D., Hall, D. D., Hell, J. W., and Kamp, T. J. (2006) Proc. Natl. Acad. Sci. U. S. A. 103 7500-7505 [DOI] [PMC free article] [PubMed] [Google Scholar]
- 9.Dupre, D. J., Baragli, A., Rebois, R. V., Ethier, N., and Hebert, T. E. (2007) Cell. Signal. 19 481-489 [DOI] [PubMed] [Google Scholar]
- 10.Fotiadis, D., Liang, Y., Filipek, S., Saperstein, D. A., Engel, A., and Palczewski, K. (2003) Nature 421 127-128 [DOI] [PubMed] [Google Scholar]
- 11.Glebov, O. O., and Nichols, B. J. (2004) Nat. Cell Biol. 6 238-243 [DOI] [PubMed] [Google Scholar]
- 12.Salahpour, A., Angers, S., Mercier, J. F., Lagace, M., Marullo, S., and Bouvier, M. (2004) J. Biol. Chem. 279 33390-33397 [DOI] [PubMed] [Google Scholar]
- 13.Neubig, R. R. (1994) FASEB J. 8 939-946 [DOI] [PubMed] [Google Scholar]
- 14.Ostrom, R. S., Post, S. R., and Insel, P. A. (2000) J. Pharmacol. Exp. Ther. 294 407-412 [PubMed] [Google Scholar]
- 15.Harder, T., and Simons, K. (1997) Curr. Opin. Cell Biol. 9 534-542 [DOI] [PubMed] [Google Scholar]
- 16.Sharma, P., Varma, R., Sarasij, R. C., Ira, Gousset, K., Krishnamoorthy, G., Rao, M., and Mayor, S. (2004) Cell 116 577-589 [DOI] [PubMed] [Google Scholar]
- 17.Kenworthy, A. K., and Edidin, M. (1998) J. Cell Biol. 142 69-84 [DOI] [PMC free article] [PubMed] [Google Scholar]
- 18.Mayor, S., and Rao, M. (2004) Traffic 5 231-240 [DOI] [PubMed] [Google Scholar]
- 19.Brown, D. A., and London, E. (1998) Annu. Rev. Cell Dev. Biol. 14 111-136 [DOI] [PubMed] [Google Scholar]
- 20.Hao, M., Mukherjee, S., and Maxfield, F. R. (2001) Proc. Natl. Acad. Sci. U. S. A. 98 13072-13077 [DOI] [PMC free article] [PubMed] [Google Scholar]
- 21.Caron, M. G., Hnatowich, M., Dohlman, H. G., Bouvier, M., Benovic, J. L., O'Dowd, B. F., Kobilka, B. K., Hausdorff, W. P., and Lefkowitz, R. J. (1990) in G Proteins (Iyengar, R., and Birnbaumer, L., eds) pp. 295-315, Academic Press, Orlando, FL
- 22.Rybin, V. O., Xu, X., Lisanti, M. P., and Steinberg, S. F. (2000) J. Biol. Chem. 275 41447-41457 [DOI] [PubMed] [Google Scholar]
- 23.Ostrom, R. S., Gregorian, C., Drenan, R. M., Xiang, Y., Regan, J. W., and Insel, P. A. (2001) J. Biol. Chem. 276 42063-42069 [DOI] [PubMed] [Google Scholar]
- 24.Xiang, Y., Rybin, V. O., Steinberg, S. F., and Kobilka, B. (2002) J. Biol. Chem. 277 34280-34286 [DOI] [PubMed] [Google Scholar]
- 25.Miura, Y., Hanada, K., and Jones, T. L. (2001) Biochemistry 40 15418-15423 [DOI] [PubMed] [Google Scholar]
- 26.Scarpace, P. J., O'Connor, S. W., and Abrass, I. B. (1985) Biochim. Biophys. Acta 845 520-525 [DOI] [PubMed] [Google Scholar]
- 27.O'Connor, S. W., Scarpace, P. J., and Abrass, I. B. (1984) Biochim. Biophys. Acta 778 497-502 [DOI] [PubMed] [Google Scholar]
- 28.Prieto, J. C., Hueso, C., and Carmena, M. J. (1990) Gen. Pharmacol. 21 931-933 [DOI] [PubMed] [Google Scholar]
- 29.Lavoie, C., Mercier, J. F., Salahpour, A., Umapathy, D., Breit, A., Villeneuve, L. R., Zhu, W. Z., Xiao, R. P., Lakatta, E. G., Bouvier, M., and Hebert, T. E. (2002) J. Biol. Chem. 277 35402-35410 [DOI] [PubMed] [Google Scholar]
- 30.Bouvier, M., Guilbault, N., and Bonin, H. (1991) FEBS Lett. 279 243-248 [DOI] [PubMed] [Google Scholar]
- 31.Mercier, J. F., Salahpour, A., Angers, S., Breit, A., and Bouvier, M. (2002) J. Biol. Chem. 277 44925-44931 [DOI] [PubMed] [Google Scholar]
- 32.Gales, C., Rebois, R. V., Hogue, M., Trieu, P., Breit, A., Hebert, T. E., and Bouvier, M. (2005) Nat. Meth. 2 177-184 [DOI] [PubMed] [Google Scholar]
- 33.Percherancier, Y., Lagane, B., Planchenault, T., Staropoli, I., Altmeyer, R., Virelizier, J. L., Arenzana-Seisdedos, F., Hoessli, D. C., and Bachelerie, F. (2003) J. Biol. Chem. 278 3153-3161 [DOI] [PubMed] [Google Scholar]
- 34.Bradford, M. M. (1976) Anal. Biochem. 72 248-254 [DOI] [PubMed] [Google Scholar]
- 35.Chidiac, P., Nouet, S., and Bouvier, M. (1996) Mol. Pharmacol. 50 662-669 [PubMed] [Google Scholar]
- 36.Salomon, Y., Londos, C., and Rodbell, M. (1974) Anal. Biochem. 58 541-548 [DOI] [PubMed] [Google Scholar]
- 37.Song, S. K., Li, S., Okamoto, T., Quilliam, L. A., Sargiacomo, and Lisanti, M. P. (1996) J. Biol. Chem. 271 9690-9697 [DOI] [PubMed] [Google Scholar]
- 38.MacDonald, J. L., and Pike, L. J. (2005) J. Lipid Res. 46 1061-1067 [DOI] [PubMed] [Google Scholar]
- 39.Tran, T. M., Friedman, J., Qunaibi, E., Baameur, F., Moore, R. H., and Clark, R. B. (2004) Mol. Pharmacol. 65 196-206 [DOI] [PubMed] [Google Scholar]
- 40.Harder, T., Scheiffele, P., Verkade, P., and Simons, K. (1998) J. Cell Biol. 141 929-942 [DOI] [PMC free article] [PubMed] [Google Scholar]
- 41.White, J. H., Wise, A., Main, M. J., Green, A., Fraser, N. J., Disney, G. H., Barnes, A. A., Emson, P., Foord, S. M., and Marshall, F. H. (1998) Nature 396 679-682 [DOI] [PubMed] [Google Scholar]
- 42.Jiao, X., Zhang, N., Xu, X., Oppenheim, J. J., and Jin, T. (2005) Mol. Cell. Biol. 25 5752-5762 [DOI] [PMC free article] [PubMed] [Google Scholar]
- 43.Alousi, A. A., Jasper, J. R., Insel, P. A., and Motulsky, H. J. (1991) FASEB J. 5 2300-2303 [DOI] [PubMed] [Google Scholar]
- 44.De Lean, A., Stadel, J. M., and Lefkowitz, R. J. (1980) J. Biol. Chem. 255 7108-7117 [PubMed] [Google Scholar]
- 45.Hausdorff, W. P., Caron, M. G., and Lefkowitz, R. J. (1990) FASEB J. 4 2881-2889 [PubMed] [Google Scholar]
- 46.Bouvier, M., Hausdorff, W. P., De Blasi, A., O'Dowd, B. F., Kobilka, B. K., Caron, M. G., and Lefkowitz, R. J. (1988) Nature 333 370-373 [DOI] [PubMed] [Google Scholar]
- 47.Mishra, S., and Joshi, P. G. (2007) J. Neurochem. 103 Suppl. 1, 135-142 [DOI] [PubMed] [Google Scholar]
- 48.Nichols, B. J. (2003) Curr. Biol. 13 686-690 [DOI] [PubMed] [Google Scholar]
- 49.Smart, E. J., Ying, Y. S., Mineo, C., and Anderson, R. G. (1995) Proc. Natl. Acad. Sci. U. S. A. 92 10104-10108 [DOI] [PMC free article] [PubMed] [Google Scholar]
- 50.Vidalain, P. O., Azocar, O., Servet-Delprat, C., Rabourdin-Combe, C., Gerlier, D., and Manie, S. (2000) EMBO J. 19 3304-3313 [DOI] [PMC free article] [PubMed] [Google Scholar]
- 51.Brown, D. A., and Rose, J. K. (1992) Cell 68 533-544 [DOI] [PubMed] [Google Scholar]
- 52.McCabe, J. B., and Berthiaume, L. G. (2001) Mol. Biol. Cell 12 3601-3617 [DOI] [PMC free article] [PubMed] [Google Scholar]
- 53.Madore, N., Smith, K. L., Graham, C. H., Jen, A., Brady, K., Hall, S., and Morris, R. (1999) EMBO J. 18 6917-6926 [DOI] [PMC free article] [PubMed] [Google Scholar]
- 54.Thomas, J. L., Holowka, D., Baird, B., and Webb, W. W. (1994) J. Cell Biol. 125 795-802 [DOI] [PMC free article] [PubMed] [Google Scholar]
- 55.Pierini, L., Holowka, D., and Baird, B. (1996) J. Cell Biol. 134 1427-1439 [DOI] [PMC free article] [PubMed] [Google Scholar]
- 56.Seveau, S., Eddy, R. J., Maxfield, F. R., and Pierini, L. M. (2001) Mol. Biol. Cell 12 3550-3562 [DOI] [PMC free article] [PubMed] [Google Scholar]
- 57.Gomez-Mouton, C., Lacalle, R. A., Mira, E., Jimenez-Baranda, S., Barber, D. F., Carrera, A. C., Martinez, A., and Manes, S. (2004) J. Cell Biol. 164 759-768 [DOI] [PMC free article] [PubMed] [Google Scholar]
- 58.Becher, A., White, J. H., and McIlhinney, R. A. (2001) J. Neurochem. 79 787-795 [DOI] [PubMed] [Google Scholar]
- 59.Oh, P., and Schnitzer, J. E. (2001) Mol. Biol. Cell 12 685-698 [DOI] [PMC free article] [PubMed] [Google Scholar]
- 60.Allen, J. A., Yu, J. Z., Donati, R. J., and Rasenick, M. M. (2005) Mol. Pharmacol. 67 1493-1504 [DOI] [PubMed] [Google Scholar]
- 61.Smart, E. J., Ying, Y., Donzell, W. C., and Anderson, R. G. (1996) J. Biol. Chem. 271 29427-29435 [DOI] [PubMed] [Google Scholar]
- 62.Uittenbogaard, A., Ying, Y., and Smart, E. J. (1998) J. Biol. Chem. 273 6525-6532 [DOI] [PubMed] [Google Scholar]
- 63.Uittenbogaard, A., Shaul, P. W., Yuhanna, I. S., Blair, A., and Smart, E. J. (2000) J. Biol. Chem. 275 11278-11283 [DOI] [PubMed] [Google Scholar]
- 64.Uittenbogaard, A., and Smart, E. J. (2000) J. Biol. Chem. 275 25595-25599 [DOI] [PubMed] [Google Scholar]
- 65.Krumins, A. M., and Barber, R. (1997) Biochem. Pharmacol. 54 61-72 [DOI] [PubMed] [Google Scholar]
- 66.Kukkonen, J. P., Nasman, J., and Akerman, K. E. (2001) Trends Pharmacol. Sci. 22 616-622 [DOI] [PubMed] [Google Scholar]
- 67.Ostrom, R. S., Violin, J. D., Coleman, S., and Insel, P. A. (2000) Mol. Pharmacol. 57 1075-1079 [PubMed] [Google Scholar]
- 68.Gao, M., Ping, P., Post, S., Insel, P. A., Tang, R., and Hammond, H. K. (1998) Proc. Natl. Acad. Sci. U. S. A. 95 1038-1043 [DOI] [PMC free article] [PubMed] [Google Scholar]
- 69.Tepe, N. M., Lorenz, J. N., Yatani, A., Dash, R., Kranias, E. G., Dorn, G. W., and Liggett, S. B. (1999) Biochemistry 38 16706-16713 [DOI] [PubMed] [Google Scholar]
- 70.Harikumar, K. G., Puri, V., Singh, R. D., Hanada, K., Pagano, R. E., and Miller, L. J. (2005) J. Biol. Chem. 280 2176-2185 [DOI] [PubMed] [Google Scholar]
- 71.Lagane, B., Gaibelet, G., Meilhoc, E., Masson, J. M., Cezanne, L., and Lopez, A. (2000) J. Biol. Chem. 275 33197-33200 [DOI] [PubMed] [Google Scholar]
- 72.Gimpl, G., Burger, K., and Fahrenholz, F. (1997) Biochemistry 36 10959-10974 [DOI] [PubMed] [Google Scholar]
- 73.Klein, U., Gimpl, G., and Fahrenholz, F. (1995) Biochemistry 34 13784-13793 [DOI] [PubMed] [Google Scholar]
- 74.Eroglu, C., Brugger, B., Wieland, F., and Sinning, I. (2003) Proc. Natl. Acad. Sci. U. S. A. 100 10219-10224 [DOI] [PMC free article] [PubMed] [Google Scholar]
- 75.Pang, L., Graziano, M., and Wang, S. (1999) Biochemistry 38 12003-12011 [DOI] [PubMed] [Google Scholar]
- 76.Goodwin, J. S., Drake, K. R., Remmert, C. L., and Kenworthy, A. K. (2005) Biophys. J. 89 1398-1410 [DOI] [PMC free article] [PubMed] [Google Scholar]
- 77.Klein, S., Reuveni, H., and Levitzki, A. (2000) Proc. Natl. Acad. Sci. U. S. A. 97 3219-3223 [DOI] [PMC free article] [PubMed] [Google Scholar]
- 78.Bunemann, M., Frank, M., and Lohse, M. J. (2003) Proc. Natl. Acad. Sci. U. S. A. 100 16077-16082 [DOI] [PMC free article] [PubMed] [Google Scholar]
- 79.Levitzki, A., and Klein, S. (2002) ChemBioChem 3 815-818 [DOI] [PubMed] [Google Scholar]
Associated Data
This section collects any data citations, data availability statements, or supplementary materials included in this article.