

Abstract
Efficient excitatory transmission depends on a family of transporters that use the Na+-electrochemical gradient to maintain low synaptic concentrations of glutamate. These transporters consume substantial energy in the spatially restricted space of fine astrocytic processes. GLT-1 (EAAT2) mediates the bulk of this activity in forebrain. To date, relatively few proteins have been identified that associate with GLT-1. In the present study, GLT-1 immunoaffinity isolates were prepared from rat cortex using three strategies and analyzed by liquid chromatography-coupled tandem mass spectrometry. In addition to known interacting proteins, the analysis identified glycolytic enzymes and outer mitochondrial proteins. Using double-label immunofluorescence, GLT-1 was shown to colocalize with the mitochondrial matrix protein, ubiquinol-cytochrome c reductase core protein 2 or the inner mitochondrial membrane protein, ADP/ATP translocase, in rat cortex. In biolistically transduced hippocampal slices, fluorescently tagged GLT-1 puncta overlapped with fluorescently tagged mitochondria along fine astrocytic processes. In a Monte Carlo-type computer simulation, this overlap was significantly more frequent than would occur by chance. Furthermore, fluorescently tagged hexokinase-1 overlapped with mitochondria or GLT-1, strongly suggesting that GLT-1, mitochondria, and the first step in glycolysis are cocompartmentalized in astrocytic processes. Acute inhibition of glycolysis or oxidative phosphorylation had no effect on glutamate uptake in hippocampal slices, but simultaneous inhibition of both processes significantly reduced transport. Together with previous results, these studies show that GLT-1 cocompartmentalizes with Na+/K+ ATPase, glycolytic enzymes, and mitochondria, providing a mechanism to spatially match energy and buffering capacity to the demands imposed by transport.
Introduction
Up to 80% of synaptic transmission in brain is mediated by glutamate. The levels of glutamate approach 10 mmol/kg, while extracellular concentrations approximate 25 nm (Schousboe, 1981; Herman and Jahr, 2007). These low extracellular levels of glutamate are essential to ensure appropriate signal to noise for excitatory signaling and to limit excessive activation of glutamate receptors that can cause excitotoxicity (for review, see Choi, 1992; Conti and Weinberg, 1999). A family of Na+-dependent transporters mediates the only process known to actively clear extracellular glutamate (for reviews, see Schousboe, 1981; Danbolt, 2001). These transporters couple the movement of 3 Na+ ions and 1 H+ to the inward transport of glutamate, providing sufficient energy to maintain a transmembrane concentration gradient of up to one million-fold (Zerangue and Kavanaugh, 1996). The Na+-gradient is maintained by the Na+/K+ ATPase; this transporter physically and functionally couples to glutamate transport (Rose et al., 2009). GLT-1 (also called EAAT2) provides the predominant route for glutamate clearance in the forebrain (for review and discussion, see Tanaka et al., 1997; Robinson, 1999). Not surprisingly, GLT-1 is extremely abundant, representing ∼1% of total brain protein (Lehre and Danbolt, 1998).
Assembly of multiprotein complexes influences both specificity and efficiency of biological processes within a complex cellular milieu. In the brain, multiprotein assemblies of receptors, ion channels, and transporters have been identified (for review and discussion, see Levitan, 2006; Mandela and Ordway, 2006; Torres, 2006; Chen and Olsen, 2007; Muller et al., 2010). The complexes execute critical biological functions, including stabilizing receptors near synapses, tethering kinases and phosphatases to limit nonspecific modification of proteins, and assembling enzymes to increase the efficiency of substrate transfer. This spatial compartmentalization of biological processes has been extended to mitochondria. For example, mitochondria cocompartmentalize with and interact with the IP3 receptor found in the endoplasmic reticulum (de Brito and Scorrano, 2008; Garcia-Perez et al., 2008). Mitochondria also accumulate in dendritic spines or near nodes of Ranvier, where they are thought to support local energy demands and/or ion buffering (Macaskill et al., 2009 Zhang et al., 2010; Ohno et al., 2011).
GLT-1 is enriched on small-diameter astroglial processes near synapses (Chaudhry et al., 1995; Lehre et al., 1995); however, relatively few interacting proteins of GLT-1 have been identified (for review, see Tzingounis and Wadiche, 2007). Mass spectrometry-based proteomic approaches have emerged as a powerful method to identify potential interacting partners (for review, see Baldwin, 2004; Domon and Aebersold, 2006; Kabbani et al., 2007; Xiao et al., 2007; Muller et al., 2010). In the present study, GLT-1 was immunoaffinity purified from cortex and analyzed by mass spectrometry. Several putative interacting proteins were further validated using reverse immunoprecipitations. The two largest groups of proteins that were consistently identified were most of the glycolytic enzymes and several mitochondrial proteins. Two complementary analyses show colocalization of mitochondria and GLT-1 in vivo and in individual astrocytes in organotypic slice cultures. Together with previously published functional and anatomic data, we propose that GLT-1 exists in a multiprotein complex in close association with mitochondria to support local energy demands of the transporter.
Materials and Methods
Immunoprecipitations.
Cortical tissue was harvested from adult male Sprague Dawley rats after euthanasia by decapitation to avoid potential effects of anesthetic agents (Huang and Zuo, 2005) and homogenized in immunoprecipitation buffer (150 mm NaCl, 1 mm EDTA, 100 mm Tris HCl, pH 7.4, 1% Triton X-100, and 1% sodium deoxycholate) plus protease and phosphatase inhibitors (1 μg/ml leupeptin, 260 μm PMSF, 1 μg/ml aprotinin, 1 mm iodoacetamide, 10 mm NaF, and 1 mm sodium orthovanadate; 18.5 ml/g wet weight). Homogenates were rotated on a shaker for 1 h at 4°C and then cleared of cellular debris by centrifugation at 13,000 × g for 30 min at 4°C (Proteomes 1 and 2) or 100,000 × g for 1 h at 4°C (Proteome 3) to remove any intact organelles or incompletely solubilized membrane compartments. The pellet was removed and then 1 ml of lysate was precleared by shaking with 80 μl protein-A agarose beads (Invitrogen) at 4°C for 1 h. After analyses of protein (bicinchoninic acid protein assay kit; Pierce), an aliquot of the resulting supernatant was mixed overnight at 4°C with anti-GLT-1 antibody (carboxyl-terminal directed rabbit polyclonal, a kind gift from Dr. J. Rothstein, Johns Hopkins Medical School, Baltimore, MD) (Rothstein et al., 1994) or rabbit IgG antibody (Zymed Laboratories). . Protein complexes were isolated with protein-A agarose beads (30 μl) by gently mixing for 2 h at 4°C. After centrifugation, the agarose beads were washed four times in immunoprecipitation buffer before elution of bound proteins in 30 μl of SDS-PAGE loading buffer by incubation at 25°C for 45 min or 95°C for 5 min. These same procedures were used in subsequent immunoprecipitation experiments to confirm the results obtained by mass spectrometry using 500 μg of cortical brain protein and 15 μg of antibody (for sources of these antibodies see the description of Western blotting below). In all experiments, mouse IgG (Zymed Laboratories), goat IgG (Santa Cruz Biotechnology), or rabbit IgG was used as a species-specific negative control.
Sample preparation for mass spectrometry.
Eluted proteins were resolved using 4–12% Bis-Tris gradient gels (Invitrogen) and stained with SimplyBlue Coomassie (Invitrogen). For Proteome 1, bands identified with SimplyBlue were excised for digestion. For Proteomes 2 and 3, each lane (either IgG or GLT-1 IP) was cut into 20 equal fractions. Each fraction was further cut into 1 mm3 pieces and subjected to in-gel digestion with trypsin based on procedures published previously (Shevchenko et al., 1996; Speicher et al., 2000). Briefly, gel pieces were destained with 50% acetonitrile/200 mm ammonium bicarbonate, reduced with 20 mm Tris (2-carboxyethyl)-phosphine hydrochloride (Pierce) and alkylated with 55 mm iodoacetamide (Sigma). Proteolysis was initiated by the addition of 20 ng/μl of sequencing grade trypsin in 50 mm ammonium bicarbonate (Promega) and allowed to proceed overnight at 37°C. Peptides were extracted three times in 50% acetonitrile (Burdick and Jackson), 5% formic acid (FA; Sigma-Aldrich). The volume was reduced by vacuum centrifugation and adjusted to 30 μl with 0.1% formic acid.
Liquid chromatography-MS/MS analysis.
Peptide digests were loaded directly onto a C18 capillary column (75 μm × 100 mm Proteoprep 2; New Objective) isocratically in 2% acetonitrile/0.1% FA at a flow rate of 1 μl per min using an Eksigent 2D liquid chromatography (LC) system. A linear gradient was then initiated at a flow rate of 300 nl per min with Buffer A (0.1% FA) and Buffer B (80% acetonitrile/0.1% FA; 3–40% Buffer B in Buffer A). Mass spectrometry was performed on a ThermoFinnegan LTQ mass spectrometer as peptides eluted off the column. The instrument was set to scan a range of 400–2000 m/z repetitively and collect MS/MS scans in a data-dependent manner of the top 10 (Proteomic Analyses 1 and 2) or the top five (Proteomic Analysis 3) most intense ions (minimum signal, 500). Dynamic exclusion was enabled with a repeat count of 1 or 2 for 30 s. An exclusion window was set to 0.5 Da below the target m/z and 1.5 Da above. MS/MS experiments were performed with an isolation width of 2, collision energy of 35, an activation of Q = 0.25, and an activation time of 30.
Database searching.
All MS/MS samples were analyzed using Sequest (ThermoFinnegan; version 2.7) using the mouse and rat components of the Uniprot database (August 2007) containing the forward and reverse sequences, as well as known contaminants: human keratins, porcine trypsin, and yeast enolase (40,398 entries) assuming the digestion enzyme trypsin with one missed cleavage. The reverse sequences were included in the database to calculate the protein false positive rate (Balgley et al., 2007). Sequest was searched with a fragment ion mass tolerance of 1.00 Da and a parent ion tolerance of 1.20 Da. The S-carbamamidomethyl derivative of cysteine was specified in Sequest as a fixed modification. Oxidation of methionine was specified in Sequest as a variable modification.
Criteria for protein identification.
Scaffold (version Scaffold-01_07_00; Proteome Software) was used to validate MS/MS-based peptide and protein identifications. Scaffold probabilistically validates peptide identifications using PeptideProphet (Keller et al., 2002) and derives corresponding protein probabilities using ProteinProphet (Nesvizhskii et al., 2003). For Proteomes 1 and 2, proteins were accepted if identified by two or more peptides with >95.0% peptide probability and >95.0% protein probability. These criteria resulted in a protein false positive rate of 3% for each analysis. For Proteome 3, the minimum number of peptides was raised to three, resulting in a false positive rate of 3%. Proteins that contained similar peptides and could not be differentiated based on MS/MS analysis alone were grouped to satisfy the principles of parsimony. Common contaminants (keratin, enolase, and trypsin) and proteins identified in the IgG sample were removed from the dataset.
Western blot analysis.
Proteins (including rainbow molecular weight marker; GE Healthcare) were run on 8 or 10% SDS-polyacrylamide gels, transferred to polyvinylidene fluoride membranes, and blocked either overnight at 4°C or for 1 h at 25°C in TBS-T (50 mm Tris, pH 8.0, 150 mm NaCl, 0.2% Tween 20) containing 5% nonfat dry milk. Membranes were then probed with the appropriate primary antibody: rabbit anti-GLT-1 (1:10,000; Dr. J. Rothstein); mouse anti-dynamin (1:1000; BD Transduction Laboratories); mouse anti-synapsin I (1:500; Stressgen); mouse anti-CNPase (1:1000; Sigma); rabbit anti-acetyl-CoA acetyltransferase (1:400; Novus); mouse anti-pyruvate dehydrogenase (1:1000; MitoSciences). Mouse anti-α-adaptin (AP2; 1:500), mouse anti-phosphoglycerate kinase-1 (1:200), mouse anti-ß1 subunit of the Na+/K+ATPase (1:200), rabbit anti-phosphofructokinase-1 (PFK-1; 1:200), goat anti-NADH-ubiquinone oxidoreductase (1:200), goat anti-glycogen phosphorylase (1:200), and anti-ADP/ATP translocase (ANT; 1:50) were from Santa Cruz Biotechnology. Mouse anti-hexokinase (1:1000), mouse anti-α1 subunit of the Na+/K+ATPase (1:2000), and mouse anti-glyceraldehyde-3-phosphate dehydrogenase (GAPDH; 1:200) were from Millipore. Mouse anti-prohibitin (1:100), rabbit anti-isocitrate dehydrogenase (1:1000), rabbit anti-phosphoglycerate kinase-1 (1:500), and mouse anti-ubiquinol-cytochrome c reductase complex core protein 2 (UQCRC2) (1:10,000) were from Abcam. Mouse anti-post-synaptic density protein-95 (PSD-95; 1:1000) was from University of California, Davis/NIH Neuromab. Mouse anti-myelin basic protein (1:1000) was from Covance. Immobilon P membranes (polyvinylidene fluoride; Millipore) were washed in TBS-T containing 1% nonfat dry milk and then incubated with anti-rabbit or anti-mouse horseradish peroxidase IgG (1:5000; GE Healthcare). Protein bands were visualized using enhanced chemiluminescence kits and Hyperfilm ECL (GE Healthcare).
Subcellular fractionation.
Cellular fractionation was performed as described previously (Sims and Anderson, 2008); all steps were conducted at 4°C. The forebrain/midbrain was dissected from adult male Sprague Dawley rats, weighed, and homogenized in 10 volumes of “isolation” buffer, containing 0.32 m sucrose, 10 mm Tris, 1 mm EDTA, pH 7.4. To differentiate cytoplasmic from membrane/organelle bound proteins, this crude homogenate was centrifuged at 100,000 × g for 1 h. The pellet was resuspended in five volumes of isolation buffer. For subcellular fractionations, Percoll (GE Healthcare) was diluted to 40% with 30 mm Tris-HCl, 0.96 m sucrose, and 3 mm EDTA (pH 7.4). From this stock solution, two concentrations of Percoll were prepared (15 and 23%) by further dilution in isolation buffer. The crude homogenate was centrifuged at 1300 × g for 3 min. The resulting pellet was suspended in five volumes of isolation buffer, homogenized, and centrifuged at 1300 × g for 3 min. The supernatants from these two steps (called S1) were combined and centrifuged at 21,000 × g for 10 min. The resulting supernatant was saved S2 and the pellet P2was homogenized in 15% Percoll. No less than 3.2 ml of this solution was layered over a discontinuous gradient composed of 3.5 ml of 40% and 3.5 ml of 23% Percoll. After centrifugation at 37,500 × g for 5 min in a fixed angle rotor (JA20.1; Beckman Coulter), three fractions (top of gradient, 15%/23% interface and 23%/40% interface) were isolated using a pipette from the top of the gradient. The 23%/40% interface (enriched in mitochondria) was diluted 1:4 in isolation buffer and centrifuged at 16,700 × g for 10 min. The resulting pellet was resuspended in 3 ml isolation buffer and centrifuged at 6900 × g for 10 min. The final pellet was resuspended in 300 μl isolation buffer. After analyses of protein levels, samples were resolved by SDS-PAGE.
Preparation of cDNA constructs.
Monomeric red fluorescent protein (mRFP) was a gift from Dr. R. Tsien (University of California at San Diego). mRFP-C3 was obtained by replacing EGFP with mRFP in pEGFP-C3 (Clontech). mRFP-GLT-1 was generated in two steps. The coding region of GLT-1 was amplified from GLT-1 (pcDNA) adding restriction sites for BglII and SalI. The PCR product was gel purified and ligated into pCR2.1 using a Topo TA cloning kit (Invitrogen). The coding sequence was restricted from pCR2.1 using BglII and SalI and subsequently ligated into pmRFP-C3. Analyses of Na+-dependent [3H]-glutamate transport activity (Dowd et al., 1996) after transient transfection into HEK293T cells were used to confirm that the resulting transporter is functional (data not shown). Hexokinase-1 in the pOTB7 vector was purchased from ThermoFisher Scientific. The coding region of hexokinase-1 was amplified adding restriction sites for XhoI and PstI. The PCR product was gel purified and ligated into pCR2.1 vector. The coding sequence was restricted from pCR2.1 using XhoI and PstI and ligated into pEGFP-N1. The identity of all constructs was confirmed by sequencing. The plasmid encoding a fusion of EGFP with the mitochondrial targeting sequence of subunit VIII of cytochrome c oxidase was a generous gift from Dr. S. Thayer (University of Minnesota, Minneapolis, MN) (Llopis et al., 1998; Wang et al., 2003). pDsRed2-mito was purchased from Clontech.
Hippocampal slice cultures.
Hippocampal slices (300 μm) were prepared using a McIlwain tissue chopper (Brinkman Instruments) from rat pups between 6 and 10 d of age and placed in 0.4 μm Millicell culture inserts (Millipore) in six-well plates as described previously (Kayser et al., 2006). Slices were maintained in a humidified incubator with 5% CO2 at 37°C in 1 ml of medium containing the following: 50% Neurobasal medium, 25% HBSS, and 25% horse serum, supplemented with 10 mm HEPES, 36 mm glucose, 2 mm glutamine, 10 U/ml penicillin, and 100 μg/ml streptomycin, pH 7.2–7.3. After 2 d in vitro, hippocampal slice cultures were transduced using a Helios Gene Gun (Bio-Rad) (McAllister, 2004). cDNAs (10 μg) were combined with 10 μg of 1.0 μm gold particles in a solution with 0.02 mg/ml polyvinylpyrrolidone 20, 0.05 m spermidine, and 1 m CaCl2. This suspension was used to coat Teflon tubing. Tubing was cut into cartridges and loaded into the Gene Gun, and gold particles were shot with high-pressure helium (100–120 psi) into cultured slices in inserts sitting on warmed agarose slabs. Under these conditions, astrocytes are selectively transduced (Benediktsson et al., 2005).
Two days after tranduction, slices were fixed on the membrane inserts in a solution of 4% paraformaldehyde in PBS for 15 min at room temperature. Tissues were rinsed in PBS and gently removed from their membrane support with a spatula. Some tissues were processed as free-floating sections for subsequent immunostaining. These sections were extracted overnight in a solution of PBS and 1% Triton X-100 at 4°C. Sections were blocked in 5% goat serum for 1 h at room temperature and incubated with rabbit anti-glial fibrillary acidic protein (GFAP) polyclonal antibody (1:400; Sigma) overnight at 4°C in a solution containing 1% Triton X-100 and 5% goat serum. Sections were rinsed 3 × 15 min in PBS and incubated overnight with secondary antibody (goat anti-rabbit Alexa Fluor 633; Invitrogen). Slices were rinsed 3 × 15 min in PBS before mounting on precoated slides (Superfrost Plus; Fisher Scientific).
Images were collected on an Olympus Fluoview 1000 laser-scanning confocal microscope attached to an Olympus IX inverted microscope and equipped with 405, 488, 546, and 633 nm laser lines. All images were collected in sequential scan mode to limit cross-contamination of fluorescence. For 3D reconstruction of cells in slices, 40–80 optical sections were taken at an interval of 0.5 μm in the z-direction using a 40× UPlanFL objective (numerical aperture, 1.3).
Immunofluorescence.
Adult rats (8–10 weeks) were anesthetized with isofluorane and transcardially perfused with ice-cold PBS followed by 4% paraformaldehyde in PBS, pH 7.4. After dissection, the brains were postfixed in 4% paraformaldehyde in PBS for 2 h, equilibrated in a solution of 30% sucrose-PBS (4°C), and flash frozen in −50°C isopentane. Brains were stored at −80°C until sectioning. Coronal sections (40 μm) were cut on a microtome and processed as free-floating sections. Sections were blocked in a 5% normal serum from the species in which the secondary antibody was raised and 0.4% Triton X-100 for 1 h. Sections were stained with mouse anti-UQCRC2 (1:2000; Mitosciences) and/or rabbit polyclonal anti-GLT-1 (1:100; a kind gift from Dr. J. Rothstein) overnight at 4°C. For visualization, sections were incubated in secondary antiserum (either Alexa Fluor 488 or 546; 1:500; Invitrogen) for 1 h at room temperature followed by washes. In a separate set of experiments, sections were stained with mouse monoclonal anti-GLT-1 (1:100; a kind gift from Dr. J. Rothstein) and goat-anti-ANT (1:50). Alexa Fluor 488 and 633 were used as secondary antibodies in this set of experiments. Sections were mounted on precoated slides (Superfrost Plus; Fisher Scientific), coverslipped with a DNA counterstain (DAPI), and stored at 4°C until analyzed. Sections were visualized on a Fluoview 1000 confocal microscope (Olympus) equipped with a PlanApo 60× objective (numerical aperture, 1.4). All images were collected in sequential scan mode to minimize cross-contamination of fluorophores. In parallel incubations, each of the primary antibodies was omitted separately. No staining was observed, confirming that signal was due to the presence of primary antibody (data not shown). Similarly, each of the secondary antibodies was omitted separately in parallel incubations. These analyses confirmed the specificity of the secondary antibodies (data not shown).
Glutamate uptake in hippocampal slices.
After decapitation of adult male Sprague Dawley rats, hippocampi were dissected on a cooled metal plate and placed briefly in ice-cold artificial CSF containing the following (in mm): 130 NaCl, 3 KCl, 1.25 NaH2PO4, 26 NaHCO3, 10 glucose, 1 MgCl2, and 2 CaCl2, bubbled with 95% O2/5% CO2, pH 7.2. Transverse slices (450 μm) were prepared using a McIlwain Tissue chopper (Brinkmann) and incubated in submerged strainers (BD Biosciences) within an enclosed container in artificial CSF continuously bubbled with 95% O2/5% CO2 at 37°C. After 1–2 h, four slices were transferred to 1.7 ml vials. After preincubating for 5 min in artificial CSF containing reduced glucose (1 mm) with vehicle or drug, uptake was initiated by changing into 0.5 ml fresh artificial CSF containing l-[3H]-glutamate (100 μm) and ouabain (Tocris Bioscience), carbonyl cyanide 4-(trifluormethoxy) phenylhydrazone (FCCP), 2-deoxy-d-glucose (Sigma), or vehicle. After incubation at 37°C, ice-cold artificial CSF (1 ml) was added, and the slices were rapidly filtered using a Millipore 1225 sampling manifold and rinsed with 1 ml ice-cold artificial CSF. Individual slices were solubilized in 1 ml 0.1N NaOH overnight. A 100 μl aliquot was removed for analysis of protein (Lowry et al., 1951). Accumulation in each slice was normalized to protein, and data from the four slices were averaged. Glutamate transport activity was defined as the difference in the amount of radioactivity measured in the absence and presence of 1 mm threo-β-benzyloxyaspartic acid (TBOA). In two initial experiments, we confirmed that uptake was linear to 15 min (r2 = 0.94). In all subsequent experiments, uptake was measured for 15 min. Transport activity was expressed as a percentage of that observed in vehicle-treated slices. In 2 of 200 slices, the signal observed in an individual slice was >50% from the mean of the four slices, and these two data points were excluded. Uptake was expressed as a percent of that observed in vehicle-treated cells and compared by ANOVA using Bonferroni post hoc correction for multiple comparisons.
Image Analysis.
All image analysis was conducted using NIH ImageJ software (http://rsb.info.nih.gov/ij/).
Puncta analysis.
Images were background corrected and filtered using a Gausssian filter (σ = 1). Mitochondria and GLT-1 were identified by thresholding each channel at 3.5 times the standard deviation of the mean image and converted to a binary image. Coclustering of puncta was judged as >1 pixel (0.155 μm per pixel) of overlap between the two channels. We determined the number of puncta with overlap with at least one other puncta of the opposite type, as well as the size of each puncta for each astrocyte. The coclustering of puncta was described first as a simple percentage overlap. However, because the percentage overlap that occurs by chance increases with the fraction of the process covered by GLT-1 or mitochondria, we based our analysis on the coclustering of puncta using a weighted percentage. For each process, the observed percentage overlap was divided by the inverse of the product of the densities of GLT-1 and mitochondria; the density is the fraction of the length of the process covered by each type of particle. The values of percentage overlap reported here are the means of these weighted percentages across all processes. We constructed a 95% confidence interval (CI) on the percentage of overlap using a percentile bootstrap interval.
A Monte Carlo simulation was used to determine whether the observed overlap occurs more frequently than expected by chance. Each process was modeled as a line with each GLT-1 puncta or mitochondrion occupying portions of the line equal to its observed length. To determine how often overlap occurred by chance, the sum of all of the spaces between particles, defined as the process length minus the sum of observed GLT-1 length, was randomly split into n + 1 intervals, where n is the number of particles. Note that this yields n + 1 intervals, each with a randomly assigned length, with the sum of the length of these intervals equal to the total space available in each process. The intervals and GLT-1 particles were then randomly chosen and placed sequentially along the process; this results in a random distribution of the particles. In parallel, mitochondria were distributed using an identical procedure and then the two representations of the process were overlaid. The average percentage overlap of GLT-1 particles by mitochondria across all 48 processes was calculated using the same weighted percentage as described for the observed data; similarly, the overlap of mitochondria by GLT-1 was calculated. This procedure was repeated 10,000 times in the Monte Carlo simulation. In a final step, the distribution of weighted percentage overlap generated from the 10,000 simulations was compared to the weighted percentage overlap observed for the original data. Specifically, we calculated a one-sided empirical p value as the proportion of simulations with a weighted overlap equal to or greater than that in the observed data. Analyses were performed using the freeware R-2.12 (http://www.R-project.org/).
Intensity correlation/intensity colocalization quotient analysis.
Single optical sections were background corrected and filtered using a Gaussian filter (σ = 1). Images were automatically thresholded and the intensity colocalization quotient (ICQ) values calculated using the intensity correlation analysis (ICA) plug-in to the McMaster Biophotonics Facility ImageJ collection. The ICQs were calculated as described by Li et al. (2004); results were compared to zero using a one-sample t test.
Results
In initial experiments, increasing concentrations of a carboxyl-terminal directed anti-GLT-1 antibody were used to test for immunodepletion of GLT-1 from solubilized homogenates of rat cortex prepared under fairly stringent conditions that included 1% deoxycholate, 1% Triton X-100, and 150 mm NaCl (Fig. 1A). Using this approach, 2 μg of anti-GLT-1 antibody was sufficient to immunoprecipitate up to 70% of total GLT-1 immunoreactivity from 50 μg of brain lysates; the ratio of antibody to proteins was scaled for immunoaffinity purification. For mass spectrometry-based identification of proteins, three different immunoaffinity purifications were performed. In the first experiment, protein bands in GLT-1 immunoprecipitates that selectively stained with SimplyBlue Coomassie were excised (Fig. 1B). In the second experiment, the material immunoisolated using the anti-GLT-1 antibody was resolved, and the lane was cut into 20 equal fractions before digestion and MS analysis. Nonspecific interactions were examined by analyzing the material isolated with nonimmune IgG in parallel (Fig. 1C). In the third experiment, the lysates were subjected to a 100,000 × g centrifugation step before immunoprecipitation to remove any possible membrane-dependent aggregates or intact organelles. The resulting supernatant was subjected to immunoprecipitation, and both the anti-GLT-1 and nonspecific IgG samples were analyzed by fractionating each lane of the gel in 20 equal fractions.
Figure 1.
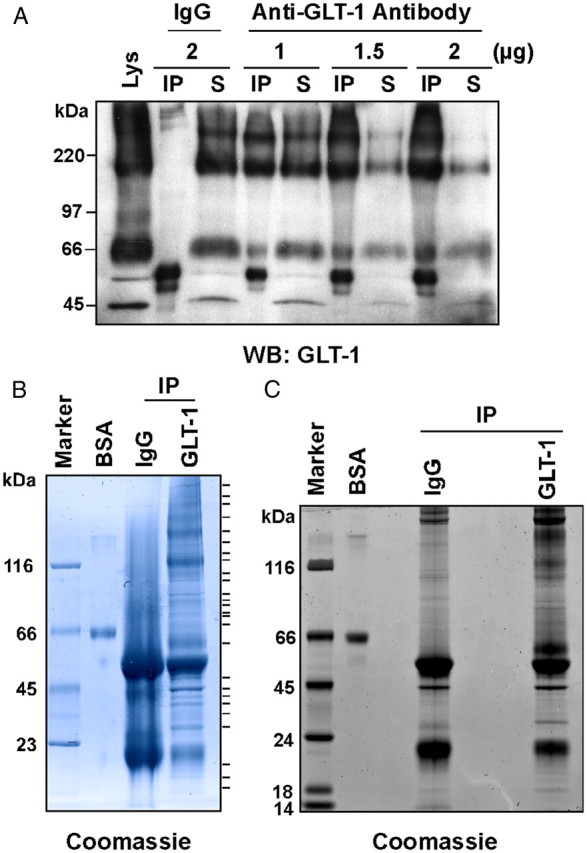
Immunoaffinity purification of GLT-1 from rat cortex. A, The amount of GLT-1 antibody required to deplete the supernatant of GLT-1 protein was optimized. Rat cortical lysates (50 μg protein) were immunoprecipitated with rabbit IgG antibody or increasing amounts of GLT-1 antibody, resolved by SDS-PAGE, and probed for GLT-1. Equivalent percentages of the immunoprecipitate (IP) and corresponding supernatant (S) were loaded on the gel. As observed previously, GLT-1 migrates as a monomer with a molecular weight of ∼66 kDa and a trimer of ∼200 kDa (Haugeto et al., 1996). Using 2 μg of GLT-1 antibody, 70% of GLT-1 was immunoisolated from the cortical lysate. Cortical lysate (Lys) was also loaded (10 μg protein). B, Rat cortical lysates (1 mg protein) were immunoprecipitated with 40 μg GLT-1 antibody or rabbit IgG, resolved on a 4–12% Tris-Bis gel, and stained with Coomassie blue. Protein bands observed in the GLT-1 (but not in the IgG) immunoprecipitate were excised, digested with trypsin, and subjected to LC MS/MS analysis on a ThermoFinnegan LTQ mass spectrometer. Excised bands are marked to the right of the gel. BSA protein (0.5 μg) was loaded to assess relative abundance of proteins. C, Rat cortical lysates (1 mg protein) were immunoprecipitated with 40 μg GLT-1 antibody or rabbit IgG, resolved on a 4–12% Tris-Bis gel, and stained with Coomassie blue. Each lane (IgG and GLT-1) was excised into 20 equivalent fractions, digested with trypsin, and subjected to LC MS/MS analysis. BSA (0.5 μg) protein was also loaded.
A total of 24 proteins were identified in all three analyses, and a total of 74 proteins were identified in two or more analyses (Table 1). The most notable difference between the three proteomic analyses is the absence of ribosomal proteins after a 100,000 × g centrifugation step. The absence of some proteins in the first proteomic analysis may be attributable to the fact that the complete gel was not analyzed. The 74 putative interacting proteins were categorized based on their proposed functions using the “Function” or “Subcellular localization” annotation in SwissProt or by literature references. In addition, this list of proteins was analyzed using DAVID, a bioinformatics tool that tests for relative enrichment of proteins in a dataset (Huang da et al., 2009). Based on analyses using cellular compartment, the list of putative interacting proteins was highly enriched in mitochondrial proteins (p = 7.15E-15; Benjamini corrected, which corrects multiple comparisons, p = 5.8E-12). In fact, excluding GLT-1, of the 23 proteins identified using these three complementary strategies, six are glycolytic enzymes and eight are mitochondrial proteins. Five of these glycolytic enzymes are cytoplasmic. The sixth, hexokinase, binds to mitochondria via the voltage-dependent anion channel (VDAC) (for discussion, see Sui and Wilson, 1997; Abu-Hamad et al., 2008). In addition to the VDAC, proteins such as dynamin-like protein, a cytoplasmic protein, interact with mitochondria via mitochondrial outer membrane proteins, such as FIS1 (Yoon et al., 2003).
Table 1.
Proteins identified in GLT-1 immunoisolates
| Accession number | Molecular weight (Da) | 1 | 2 | 3 | |
|---|---|---|---|---|---|
| Plasma membrane transporters, channels, and receptors | |||||
| Excitatory amino acid transporter 2 | P31596 | 62,090 | 13 | 16 | 16 |
| Sodium/potassium-transporting ATPase subunit α-1 | P06685 | 113,040 | 3 | 4 | |
| Sodium/potassium-transporting ATPase subunit α-3 | P06687 | 111,676 | 9 | 9 | 10 |
| Sodium/potassium-transporting ATPase subunit β-1 | P07340 | 35,186 | 3 | 3 | |
| Translation, chaperones, trafficking, and adaptors | |||||
| 40S ribosomal protein S14 | P13471 | 16,255 | 4 | 2 | |
| 40S ribosomal protein S16 | P14131 | 16,428 | 3 | 3 | |
| 40S ribosomal protein S3a | P49242 | 29,927 | 2 | 3 | |
| 60S ribosomal protein L11 | P62914 | 20,235 | 3 | 2 | |
| 60S ribosomal protein L22 | P67984 | 14,741 | 2 | 2 | |
| 60S ribosomal protein L23 | P62830 | 14,848 | 2 | 3 | |
| Adaptor related protein 2 complex subunit α-1 (AP-2) | P17426 | 107,649 | 8 | 5 | 3 |
| Adaptor related protein 2 complex subunit β-1 (AP-2) | P62944 | 104,537 | 8 | 8 | 7 |
| ADP-ribosylation factor 3 | P61205 | 20,680 | 5 | 5 | |
| ADP-ribosylation factor 6 | P62331 | 20,065 | 2 | 2 | |
| Cullin-associated NEDD8-dissociated protein 1 | P97536 | 136,349 | 6 | 6 | 10 |
| Dynamin-1 | P21575 | 95,912 | 14 | 14 | |
| EH domain-containing protein 3 | Q9QXY6 | 60,854 | 4 | 4 | |
| Heat shock 70 kDa protein 12A | Q8K0U4 | 74,855 | 5 | 4 | |
| Heat shock cognate 71 kDa protein | P63017 | 70,855 | 14 | 12 | |
| Alpha internexin | P23565 | 56,099 | 3 | 8 | |
| Neurofilament light polypeptide | P08551 | 61,492 | 5 | 3 | |
| p130Cas-associated protein (SNAP-25 interacting protein) | Q9QXY2 | 129,729 | 3 | 2 | |
| Reticulon-1 | Q8K0T0 | 83,556 | 3 | 2 | |
| Synapsin-1 | P09951 | 73,970 | 11 | 7 | 12 |
| Synapsin-2 | Q63537 | 63,355 | 4 | 3 | |
| Syntaxin-binding protein 1 | O08599 | 67,554 | 8 | 13 | |
| T-complex protein 1 subunit α (chaperonin Cpn60) | P28480 | 60,343 | 6 | 3 | |
| T-complex protein 1 subunit delta (chaperonin subunit 4) | P80315 | 58,050 | 7 | 4 | |
| T-complex protein 1 subunit gamma | Q6P502 | 60,630 | 3 | 2 | 7 |
| T-complex protein 1 subunit theta (chaperonin subunit 8) | P42932 | 59,538 | 9 | 3 | |
| Vesicle-fusing ATPase (N-ethylmaleimde-sensitive fusion protein) | Q9QUL6 | 82,638 | 19 | 16 | |
| Signaling molecules | |||||
| 2',3'-cyclic-nucleotide 3'-phosphodiesterase (CNPase) | P13233 | 47,252 | 16 | 5 | 11 |
| Guanine nucleotide-binding protein G(o) subunit α 1 | P59215 | 40,052 | 8 | 4 | |
| Mitogen-activated protein kinase kinase 1 (MAP kinase kinase) | P31938 | 43,457 | 2 | 3 | |
| Serine/threonine-protein phosphatase 2B catalytic subunit α isoform | P63328 | 58,628 | 8 | 3 | |
| Serine/threonine-protein kinase DCLK1 | Q9JLM8 | 84,137 | 4 | 8 | |
| Glycolysis | |||||
| Glycogen phosphorylase, brain form | P53534 | 96,715 | 4 | 7 | 7 |
| Hexokinase-1 | P05708 | 102,393 | 6 | 10 | 7 |
| 6-Phosphofructokinase type C | P47860 | 85,704 | 12 | 8 | 3 |
| 6-Phosphofructokinase, muscle type | P47857 | 85,252 | 15 | 6 | 3 |
| Glyceraldehyde-3-phosphate dehydrogenase | P04797 | 35,810 | 9 | 7 | 10 |
| Phosphoglycerate kinase 1 | P09411 | 44,521 | 5 | 10 | |
| Pyruvate kinase isozymes M1/M2 | P11980 | 57,801 | 5 | 4 | 9 |
| Mitochondrial proteins | |||||
| Acetyl-CoA acetyltransferase | P17764 | 44,677 | 3 | 4 | 4 |
| ADP/ATP translocase 1 (solute carrier family 25-member 4) (ANT1) | Q05962 | 32,973 | 8 | 9 | |
| ATP synthase B chain | P19511 | 28,852 | 4 | 4 | |
| ATP synthase gamma chain | P35435 | 30,175 | 4 | 6 | 6 |
| Calcium-binding mitochondrial carrier protein Aralar1 (solute carrier family 25, member 12) | Q8BH59 | 74,554 | 15 | 14 | 7 |
| Dihydrolipoyllysine-residue acetyltransferase component of pyruvate dehydrogenase complex | P08461 | 67,149 | 5 | 10 | |
| D-β-hydroxybutyrate dehydrogenase | P29147 | 38,184 | 6 | 7 | |
| Dynamin-1-like protein | O35303 | 83,893 | 7 | 8 | |
| Dynamin-like 120 kDa protein | Q2TA68 | 111,292 | 4 | 8 | |
| Isocitrate dehydrogenase (NAD) subunit α | Q99NA5 | 39,596 | 5 | 6 | 8 |
| Isocitrate dehydrogenase (NAD) subunit β | Q68FX0 | 42,336 | 6 | 7 | 8 |
| Mitochondrial glutamate carrier 1 (Solute Carrier Family 25–member 22) | Q9D6M3 | 34,653 | 5 | 4 | |
| Mitochondrial 2-oxoglutarate/malate carrier protein (Solute Carrier Family 25–member 11) | P97700 | 34,227 | 3 | 3 | |
| NADH-ubiquinone oxidoreductase 75 kDa subunit | Q66HF1 | 79,396 | 2 | 3 | |
| Phosphate carrier protein | Q8VEM8 | 39,615 | 6 | 11 | 6 |
| Prohibitin | P67778 | 29,803 | 4 | 5 | |
| Prohibitin-2 | O35129 | 33,296 | 9 | 4 | 6 |
| Pyruvate carboxylase | P52873 | 129,668 | 3 | 3 | |
| Pyruvate dehydrogenase E1 component subunit β | P49432 | 38,964 | 2 | 4 | 7 |
| Sideroflexin-3 | Q9JHY2 | 35,415 | 3 | 5 | |
| Stomatin-like protein 2 | Q4FZT0 | 38,396 | 6 | 3 | |
| Trifunctional enzyme subunit α | Q64428 | 82,497 | 2 | 4 | |
| Ubiquinol-cytochrome c reductase complex core protein 2 | P32551 | 48,380 | 12 | 9 | |
| Voltage-dependent anion-selective channel protein 2 | P81155 | 31,716 | 2 | 2 | |
| Voltage-dependent anion-selective channel protein 3 | Q9R1Z0 | 30,781 | 3 | 2 | |
| Other | |||||
| Adenylate kinase isoenzyme 1 | P39069 | 21,566 | 3 | 2 | 3 |
| Complement C3 precursor | P01026 | 186,444 | 3 | 3 | |
| Myelin proteolipid protein | P60202 | 30,060 | 5 | 3 | |
| Probable ATP-dependent RNA helicase DDX5 | Q61656 | 69,304 | 3 | 3 | |
| Puromycin-sensitive aminopeptidase | Q11011 | 103,336 | 2 | 4 | |
| Vacuolar ATP synthase catalytic subunit A (lysosomal V1 subunit) | P50516 | 68,309 | 4 | 3 | 5 |
GLT-1 was immunoaffinity purified from rat cortical tissue using three different strategies as described in Materials and Methods. Proteins identified in at least two of the purifications and not observed in control immunoprecipitations are listed. Proteins were categorized as described in Materials and Methods. The columns on the right labeled 1, 2, and 3 refer to the particular immunoisolation (see Materials and Methods or the first paragraph of Results). The numbers in these columns refer to the number of unique peptides identified in the experiment.
Although the list of potential interacting proteins presented in Table 1 represents proteins identified with high confidence by mass spectrometry, antibody-based methods were used to further validate identification of proteins. A total of 18 different targets were selected based on their cellular localization, subcellular localization, functional implications, and potential availability of antibodies for further analysis. With eight of these antibodies, the results were uninformative because the antibody did not immunoprecipitate the putative interacting protein and/or there were too many cross-reacting bands to confidently identify the putative interacting protein, including hexokinase, prohibitin, isocitrate dehydrogenase, phosphoglycerate kinase-1, NADH-oxidoreductase, acetyl-CoA acetyltransferase, pyruvate dehydrogenase, and glycogen phosphorylase. These were not pursued any further.
Two sets of studies were conducted with the remaining antibodies. First, anti-GLT-1 antibody was used to prepare immunoisolates from cortex, and the resulting protein mixtures were analyzed by Western blot. In this series of studies, the α1 subunit of the Na+/K+ ATPase, GAPDH, PFK-1, α-adaptin (also known as AP2), dynamin, 2′,3′-cyclic-nucleotide 3′-phosphodiesterase (CNPase), synapsin, UQCRC2 (a subunit of mitochondrial complex III), or ANT were detected in GLT-1 immunoprecipitates (Fig. 2). These studies provide further support for the mass spectrometry-based protein identifications, but do not rule out the possibility that anti-GLT-1 antibody nonspecifically immunoprecipitates these proteins by an interaction that is independent of GLT-1 protein. To address this possibility each of these putative interacting proteins was immunoprecipitated from rat brain cortex, and the resulting immunoprecipitates were tested for the presence of GLT-1. GLT-1 was observed in all 10 cases that the putative interacting protein was identified in the immunoprecipitate, including the α1 and ß1 subunits of the Na+/K+ ATPase, GAPDH, PFK-1, AP2, dynamin, CNPase, synapsin, ANT, and UQCRC2 (Fig. 3). This provides strong evidence that interactions observed cannot be attributed to direct interactions of the anti-GLT-1 antibody with these targets. We also confirmed that anti-α1, anti-ß1, anti-UQCRC2, or anti-ANT antibodies coimmunoprecipitated GLT-1 after lysates were subjected to a 100,000 × g centrifugation and vice versa (data not shown; n = 3). These studies replicate a recent study showing that the Na+/K+ ATPase interacts with GLT-1 (Rose et al., 2009) and extend the list of interacting proteins to glycolytic enzymes as well as other proteins that may functionally or physically couple to glutamate transport (see Discussion). The fact that 100% of the informative antibodies, i.e., they successfully immunoprecipitated their targets, also coimmunoprecipitated GLT-1 provides further validation of the proteomic analysis.
Figure 2.

Immunoprecipitation of GLT-1 from cortical lysates. Anti-GLT-1 antibody or IgG was used to immunoprecipitate GLT-1 from rat cortical lysates (500 μg protein). In all cases, the lysates were analyzed in the same Western blots; some blots were cropped and lighter exposures of the lysates are shown. Immunoprecipitation of GLT-1 was always confirmed (arrowheads); one exemplar is presented. These data were reproduced in at least three independent experiments.
Figure 3.

Reverse immunoprecipitation of suspected targets. Antibodies against putative interacting proteins were used for immunoprecipitations from rat cortical lysates (500 μg protein). Proteins were extracted from the Protein-A agarose beads without boiling to prevent formation of large molecular weight aggregates of GLT-1 (Haugeto et al., 1996). The bottom row of immunoblots shows the putative target, and the top row shows GLT-1 immunoreactivity (marked with arrowheads). In some cases, the putative interacting protein could not be resolved from IgG dimers (∼100 kDa). In these cases (marked with asterisks), parallel immunoprecipitations were conducted, and the putative interacting protein was extracted with boiling in sample buffer so the IgG migrates at 50 kDa. These data are representative of at least three independent experiments.
It is possible that interactions between GLT-1 and mitochondrial proteins might be due to localization of GLT-1 in mitochondria. In fact, GLAST immunoreactivity colocalizes with cardiomyocyte mitochondria (Ralphe et al., 2004). To address this possibility, standard differential centrifugation was used to test for the presence of GLT-1 in a subcellular fraction enriched in mitochondria. We first confirmed that these fractions were appropriately enriched in markers for each compartment (Fig. 4). As predicted, prohibitin and UQCRC2 were enriched in the washed mitochondrial fraction (12 ± 4 and 3.4 ± 0.6-fold respectively; immunoreactivity was normalized to the amount of protein loaded and expressed relative to crude homogenate). Low levels of PSD-95 were observed in this fraction (0.12 ± 0.03% of immunoreactivity in crude homogenate; mean ± SEM; n = 4), suggesting these are not pure mitochondria. Comparable levels of GLT-1 and the α1 and α2 subunits of the Na+/K+ ATPase were also observed in this fraction (0.06 ± 0.04%, 0.04 ± 0.02%, and 0.01 ± 0.07%, respectively; n = 4). Combined with electron microscopic analyses of immunogold localization of GLT-1 (Chaudhry et al., 1995; Lehre et al., 1995; Melone et al., 2009), these data suggest that GLT-1 is not contained within mitochondria.
Figure 4.
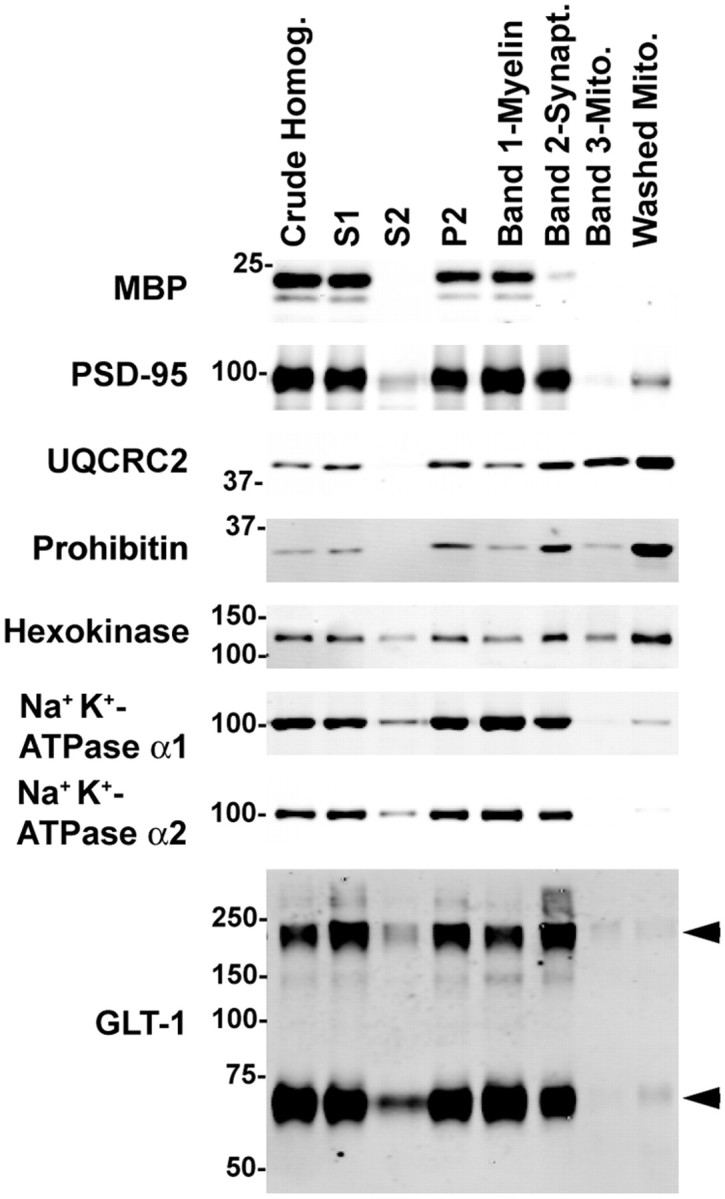
Subcellular distribution of GLT-1 in rat forebrain. Rat forebrain/midbrain was homogenized and fractionated as described in the Materials and Methods. The S1 fraction is the supernatant obtained from a low-speed centrifugation of crude homogenate, the S2 fraction is the supernatant obtained from a higher-speed centrifugation of S1, and P2 is the corresponding pellet from the centrifugation step. Bands 1, 2, and 3 are the fractions obtained after centrifugation of P2 homogenate on a discontinuous Percoll gradient; these fractions should be enriched in myelin, synaptosomes (Synapt.), and mitochondria (Mito.), respectively. Equal amounts of protein from each fraction were analyzed by Western blot (3 μg in all cases except PSD-95 and prohibitin, where 10 μg was loaded). MBP, Myelin basic protein. GLT-1 immunoreactivity is identified with arrowheads. This experiment was repeated in four independent experiments with similar results.
These immunoaffinity experiments suggest that GLT-1 will colocalize with mitochondria via direct or indirect interactions with mitochondrial transmembrane proteins. The possible cocompartmentalization of GLT-1 and mitochondria was tested in vivo by imaging for GLT-1 and UQCRC2, a well-documented inner membrane mitochondrial protein. The distributions of GLT-1 and UQCRC2 were compared in the cortex of adult rats using double-label immunofluorescence (Fig. 5A–D). A fluorescence ICA was used to test for the codistribution of UQCRC2 and GLT-1 (Li et al., 2004). This analysis proposes that colocalized signals will covary in their intensities. Pixel intensities that covary result in a positive product displacement of the mean (PDM) values. A statistically testable ICQ was calculated by taking the number of positive PDM values, dividing by the total number of values, and subtracting 0.5. ICQ values of 0 indicate that there is a random overlap. ICQ values between 0 and −0.5 indicate that the two signals are segregated from one another. ICQ values between 0 and 0.5 indicate that the two signals overlap. Using this approach, there was a significant positive correlation between immunofluorescent signals for GLT-1 and UQCRC2 (ICQ, 0.11 ± 0.03; n = 9; p < 0.005). To reduce the likelihood that this co-localization might be attributed to off-target staining of these antibodies, a different anti-GLT-1 antibody and an anti-ANT antibody were used to test for colocalization in vivo (Fig. 5E–H). In these analyses, there was also a significant positive correlation between immunofluorescent signals for GLT-1 and ANT (ICQ, 0.08 ± 0.009; n = 8; p < 0.0001). Together, these studies show that GLT-1 co-localizes with mitochondria in vivo.
Figure 5.

Cosegregation and colocalization of GLT-1 with mitochondrial proteins in vivo. A, B, Representative images from adult rat cortex immunostained with antibodies directed against GLT-1 (A; green) or UQCRC2 (B; red). C, A merged image of GLT-1 and UQCRC2 immunofluorescence. D, Pseudocolor representation of PDM values for the adjacent image pair, where each pixel is equal to the PDM value at that location. Images with positive PDM value are displayed in yellow, while those with negative values are displayed in violet. E–H, Representative images using a different anti-GLT-1 (green) antibody and anti-ANT (red) antibody. Scale bar, 10 μm.
To complement this approach, astrocytes in hippocampal slice cultures were biolistically cotransfected with plasmids encoding mRFP-GLT-1 and EGFP fused to the mitochondrial targeting sequence of subunit VIII of cytochrome c oxidase, termed Mito-EGFP (Llopis et al., 1998; Wang et al., 2003). Mito-EGFP has been used to study mitochondrial properties and trafficking in several systems, including neurons in biolistically transduced hippocampal slices (for recent studies, see Misko et al., 2010; Ohno et al., 2011). In initial experiments, slices were immunolabeled for GFAP, a commonly used marker for cells of astrocytic lineage (Fig. 6). As was reported previously, all transduced cells in these experiments expressed GFAP, supporting previous observations that this procedure can be used to selectively transduce astrocytes (Benediktsson et al., 2005). Under these conditions, astrocytes retained their characteristic complex, highly stellate morphology with many fine processes (Fig. 6). In these studies, we frequently observed Mito-EGFP fluorescence that extended further than that observed for RFP-GLT-1 (or vice versa), providing additional evidence that GLT-1 is not contained within mitochondria (Fig. 6E–G, arrows).
Figure 6.

Colocalization of mitochondria and GLT-1 in the processes of astrocytes in hippocampal slice cultures. A–C, Representative images of astrocytes in slice culture transfected with the cDNA encoding mRFP-GLT-1 (A; red) and immunostained for glial fibrillary acidic protein (B; GFAP; green) and merged images (C) demonstrate that transfected cells express the astrocytic marker GFAP. GFAP does not, however, occupy a substantial portion of the astrocytic volume. Scale bar, 25 μm. D, Low-magnification view of an astrocyte in slice culture cotransfected with cDNAs encoding mRFP-GLT-1 (red) and Mito-EGFP (green). E–G, Binary, higher-magnification view (E) of the astrocyte process highlighted in D (white box) and from other astrocytes (F, G). Colocalized pixels are indicated in white. White arrows highlight areas where there is not complete overlap of GLT-1 with mitochondria.
GLT-1 puncta were frequently overlapped by mitochondria and vice versa. Across all of our observations, the probability of overlap was 72.1% (95% CI; 66.5, 77.9) for GLT1 by mitochondria and 75.4% (95% CI; 69.1, 81.2) for mitochondria by GLT1. The length of each process (48 ± 3 μm; n = 48, from 11 different cells analyzed from eight independent experiments), the sizes (lengths) of GLT-1 puncta (2.6 ± 0.1 μm; n = 354), and the lengths of the mitochondria (3.7 ± 0.2 μm; n = 276) were examined. The average densities of GLT-1 and mitochondria (i.e., the portion of the process covered by either particle) were similar: 0.42 ± 0.17 and 0.45 ± 0.18, respectively. The probability that two particles overlap by chance increases as a function of the length of the process that is occupied by mitochondria and/or GLT-1. Therefore, a weighted percentage overlap giving higher weight to those processes with the least fractional occupancy by mitochondria/GLT-1 is also reported (see Materials and Methods). Using this approach, we observed that 59.7% of GLT-1 puncta (95% CI; 50.8, 70.9; p = 0.001, empirical p value from Monte Carlo simulations; see Materials and Methods) were overlapped by mitochondria, while 72.7% (95% CI; 62.7, 82.2; p = 0.0023, empirical p value) of mitochondria were overlapped by GLT-1. Therefore, we conclude that the overlap of GLT-1 by mitochondria and the overlap of mitochondria by GLT-1 was unlikely to have occurred by chance alone; this observation is consistent with the hypothesis that a physical interaction cocompartmentalizes mitochondria with GLT-1.
The anti-hexokinase antibody was not suitable for immunoprecipitations (see Results), but hexokinase I is thought to constitutively associate with the outer mitochondrial membrane in brain (Polakis and Wilson, 1985). As others have used fluorescently tagged hexokinase to visualize this interaction (Sui and Wilson, 1997), organotypic slice cultures were transduced with GFP-tagged hexokinase-1 (hexokinase-1-EGFP) and DsRed2-mito to determine whether hexokinase associates with mitochondria in astrocytes. The volume of each particle labeled with DsRed2-mito was smaller than that observed with hexokinase-1-EGFP, consistent with previous data showing that hexokinase is a peripheral membrane protein associated with the outer mitochondrial membrane (Fig. 7). We found that the fluorescence from hexokinase-1-EGFP overlaps that of the mitochondrially targeted DsRed2 100% of the time (results from 195 mitochondria in 21 processes from four astrocytes). We also tested for distribution of hexokinase-1-EGFP and RFP-GLT-1; as predicted, there was substantial overlap (Fig. 7G–L). Together these studies provide strong evidence for cocompartmentalization of the first step of glycolysis, mitochondria, and GLT-1.
Figure 7.
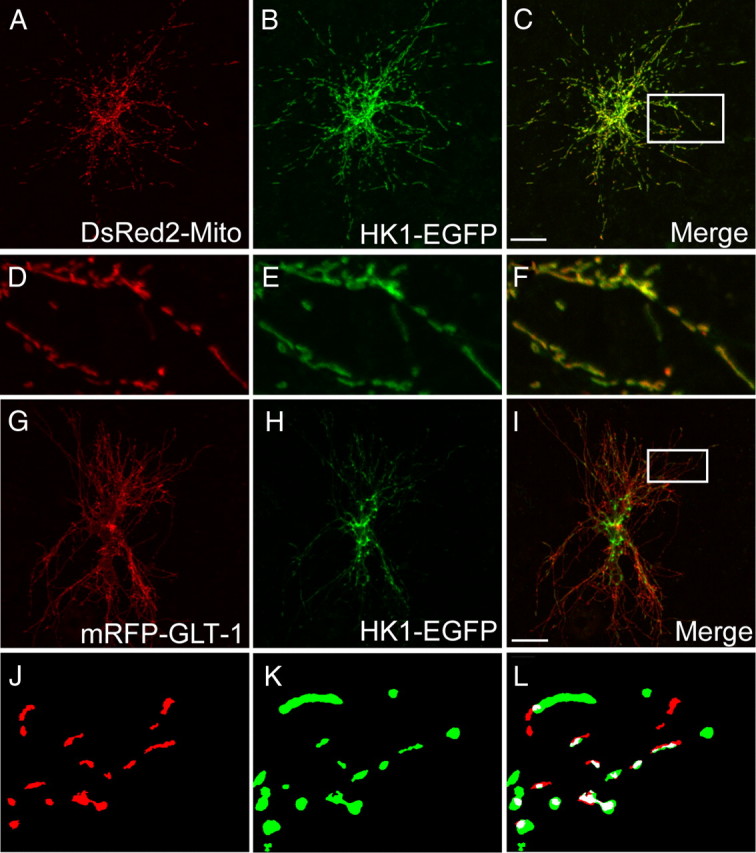
Colocalization of hexokinase-1-EGFP with mitochondria or GLT-1 in the processes of astrocytes in hippocampal slice cultures. A–C, Low-magnification images of an astrocyte in slice culture transfected with the cDNAs encoding DsRed2-mito (red; A) and hexokinase-1-EGFP (HK1-EGFP) (green; B) and merged image (C). D–F, Higher-magnification views of the astrocyte process highlighted in C (white box). Hexokinase-1 overlapped with DsRed2-mito 100% of the time (195 mitochondria in 21 processes from 4 astrocytes). G–I, Low-magnification images of an astrocyte in slice culture transfected with the cDNAs encoding mRFP-GLT-1 (red; G) and HK1-EGFP (green; H) and merged image (I). J–L, Higher-magnification binary views of the astrocyte process highlighted in I (white box). Colocalized pixels are indicated in white. Scale bars, 25 μm.
Based on these analyses, we examined the sensitivity of glutamate transport activity to mitochondrial uncoupling using FCCP and to inhibition of glycolysis using 2-deoxyglucose (2-DOG). These studies were performed with short pre-incubations (5 min) using transverse hippocampal slices. In parallel experiments, we examined the sensitivity of transport to inhibition of the Na+/K+ ATPase using ouabain. As might be expected, ouabain inhibited TBOA-sensitive glutamate accumulation to ∼20% of control (Fig. 8). Neither FCCP nor 2-DOG inhibited glutamate transport alone, but the combination reduced glutamate transport to 44% of control. These observations show that acute inhibition of mitochondrial function or glycolysis is not sufficient to impair transport, but the combination can reduce the driving forces for glutamate clearance.
Figure 8.

Effects of FCCP, deoxyglucose, or ouabain on glutamate uptake in transverse hippocampal slices. Transverse hippocampal slices were prepared and maintained as described in Materials and Methods. After equilibration, slices were preincubated with ouabain (100 μm), FCCP (1 μm), 2-DOG (10 mm), or a combination of FCCP and 2-DOG for 5 min. All of these incubations were done in the presence or absence of TBOA (1 mm). The slices were transferred to fresh medium containing l-[3H]-glutamate (100 μm) and the same drugs and incubated for 15 min. Slices were placed on a filter paper and rinsed twice with ice-cold buffer. TBOA-sensitive accumulation was expressed as a percentage of that observed in vehicle-treated slices (% of control). Data are the mean ± SEM of five independent observations and were compared by ANOVA. **p < 0.01; ***p < 0.001.
Discussion
In the current study, proteins in GLT-1 immunoisolates were identified by mass spectrometry. Several of the proteins identified have been physically/functionally linked to one another and/or to glutamate transport. For example, interactions with AP2 and dynamin are consistent with previous observations showing that dominant-negative constructs of dynamin or inhibition of clathrin-mediated endocytosis block trafficking of GLT-1 (Zhou and Sutherland, 2004; Susarla and Robinson, 2008). The Na+/K+ ATPase colocalizes with GLT-1 in vivo (Cholet et al., 2002; Rose et al., 2009). Rose et al. (2009) previously purified the Na+/K+ ATPase from brain and analyzed the resulting complexes by mass spectrometry. GLT-1 was among the proteins identified along with several of the proteins observed in the current analysis, including ANT1, GAPDH, pyruvate carboxylase, synapsin 1, and prohibitin. It has been suggested that ANT shuttles ATP to the Na+/K+ ATPase to support glutamate transport (Buck et al., 2003). Glycolytic enzymes have been linked to the Na+/K+ ATPase in peripheral blood cells (Mercer and Dunham, 1981). Finally, hexokinase interacts with the outer mitochondrial membrane protein, VDAC (Sui and Wilson, 1997; Abu-Hamad et al., 2008), and VDAC interacts with the inner mitochondrial membrane protein ANT (Beutner et al., 1998; Crompton et al., 1998).
Astroglial glutamate transport maintains crisp excitatory signaling and limits glutamate toxicity (Danbolt, 2001). In fact, it can support glutamate clearance even after a burst of high-frequency stimulation (Diamond and Jahr, 2000). Considering the spatial restriction of fine astrocytic processes, it is important to understand the mechanisms that support these energetic demands (for review, see Marcaggi and Attwell, 2004). Although it was originally thought that the small diameter of astrocytic processes restricted entry of organelles such as mitochondria, mitochondria are found in these fine processes (Grosche et al., 1999; Lovatt et al., 2007; Oberheim et al., 2009). Although there are some examples of immunogold labeled GLT-1 existing within nanometers of mitochondria in vivo (Xu et al., 2003; Bezzi et al., 2004), this has not been systematically examined. We found that GLT-1 codistributes with mitochondria in rat cortex, and fluorescently tagged GLT-1 overlapped with mitochondria in hippocampal slices. In this same system, hexokinase-1, the enzyme that mediates the first step in glycolysis, overlapped with GLT-1 or mitochondria, consistent with previous studies (Polakis and Wilson, 1985). In total, six glycolytic enzymes and the astrocyte-specific enzyme, glycogen phosphorylase, were identified in complexes with GLT-1. Together, these studies provide evidence for a cocompartmentalization of GLT-1, mitochondria, and glycolysis.
This cocompartmentalization could explain previously observed functional studies. For example, glutamate uptake results in an increase in mitochondrial Na+ levels (Bernardinelli et al., 2006). Glutamate uptake is also accompanied by rapid mitochondrial acidification and decreased mitochondria oxygen consumption in cultured astrocytes (Azarias et al., 2011). These studies imply that mitochondria buffer the ionic changes associated with transporter function. Glutamate uptake also triggers astrocytic glycolysis in both astrocyte cultures and hippocampal slices (Pellerin and Magistretti, 1994; Loaiza et al., 2003; Bittner et al., 2011).
In the present study, an inhibitor of glycolysis had no effect on glutamate uptake, nor did a mitochondrial uncoupler, but the combination caused a significant reduction in glutamate uptake. Interestingly, Sickmann et al. (2009) demonstrated that inhibition of glycogen phosphorylase, an enzyme observed in the current proteomic analyses, reduces glutamate uptake, even in the presence of glucose, suggesting that the glucose and subsequent ATP derived from glycogen can be preferentially shuttled to drive glutamate uptake. Together, these data suggest that glutamate transport can be independently fueled by several different sources in local compartments. Given the importance of glutamate clearance to essentially all aspects of brain function, the notion that transport may be locally supported by either glycolysis or oxidative phosphorylation is not particularly surprising.
Some of the previously observed GLT-1 interacting proteins were not identified, including the LIM protein Ajuba (Marie et al., 2002), protein interacting with C kinase (PICK1) (Bassan et al., 2008), PSD-95 (González-González et al., 2008), Gps1, a subunit of the COP9 signalosome (Watanabe and Rothstein, 2002), protein kinase Cα (González et al., 2005), and membrane-associated guanylate kinase with inverted orientation-1 (Zou et al., 2011). This approach sometimes fails to identify known interactions because of abundance, affinity of the interaction, or failure to identify certain peptides by mass spectrometry (Baldwin, 2004). In fact, similar negative results have been encountered in previous studies. For example, some proteins known to interact with the NMDA receptor or with β-arrestins are not detected by proteomic approaches (Husi et al., 2000; Xiao et al., 2007). As PICK1 interacts with a variant of GLT-1 that would not be immunoprecipitated with the anti-GLT-1 antibody used in the current analysis, the absence of this protein is not unexpected.
Proteomic analyses ideally provide models of macromolecular complexes that might exist in vivo. Some of the proteins identified are only expressed in subsets of the cells that express GLT-1, suggesting that different cellular pools of GLT-1 may exist in different complexes. For example, two oligodendroglial proteins, CNPase and myelin proteolipid protein, were identified (Pitt et al., 2003; Vinet et al., 2010). Similarly, synapsin and the α3 subunit of the Na+/K+ ATPase are thought to be restricted to neurons (Evergren et al., 2007; Cahoy et al., 2008; Melone et al., 2009) (but see Wang et al., 2011). The notion that GLT-1 may cocompartmentalize with the α3 subunit of the ATPase is supported by a recent study that shows their colocalization (Rose et al., 2009). Finally, pyruvate carboxylase and glycogen phosphorylase are specifically expressed in astrocytes (Pfeiffer et al., 1992; Berkich et al., 2007; Lovatt et al., 2007). Subcellular pools of GLT-1 may also exist in distinct complexes. For instance, cytoskeletal elements were identified, suggesting that these proteins may be involved in tethering GLT-1 at the plasma membrane. In addition, trafficking molecules such as AP2 and dynamin-1 were identified.
It is theoretically possible for GLT-1 to localize to mitochondria; however, several different studies provide strong evidence that this does not occur. Essentially no GLT-1 immunoreactivity is observed in mitochondria isolated from rat forebrain. A substantial fraction of RFP-tagged GLT-1 puncta only partially overlaps with GFP expressed in mitochondria (Mito-EGFP). If GLT-1 were targeted to mitochondria, one would expect complete overlap. Finally, no GLT-1 is observed in mitochondria in brain using electron microscopy with several different anti-GLT-1 antibodies (Chaudhry et al., 1995; Lehre et al., 1995; Melone et al., 2009).
Mitochondria are not uniformly distributed in neural tissue where long process-bearing cells require spatial matching to support local energy demands and requirements for ion buffering. Within neurons, there are both static and dynamic mitochondria (for review, see MacAskill and Kittler, 2009). For example, mitochondria dock near synapses by a mechanism that involves adaptor proteins (miroGTPase and mitofusin-2) and kinesins (MacAskill et al., 2009; Wang and Schwarz, 2009). Mitochondria also accumulate at nodes of Ranvier during periods of axonal activation (Zhang et al., 2010; Ohno et al., 2011). We have not found any studies that have examined the mobility of mitochondria in process-bearing astrocytes (i.e., other than studies performed in polygonal shaped astrocytes in culture).
A physical interaction between plasma membrane GLT-1 and proteins found within mitochondria would require intermediary bridge proteins, including cytoplasmic proteins. Assuming that the proteins linking mitochondria to GLT-1 were detected in the current study, the simplest model involves an interaction with hexokinase or dynamin-1-like protein; both of these are cytoplasmic proteins that associate with proteins in the outer mitochondrial membrane (Fig. 9). Hexokinase interacts with VDAC (Sui and Wilson, 1997; Abu-Hamad et al., 2008), VDAC in turn interacts with the ANT (Beutner et al., 1998; Crompton et al., 1998), and ANT interacts with the mitochondrial matrix protein prohibitin (for review, see Osman et al., 2009). As indicated in the previous paragraph, mitofusin and/or kinesins have been implicated in docking of mitochondria. Although kinesins or mitofusin were not identified in the current analysis, stomatin-like protein-2 (known to interact with mitofusin) was observed (Hajek et al., 2007). Therefore, it is also possible that mitofusin is required for interaction of mitochondria with the transporter, but this has not been examined. As the Na+/K+ ATPase maintains the plasma membrane Na+ gradient required for a large family of Na+ symport systems, it seems possible that GLT-1 interacts with the ATPase and the ATPase interacts with cytoplasmic proteins that interact with mitochondria, but this has not been tested. This could mean that glycolytic enzymes and mitochondria are available to fuel active transport systems in a variety of cells.
Figure 9.
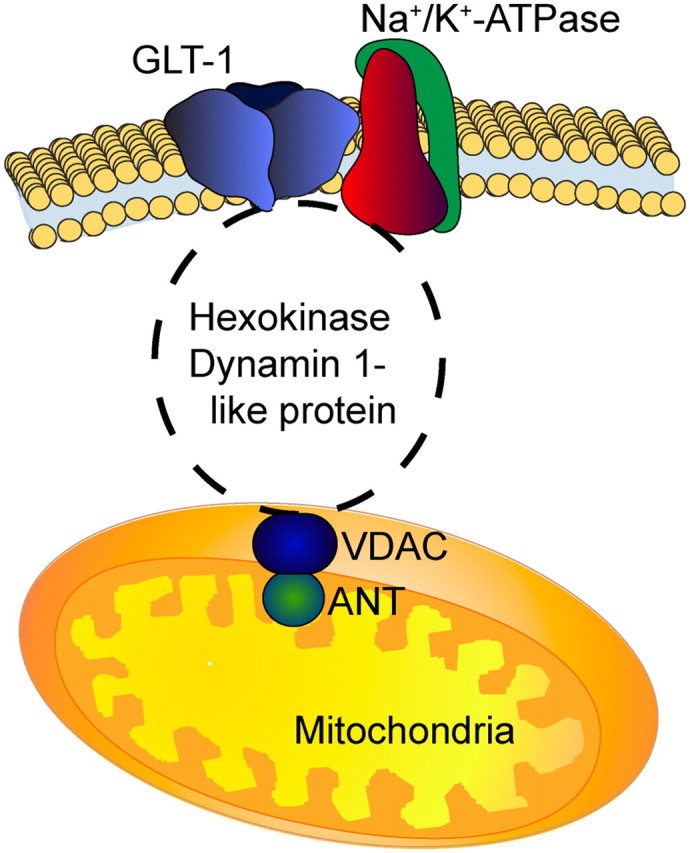
Model for potential linkage between GLT-1, Na+/K+ ATPase, glycolytic enzymes, and mitochondrial proteins. GLT-1 and the Na+/K+ ATPase are localized to the plasma membrane. Many of the glycolytic enzymes are cytoplasmic. Hexokinase and dynamin-like protein 1 are cytosolic proteins that associate with the outer mitochondrial membrane. VDAC spans the outer mitochondrial membrane. ANT1 spans the inner mitochondrial membrane.
In summary, both astroglial glutamate transporters, GLT-1 and GLAST, are preferentially targeted to fine astrocytic processes and enriched near synapses (Chaudhry et al., 1995; Lehre et al., 1995). Given the spatial restrictions of these processes and the accompanying limitations of diffusion, it seems reasonable that the energetic demands imposed by the transporters are supported locally. In the present study, we provide evidence for interactions between GLT-1 and the major sources of fuel required to support uptake, including the Na+/K+ ATPase, glycolytic enzymes, and mitochondria. Finally, we provide evidence that either glycolysis or oxidative phosphorylation are sufficient to support transport, but that when both are inhibited, glutamate transport is severely compromised. This cocompartmentalization identifies a mechanism to spatially support the energetic demands of transport (ATP and the Na+ gradient). It also matches the buffering capacity of mitochondria to the influx of Na+ and H+ that accompanies each cycle of transport.
Footnotes
This work was supported by the Institutional Intellectual and Developmental Disabilities Research Center (P30 HD26979), including the Biostatistics and Bioinformatics Core, the Analytical Neurochemistry Core, the Genetics Core, and the Cellular Neuroscience Core. We thank Michael Rosenblatt for his help with the initial mass spectrometry experiments; Drs. Douglas Coulter, Hajime Takano, and Matthew Dalva for helpful discussion and interpretation of imaging experiments; and Carolynne Geragosian for performing some of the immunoprecipitations. We also thank members of the Robinson laboratory for their advice and suggestions during the conduct of this research.
References
- Abu-Hamad S, Zaid H, Israelson A, Nahon E, Shoshan-Barmatz V. Hexokinase-I protection against apoptotic cell death is mediated via interaction with the voltage-dependent anion channel-1: mapping the site of binding. J Biol Chem. 2008;283:13482–13490. doi: 10.1074/jbc.M708216200. [DOI] [PubMed] [Google Scholar]
- Azarias G, Perreten H, Lengacher S, Poburko D, Demaurex N, Magistretti PJ, Chatton JY. Glutamate transport decreases mitochondrial pH and modulates oxidative metabolism in astrocytes. J Neurosci. 2011;31:3550–3559. doi: 10.1523/JNEUROSCI.4378-10.2011. [DOI] [PMC free article] [PubMed] [Google Scholar]
- Baldwin MA. Protein identification by mass spectrometry: issues to be considered. Mol Cell Proteomics. 2004;3:1–9. doi: 10.1074/mcp.R300012-MCP200. [DOI] [PubMed] [Google Scholar]
- Balgley BM, Laudeman T, Yang L, Song T, Lee CS. Comparative evaluation of tandem MS search algorithms using a target-decoy search strategy. Mol Cell Proteomics. 2007;6:1599–1608. doi: 10.1074/mcp.M600469-MCP200. [DOI] [PubMed] [Google Scholar]
- Bassan M, Liu H, Madsen KL, Armsen W, Zhou J, Desilva T, Chen W, Paradise A, Brasch MA, Staudinger J, Gether U, Irwin N, Rosenberg PA. Interaction between the glutamate transporter GLT1b and the synaptic PDZ domain protein PICK1. Eur J Neurosci. 2008;27:66–82. doi: 10.1111/j.1460-9568.2007.05986.x. [DOI] [PMC free article] [PubMed] [Google Scholar]
- Benediktsson AM, Schachtele SJ, Green SH, Dailey ME. Ballistic labeling and dynamic imaging of astrocytes in organotypic hippocampal slice cultures. J Neurosci Methods. 2005;141:41–53. doi: 10.1016/j.jneumeth.2004.05.013. [DOI] [PubMed] [Google Scholar]
- Berkich DA, Ola MS, Cole J, Sweatt AJ, Hutson SM, LaNoue KF. Mitochondrial transport proteins of the brain. J Neurosci Res. 2007;85:3367–3377. doi: 10.1002/jnr.21500. [DOI] [PubMed] [Google Scholar]
- Bernardinelli Y, Azarias G, Chatton JY. In situ fluorescence imaging of glutamate-evoked mitochondrial Na+ responses in astrocytes. Glia. 2006;54:460–470. doi: 10.1002/glia.20387. [DOI] [PubMed] [Google Scholar]
- Beutner G, Ruck A, Riede B, Brdiczka D. Complexes between porin, hexokinase, mitochondrial creatine kinase and adenylate translocator display properties of the permeability transition pore. Implication for regulation of permeability transition by the kinases. Biochim Biophys Acta. 1998;1368:7–18. doi: 10.1016/s0005-2736(97)00175-2. [DOI] [PubMed] [Google Scholar]
- Bezzi P, Gundersen V, Galbete JL, Seifert G, Steinhauser C, Pilati E, Volterra A. Astrocytes contain a vesicular compartment that is competent for regulated exocytosis of glutamate. Nat Neurosci. 2004;7:613–620. doi: 10.1038/nn1246. [DOI] [PubMed] [Google Scholar]
- Bittner CX, Valdebenito R, Ruminot I, Loaiza A, Larenas V, Sotelo-Hitschfeld T, Moldenhauer H, San Martin A, Gutierrez R, Zambrano M, Barros LF. Fast and reversible stimulation of astrocytic glycolysis by k+ and a delayed and persistent effect of glutamate. J Neurosci. 2011;31:4709–4713. doi: 10.1523/JNEUROSCI.5311-10.2011. [DOI] [PMC free article] [PubMed] [Google Scholar]
- Buck CR, Jurynec MJ, Gupta DK, Law AK, Bilger J, Wallace DC, McKeon RJ. Increased adenine nucleotide translocator 1 in reactive astrocytes facilitates glutamate transport. Exp Neurol. 2003;181:149–158. doi: 10.1016/s0014-4886(03)00043-8. [DOI] [PMC free article] [PubMed] [Google Scholar]
- Cahoy JD, Emery B, Kaushal A, Foo LC, Zamanian JL, Christopherson KS, Xing Y, Lubischer JL, Krieg PA, Krupenko SA, Thompson WJ, Barres BA. A transcriptome database for astrocytes, neurons, and oligodendrocytes: a new resource for understanding brain development and function. J Neurosci. 2008;28:264–278. doi: 10.1523/JNEUROSCI.4178-07.2008. [DOI] [PMC free article] [PubMed] [Google Scholar]
- Chaudhry FA, Lehre KP, Campagne MVL, Ottersen OP, Danbolt NC, Storm-Mathisen J. Glutamate transporters in glial plasma membranes: Highly differentiated localizations revealed by quantitative ultrastructural immunocytochemistry. Neuron. 1995;15:711–720. doi: 10.1016/0896-6273(95)90158-2. [DOI] [PubMed] [Google Scholar]
- Chen ZW, Olsen RW. GABAA receptor associated proteins: a key factor regulating GABAA receptor function. J Neurochem. 2007;100:279–294. doi: 10.1111/j.1471-4159.2006.04206.x. [DOI] [PubMed] [Google Scholar]
- Choi DW. Excitotoxic cell death. J Neurobiol. 1992;23:1261–1276. doi: 10.1002/neu.480230915. [DOI] [PubMed] [Google Scholar]
- Cholet N, Pellerin L, Magistretti PJ, Hamel E. Similar perisynaptic glial localization for the Na+,K+-ATPase a2 subunit and the glutamate transporters GLAST and GLT-1 in the rat somatosensory cortex. Cereb Cortex. 2002;12:515–525. doi: 10.1093/cercor/12.5.515. [DOI] [PubMed] [Google Scholar]
- Conti F, Weinberg RJ. Shaping excitation at glutamatergic synapses. Trends Neurosci. 1999;22:451–458. doi: 10.1016/s0166-2236(99)01445-9. [DOI] [PubMed] [Google Scholar]
- Crompton M, Virji S, Ward JM. Cyclophilin-D binds strongly to complexes of the voltage-dependent anion channel and the adenine nucleotide translocase to form the permeability transition pore. Eur J Biochem. 1998;258:729–735. doi: 10.1046/j.1432-1327.1998.2580729.x. [DOI] [PubMed] [Google Scholar]
- Danbolt NC. Glutamate uptake. Prog Neurobiol. 2001;65:1–105. doi: 10.1016/s0301-0082(00)00067-8. [DOI] [PubMed] [Google Scholar]
- de Brito OM, Scorrano L. Mitofusin 2 tethers endoplasmic reticulum to mitochondria. Nature. 2008;456:605–610. doi: 10.1038/nature07534. [DOI] [PubMed] [Google Scholar]
- Diamond JS, Jahr CE. Synaptically released glutamate does not overwhelm transporters on hippocampal astrocytes during high-frequency stimulation. J Neurophysiol. 2000;83:2835–2843. doi: 10.1152/jn.2000.83.5.2835. [DOI] [PubMed] [Google Scholar]
- Domon B, Aebersold R. Mass spectrometry and protein analysis. Science. 2006;312:212–217. doi: 10.1126/science.1124619. [DOI] [PubMed] [Google Scholar]
- Dowd LA, Coyle AJ, Rothstein JD, Pritchett DB, Robinson MB. Comparison of Na+-dependent glutamate transport activity in synaptosomes, C6 glioma, and Xenopus oocytes expressing excitatory amino acid carrier 1 (EAAC1) Mol Pharmacol. 1996;49:465–473. [PubMed] [Google Scholar]
- Evergren E, Benfenati F, Shupliakov O. The synapsin cycle: a view from the synaptic endocytic zone. J Neurosci Res. 2007;85:2648–2656. doi: 10.1002/jnr.21176. [DOI] [PubMed] [Google Scholar]
- Garcia-Perez C, Hajnoczky G, Csordas G. Physical coupling supports the local Ca2+ transfer between sarcoplasmic reticulum subdomains and the mitochondria in heart muscle. J Biol Chem. 2008;283:32771–32780. doi: 10.1074/jbc.M803385200. [DOI] [PMC free article] [PubMed] [Google Scholar]
- González MI, Susarla BTS, Robinson MB. Evidence that protein kinase Ca interacts with an regulates the glial glutamate transporter GLT-1. J Neurochem. 2005;94:1180–1188. doi: 10.1111/j.1471-4159.2005.03330.x. [DOI] [PubMed] [Google Scholar]
- González-González IM, Garcia-Tardon N, Cubelos B, Gimenez C, Zafra F. The glutamate transporter GLT1b interacts with the scaffold protein PSD-95. J Neurochem. 2008;105:1834–1848. doi: 10.1111/j.1471-4159.2008.05281.x. [DOI] [PubMed] [Google Scholar]
- Grosche J, Matyash V, Moller T, Verkhratsky A, Reichenbach A, Kettenmann H. Microdomains for neuron-glia interaction: parallel fiber signaling to Bergmann glial cells. Nat Neurosci. 1999;2:139–143. doi: 10.1038/5692. [DOI] [PubMed] [Google Scholar]
- Hajek P, Chomyn A, Attardi G. Identification of a novel mitochondrial complex containing mitofusin 2 and stomatin-like protein 2. J Biol Chem. 2007;282:5670–5681. doi: 10.1074/jbc.M608168200. [DOI] [PubMed] [Google Scholar]
- Haugeto Ø, Ullensveng K, Levy LM, Chaudhry FA, Honore T, Neilsen M, Lehre KP, Danbolt NC. Brain glutamate transporter proteins form homomultimers. J Biol Chem. 1996;271:27715–27722. doi: 10.1074/jbc.271.44.27715. [DOI] [PubMed] [Google Scholar]
- Herman MA, Jahr CE. Extracellular glutamate concentration in hippocampal slice. J Neurosci. 2007;27:9736–9741. doi: 10.1523/JNEUROSCI.3009-07.2007. [DOI] [PMC free article] [PubMed] [Google Scholar]
- Huang da W, Sherman BT, Lempicki RA. Systematic and integrative analysis of large gene lists using DAVID bioinformatics resources. Nat Protoc. 2009;4:44–57. doi: 10.1038/nprot.2008.211. [DOI] [PubMed] [Google Scholar]
- Huang Y, Zuo Z. Isoflurane induces a protein kinase Ca-dependent increase in cell surface protein level and activity of glutamate transporter type 3. Mol Pharmacol. 2005;67:1522–1533. doi: 10.1124/mol.104.007443. [DOI] [PubMed] [Google Scholar]
- Husi H, Ward MA, Choudhary JS, Blackstock WP, Grant SG. Proteomic analysis of NMDA receptor-adhesion protein signaling complexes. Nat Neurosci. 2000;3:661–669. doi: 10.1038/76615. [DOI] [PubMed] [Google Scholar]
- Kabbani N, Woll MP, Levenson R, Lindstrom JM, Changeux JP. Intracellular complexes of the beta2 subunit of the nicotinic acetylcholine receptor in brain identified by proteomics. Proc Natl Acad Sci U S A. 2007;104:20570–20575. doi: 10.1073/pnas.0710314104. [DOI] [PMC free article] [PubMed] [Google Scholar]
- Kayser MS, McClelland AC, Hughes EG, Dalva MB. Intracellular and trans-synaptic regulation of glutamatergic synaptogenesis by EphB receptors. J Neurosci. 2006;26:12152–12164. doi: 10.1523/JNEUROSCI.3072-06.2006. [DOI] [PMC free article] [PubMed] [Google Scholar]
- Keller A, Nesvizhskii AI, Kolker E, Aebersold R. Empirical statistical model to estimate the accuracy of peptide identifications made by MS/MS and database search. Anal Chem. 2002;74:5383–5392. doi: 10.1021/ac025747h. [DOI] [PubMed] [Google Scholar]
- Lehre KP, Danbolt NC. The number of glutamate transporter subtype molecules at glutamatergic synapses: chemical and stereological quantification in young adult rat brain. J Neurosci. 1998;18:8751–8757. doi: 10.1523/JNEUROSCI.18-21-08751.1998. [DOI] [PMC free article] [PubMed] [Google Scholar]
- Lehre KP, Levy LM, Ottersen OP, Storm-Mathisen J, Danbolt NC. Differential expression of two glial glutamate transporters in the rat brain: quantitative and immunocytochemical observations. J Neurosci. 1995;15:1835–1853. doi: 10.1523/JNEUROSCI.15-03-01835.1995. [DOI] [PMC free article] [PubMed] [Google Scholar]
- Levitan IB. Signaling protein complexes associated with neuronal ion channels. Nat Neurosci. 2006;9:305–310. doi: 10.1038/nn1647. [DOI] [PubMed] [Google Scholar]
- Li Q, Lau A, Morris TJ, Guo L, Fordyce CB, Stanley EF. A syntaxin 1, Galpha(o), and N-type calcium channel complex at a presynaptic nerve terminal: analysis by quantitative immunocolocalization. J Neurosci. 2004;24:4070–4081. doi: 10.1523/JNEUROSCI.0346-04.2004. [DOI] [PMC free article] [PubMed] [Google Scholar]
- Llopis J, McCaffery JM, Miyawaki A, Farquhar MG, Tsien RY. Measurement of cytosolic, mitochondrial, and Golgi pH in single living cells with green fluorescent proteins. Proc Natl Acad Sci U S A. 1998;95:6803–6808. doi: 10.1073/pnas.95.12.6803. [DOI] [PMC free article] [PubMed] [Google Scholar]
- Loaiza A, Porras OH, Barros LF. Glutamate triggers rapid glucose transport stimulation in astrocytes as evidenced by real-time confocal microscopy. J Neurosci. 2003;23:7337–7342. doi: 10.1523/JNEUROSCI.23-19-07337.2003. [DOI] [PMC free article] [PubMed] [Google Scholar]
- Lovatt D, Sonnewald U, Waagepetersen HS, Schousboe A, He W, Lin JH, Han X, Takano T, Wang S, Sim FJ, Goldman SA, Nedergaard M. The transcriptome and metabolic gene signature of protoplasmic astrocytes in the adult murine cortex. J Neurosci. 2007;27:12255–12266. doi: 10.1523/JNEUROSCI.3404-07.2007. [DOI] [PMC free article] [PubMed] [Google Scholar]
- Lowry OH, Rosenberg NJ, Farr AL, Randall RJ. Protein measurement with the Folin phenol reagent. J Biol Chem. 1951;193:265–275. [PubMed] [Google Scholar]
- MacAskill AF, Kittler JT. Control of mitochondrial transport and localization in neurons. Trends Cell Biol. 2009;20:102–112. doi: 10.1016/j.tcb.2009.11.002. [DOI] [PubMed] [Google Scholar]
- MacAskill AF, Rinholm JE, Twelvetrees AE, Arancibia-Carcamo IL, Muir J, Fransson A, Aspenstrom P, Attwell D, Kittler JT. Miro1 is a calcium sensor for glutamate receptor-dependent localization of mitochondria at synapses. Neuron. 2009;61:541–555. doi: 10.1016/j.neuron.2009.01.030. [DOI] [PMC free article] [PubMed] [Google Scholar]
- Mandela P, Ordway GA. The norepinephrine transporter and its regulation. J Neurochem. 2006;97:310–333. doi: 10.1111/j.1471-4159.2006.03717.x. [DOI] [PubMed] [Google Scholar]
- Marcaggi P, Attwell D. Role of glial amino acid transporters in synaptic transmission and brain energetics. Glia. 2004;47:217–225. doi: 10.1002/glia.20027. [DOI] [PubMed] [Google Scholar]
- Marie H, Billups D, Bedford FK, Dumoulin A, Goyal RK, Longmore GD, Moss SJ, Attwell D. The amino terminus of the glial glutamate transporter GLT-1 interacts with the LIM protein Ajuba. Mol Cell Neurosci. 2002;19:152–164. doi: 10.1006/mcne.2001.1066. [DOI] [PubMed] [Google Scholar]
- McAllister AK. Biolistic transfection of cultured organotypic brain slices. Methods Mol Biol. 2004;245:197–206. doi: 10.1385/1-59259-649-5:197. [DOI] [PubMed] [Google Scholar]
- Melone M, Bellesi M, Conti F. Synaptic localization of GLT-1a in the rat somatic sensory cortex. Glia. 2009;57:108–117. doi: 10.1002/glia.20744. [DOI] [PubMed] [Google Scholar]
- Mercer RW, Dunham PB. Membrane-bound ATP fuels the Na/K pump. Studies on membrane-bound glycolytic enzymes on inside-out vesicles from human red cell membranes. J Gen Physiol. 1981;78:547–568. doi: 10.1085/jgp.78.5.547. [DOI] [PMC free article] [PubMed] [Google Scholar]
- Misko A, Jiang S, Wegorzewska I, Milbrandt J, Baloh RH. Mitofusin 2 is necessary for transport of axonal mitochondria and interacts with the Miro/Milton complex. J Neurosci. 2010;30:4232–4240. doi: 10.1523/JNEUROSCI.6248-09.2010. [DOI] [PMC free article] [PubMed] [Google Scholar]
- Muller CS, Haupt A, Bildl W, Schindler J, Knaus HG, Meissner M, Rammner B, Striessnig J, Flockerzi V, Fakler B, Schulte U. Quantitative proteomics of the Cav2 channel nano-environments in the mammalian brain. Proc Natl Acad Sci U S A. 2010;107:14950–14957. doi: 10.1073/pnas.1005940107. [DOI] [PMC free article] [PubMed] [Google Scholar]
- Nesvizhskii AI, Keller A, Kolker E, Aebersold R. A statistical model for identifying proteins by tandem mass spectrometry. Anal Chem. 2003;75:4646–4658. doi: 10.1021/ac0341261. [DOI] [PubMed] [Google Scholar]
- Oberheim NA, Takano T, Han X, He W, Lin JH, Wang F, Xu Q, Wyatt JD, Pilcher W, Ojemann JG, Ransom BR, Goldman SA, Nedergaard M. Uniquely hominid features of adult human astrocytes. J Neurosci. 2009;29:3276–3287. doi: 10.1523/JNEUROSCI.4707-08.2009. [DOI] [PMC free article] [PubMed] [Google Scholar]
- Ohno N, Kidd GJ, Mahad D, Kiryu-Seo S, Avishai A, Komuro H, Trapp BD. Myelination and axonal electrical activity modulate the distribution and motility of mitochondria at CNS nodes of Ranvier. J Neurosci. 2011;31:7249–7258. doi: 10.1523/JNEUROSCI.0095-11.2011. [DOI] [PMC free article] [PubMed] [Google Scholar]
- Osman C, Merkwirth C, Langer T. Prohibitins and the functional compartmentalization of mitochondrial membranes. J Cell Sci. 2009;122:3823–3830. doi: 10.1242/jcs.037655. [DOI] [PubMed] [Google Scholar]
- Pellerin L, Magistretti PJ. Glutamate uptake into astrocytes stimulates aerobic glycolysis: a mechanism coupling neuronal activity to glucose utilization. Proc Natl Acad Sci U S A. 1994;91:10625–10629. doi: 10.1073/pnas.91.22.10625. [DOI] [PMC free article] [PubMed] [Google Scholar]
- Pfeiffer B, Meyermann R, Hamprecht B. Immunohistochemical co-localization of glycogen phosphorylase with the astroglial markers glial fibrillary acidic protein and S-100 protein in rat brain sections. Histochemistry. 1992;97:405–412. doi: 10.1007/BF00270387. [DOI] [PubMed] [Google Scholar]
- Pitt D, Nagelmeier IE, Wilson HC, Raine CS. Glutamate uptake by oligodendrocytes: Implications for excitotoxicity in multiple sclerosis. Neurology. 2003;61:1113–1120. doi: 10.1212/01.wnl.0000090564.88719.37. [DOI] [PubMed] [Google Scholar]
- Polakis PG, Wilson JE. An intact hydrophobic N-terminal sequence is critical for binding of rat brain hexokinase to mitochondria. Arch Biochem Biophys. 1985;236:328–337. doi: 10.1016/0003-9861(85)90633-2. [DOI] [PubMed] [Google Scholar]
- Ralphe JC, Segar JL, Schutte BC, Scholz TD. Localization and function of the brain excitatory amino acid transporter type 1 in cardiac mitochondria. J Mol Cell Cardiol. 2004;37:33–41. doi: 10.1016/j.yjmcc.2004.04.008. [DOI] [PubMed] [Google Scholar]
- Robinson MB. The family of sodium-dependent glutamate transporters: A focus on the GLT-1/EAAT2 subtype. Neurochem Int. 1999;33:479–491. doi: 10.1016/s0197-0186(98)00055-2. [DOI] [PubMed] [Google Scholar]
- Rose EM, Koo JC, Antflick JE, Ahmed SM, Angers S, Hampson DR. Glutamate transporter coupling to Na,K-ATPase. J Neurosci. 2009;29:8143–8155. doi: 10.1523/JNEUROSCI.1081-09.2009. [DOI] [PMC free article] [PubMed] [Google Scholar]
- Rothstein JD, Martin L, Levey AI, Dykes-Hoberg M, Jin L, Wu D, Nash N, Kuncl RW. Localization of neuronal and glial glutamate transporters. Neuron. 1994;13:713–725. doi: 10.1016/0896-6273(94)90038-8. [DOI] [PubMed] [Google Scholar]
- Schousboe A. Transport and metabolism of glutamate and GABA in neurons and glial cells. Int Rev Neurobiol. 1981;22:1–45. doi: 10.1016/s0074-7742(08)60289-5. [DOI] [PubMed] [Google Scholar]
- Shevchenko A, Wilm M, Vorm O, Mann M. Mass spectrometric sequencing of proteins silver-stained polyacrylamide gels. Anal Chem. 1996;68:850–858. doi: 10.1021/ac950914h. [DOI] [PubMed] [Google Scholar]
- Sickmann HM, Walls AB, Schousboe A, Bouman SD, Waagepetersen HS. Functional significance of brain glycogen in sustaining glutamatergic neurotransmission. J Neurochem. 2009;109(Suppl 1):80–86. doi: 10.1111/j.1471-4159.2009.05915.x. [DOI] [PubMed] [Google Scholar]
- Sims NR, Anderson MF. Isolation of mitochondria from rat brain using Percoll density gradient centrifugation. Nat Protoc. 2008;3:1228–1239. doi: 10.1038/nprot.2008.105. [DOI] [PubMed] [Google Scholar]
- Speicher KD, Kolbas O, Harper S, Speicher DW. Systematic analysis of peptide recoveries from in-gel digestions for protein identifications in proteome studies. J Biomol Tech. 2000;11:74–86. [PMC free article] [PubMed] [Google Scholar]
- Sui D, Wilson JE. Structural determinants for the intracellular localization of the isozymes of mammalian hexokinase: intracellular localization of fusion constructs incorporating structural elements from the hexokinase isozymes and the green fluorescent protein. Arch Biochem Biophys. 1997;345:111–125. doi: 10.1006/abbi.1997.0241. [DOI] [PubMed] [Google Scholar]
- Susarla BT, Robinson MB. Internalization and degradation of the glutamate transporter GLT-1 in response to phorbol ester. Neurochem Int. 2008;52:709–722. doi: 10.1016/j.neuint.2007.08.020. [DOI] [PMC free article] [PubMed] [Google Scholar]
- Tanaka K, Watase K, Manabe T, Yamada K, Watanabe M, Takahashi K, Iwama H, Nishikawa T, Ichihara N, Kikuchi T, Okuyama S, Kawashima N, Hori S, Takimoto M, Wada K. Epilepsy and exacerbation of brain injury in mice lacking the glutamate transporter GLT-1. Science. 1997;276:1699–1702. doi: 10.1126/science.276.5319.1699. [DOI] [PubMed] [Google Scholar]
- Torres GE. The dopamine transporter proteome. J Neurochem. 2006;97(Suppl 1):3–10. doi: 10.1111/j.1471-4159.2006.03719.x. [DOI] [PubMed] [Google Scholar]
- Tzingounis AV, Wadiche JI. Glutamate transporters: confining runaway excitation by shaping synaptic transmission. Nat Rev Neurosci. 2007;8:935–947. doi: 10.1038/nrn2274. [DOI] [PubMed] [Google Scholar]
- Vinet J, Lemieux P, Tamburri A, Tiesinga P, Scafidi J, Gallo V, Sik A. Subclasses of oligodendrocytes populate the mouse hippocampus. Eur J Neurosci. 2010;31:425–438. doi: 10.1111/j.1460-9568.2010.07082.x. [DOI] [PubMed] [Google Scholar]
- Wang GJ, Jackson JG, Thayer SA. Altered distribution of mitochondria impairs calcium homeostasis in rat hippocampal neurons in culture. J Neurochem. 2003;87:85–94. doi: 10.1046/j.1471-4159.2003.01970.x. [DOI] [PubMed] [Google Scholar]
- Wang S, Cesca F, Loers G, Schweizer M, Buck F, Benfenati F, Schachner M, Kleene R. Synapsin I is an oligomannose-carrying glycoprotein, acts as an oligomannose-binding lectin, and promotes neurite outgrowth and neuronal survival when released via glia-derived exosomes. J Neurosci. 2011;31:7275–7290. doi: 10.1523/JNEUROSCI.6476-10.2011. [DOI] [PMC free article] [PubMed] [Google Scholar]
- Wang X, Schwarz TL. The mechanism of Ca2+-dependent regulation of kinesin-mediated mitochondrial motility. Cell. 2009;136:163–174. doi: 10.1016/j.cell.2008.11.046. [DOI] [PMC free article] [PubMed] [Google Scholar]
- Watanabe M, Rothstein JD. GPS1 negatively regulates GLT-1. Soc Neurosci Abstr. 2002;28:441–410. [Google Scholar]
- Xiao K, McClatchy DB, Shukla AK, Zhao Y, Chen M, Shenoy SK, Yates JR, III, Lefkowitz RJ. Functional specialization of beta-arrestin interactions revealed by proteomic analysis. Proc Natl Acad Sci U S A. 2007;104:12011–12016. doi: 10.1073/pnas.0704849104. [DOI] [PMC free article] [PubMed] [Google Scholar]
- Xu NJ, Bao L, Fan HP, Bao GB, Pu L, Lu YJ, Wu CF, Zhang X, Pei G. Morphine withdrawal increases glutamate uptake and surface expression of glutamate transporter GLT1 at hippocampal synapses. J Neurosci. 2003;23:4775–4784. doi: 10.1523/JNEUROSCI.23-11-04775.2003. [DOI] [PMC free article] [PubMed] [Google Scholar]
- Yoon Y, Krueger EW, Oswald BJ, McNiven MA. The mitochondrial protein hFis1 regulates mitochondrial fission in mammalian cells through an interaction with the dynamin-like protein DLP1. Mol Cell Biol. 2003;23:5409–5420. doi: 10.1128/MCB.23.15.5409-5420.2003. [DOI] [PMC free article] [PubMed] [Google Scholar]
- Zerangue N, Kavanaugh MP. Flux coupling in a neuronal glutamate transporter. Nature. 1996;383:634–637. doi: 10.1038/383634a0. [DOI] [PubMed] [Google Scholar]
- Zhang CL, Ho PL, Kintner DB, Sun D, Chiu SY. Activity-dependent regulation of mitochondrial motility by calcium and Na/K-ATPase at nodes of Ranvier of myelinated nerves. J Neurosci. 2010;30:3555–3566. doi: 10.1523/JNEUROSCI.4551-09.2010. [DOI] [PMC free article] [PubMed] [Google Scholar]
- Zhou J, Sutherland ML. Glutamate transporter cluster formation in astrocytic processes regulates glutamate uptake activity. J Neurosci. 2004;24:6301–6306. doi: 10.1523/JNEUROSCI.1404-04.2004. [DOI] [PMC free article] [PubMed] [Google Scholar]
- Zou S, Pita-Almenar JD, Eskin A. Regulation of glutamate transporter GLT-1 by MAGI-1. J Neurochem. 2011;117:833–840. doi: 10.1111/j.1471-4159.2011.07250.x. [DOI] [PubMed] [Google Scholar]