

Abstract
Objective
To investigate neural activity in prefrontal cortex and amygdala during bipolar depression.
Methods
Eleven bipolar I depressed and 17 normal subjects underwent functional magnetic resonance imaging (fMRI) while performing a task known to activate prefrontal cortex and amygdala. Whole brain activation patterns were determined using statistical parametric mapping (SPM) when subjects matched faces displaying neutral or negative affect (match condition) or matched a geometric form (control condition). Contrasts for each group for the match versus control conditions were used in a second-level random effects analysis.
Results
Random effects between-group analysis revealed significant attenuation in right and left orbitofrontal cortex (BA47) and right dorsolateral prefrontal cortex (DLPFC) (BA9) in bipolar depressed subjects. Additionally, random effects analysis showed a significantly increased activation in left lateral orbitofrontal cortex (BA10) in the bipolar depressed versus control subjects. Within-group contrasts demonstrated significant amygdala activation in the controls and no significant amygdala activation in the bipolar depressed subjects. The amygdala between-group difference, however, was not significant.
Conclusions
Bipolar depression is associated with attenuated bilateral orbitofrontal (BA47) activation, attenuated right DLPFC (BA9) activation and heightened left orbitofrontal (BA10) activation. BA47 attenuation has also been reported in mania and may thus represent a trait feature of the disorder. Increased left prefrontal (BA10) activation may be a state marker to bipolar depression. Our findings suggest dissociation between mood-dependent and disease-dependent functional brain abnormalities in bipolar disorder.
Keywords: amygdala, bipolar depression, bipolar disorder, functional magnetic resonance imaging, orbitofrontal cortex
The lifetime prevalence for bipolar disorder is 2% in the United States (1) and patients spend the majority of their time in episodes of depression, not mania (2–5). As bipolar depression is associated with high levels of morbidity and mortality across the life span, efforts aimed at identifying the biological mechanisms that contribute to the diathesis for this phase of the illness are imperative. Functional neuroimaging studies of patients with unipolar depressive disorder have begun to reveal the dysregulated neuroanatomic circuits associated with this syndrome (6–21). Similar studies in patients with bipolar depression are more limited.
To our knowledge, five studies have been performed using functional magnetic resonance imaging (fMRI) in patients with bipolar disorder during the depressed phase (22–26). Only three of these fMRI studies used affective paradigms known to activate limbic structures, although the paradigms differed across studies. In one study, patients observed emotional expressions; bipolar depressed patients demonstrated increased subcortical (left amygdala, caudate, putamen, thalamus, right globus pallidus) and prefrontal responses to both positive (happy) and negative (fearful) expressions compared to the control group (22). In another study involving the cognitive generation of affect, distinct patterns of regional activation were found with bipolar depressed patients generating predominantly right-sided subcortical activation (basal ganglia, thalamus, hypothalamus, and amygdala) (26). A third study used a paradigm to assess implicit versus explicit facial emotion recognition and found that bipolar depressed subjects tended to over activate fronto-striato-thalamic regions in response to fearful faces (24).
Functional neuroimaging studies in normal subjects using neuropsychological paradigms that involve the processing of emotional facial expression have reported specificity for activation of orbitolateral prefrontal cortex and amygdala in normal subjects (27–32). Several fMRI studies of bipolar subjects during the manic state, including work from our group, have demonstrated either attenuation of orbitofrontal cortex (OFC) function and/or heightened amygdala activation compared to controls (22, 24, 33, 34). The presence of an attenuated OFC response and a heightened amygdala response in mania suggests an alteration in a prefrontal-amygdala circuit. The OFC has been purported to play a role in the integration of emotional information and the regulation of intensity of emotional response (35, 36). Dysfunction in this area could provide a mechanism for understanding a failure to appropriately modulate other brain regions and perhaps result in a range of intensity of mood shifts in people with bipolar disorder.
The current study used fMRI and a facial affect processing task to assess orbitofrontal cortical and amygdala reactivity in subjects with bipolar depression. While the few studies reviewed above that used affective paradigms suggest that amygdala activity might increase during bipolar depression, we hypothesized that orbitofrontal activity would be heightened and amygdala activity reduced in subjects with bipolar depression compared to a normal control group. Given our data regarding mania, and assuming depression represents a mood state that might involve the same brain regions but with an alternate activation, we hypothesized that we would see an activation pattern opposite to what we had observed in mania.
Patients and methods
Study subjects
The study protocol was approved by the Institutional Review Boards at the University of California, Los Angeles (UCLA) and at the Veterans Affairs Greater Los Angeles Healthcare System (VAGLAHS), and each subject gave written informed consent. Subjects with bipolar I disorder, currently depressed, were recruited through the UCLA Mood Disorders Clinic and the Bipolar Disorders Clinic of the VAGLAHS in West Los Angeles, as well as inpatient units of both hospitals. Subjects enrolled in other UCLA Mood Disorders Research Program research projects were also invited to participate. Control subjects were recruited by advertisement in local newspapers and campus flyers, and were excluded if they had a current or past psychiatric diagnosis (including history of substance abuse) or were taking any medications for medical reasons. All subjects underwent the Structured Clinical Interview for DSM-IV (SCID) to obtain an accurate diagnosis; bipolar subjects who met SCID criteria for bipolar disorder, currently depressed, and scored ≥18 on the (21-item) Hamilton Rating Scale for Depression (HAM-D) (37) were eligible to participate. Exclusion criteria for all subjects included left-handedness, hypertension, neurologic illness, metal implants, and a history of skull fracture or head trauma with loss of consciousness >5 min. Additional exclusion criteria for bipolar subjects included any current other Axis I comorbidity. Subjects with a past history of alcohol or drug use disorder could participate if they had been sober for ≥9 months.
In total, 11 subjects (six women) with bipolar depression and 17 control subjects (eight women) were scanned. Control subjects were 29.5 ± 6.6 years of age. Subjects with bipolar disorder were 32 ± 7.3 years of age. There were no significant differences in age or gender between groups. Two subjects (18%) were not taking any medication at the time of scanning. The remaining nine subjects were on a range of medications including lamotrigine (n = 3), divalproex sodium (n = 3), carbamazepine (n = 1), lithium (n = 1), atypical antipsychotics (n = 2), selective serotonin reuptake inhibitors (SSRIs) (n = 2), and venlafaxine (n = 1).
On the day of the scan, severity of mood symptoms was assessed in the bipolar subjects using the Young Mania Rating Scale (YMRS) (38) and the HAM-D. Additionally, a seven-item extension of the HAM-D was used to assess for atypical depressive symptoms that are common in bipolar depression (39). The YMRS average score was 2.9 ± 1.9 (range 0–7), the average HAM-D score was 20.8 ± 3.3 (range 18–26), and the average extended HAM-D score was 31.27 ± 4.76 (range 24–41).
Imaging procedure
MRI scans were obtained on a 3-Tesla instrument (General Electric, Waukesha, WI, USA) with echo planar imaging capability (Advanced NMR Systems, Wilmington, MA, USA). Functional MRI scanning was conducted with a gradient echo, echo planar acquisition sequence. First, an automated shim procedure was applied to maximize magnetic field homogeneity (40). Second, a sagittal scout (T2 weighted) was obtained to identify locations for both structural and functional images. Third, co-planar echo planar imaging high-resolution structural images were obtained consisting of 26 slices [repetition time (TR)/echo time (TE) = 4000/54 ms, 4 mm thick, 1 mm gap, matrix 1282, field of view (FOV) = 20 cm] co-planar to the functional imaging scans. Finally, functional images were obtained with an asymmetric spin echo sequence (41). This sequence was used to reduce susceptibility artifact in the area of the amygdala and covered 16 slices from the temporal lobes and upward (TR/TE/180 degree pulse offset = 2500/70/25 ms, 4 mm thick, 1 mm gap, matrix 642, FOV = 20 cm). Sixteen slices were the maximum possible on this instrument given the constraint of a TR of 2500 and the relatively long TE of 70 seconds needed for the asymmetric spin echo images. They were chosen on anatomical grounds from the 26 slices obtained from the structural scan covering the brain to maximize coverage in the areas of interest, low enough to image the amygdala fully while high enough to retain coverage of the inferior frontal cortex.
Activation task
The face-matching paradigm consisted of three different experimental conditions (‘match affect in faces,’ ‘word identify affect in faces,’ and ‘match forms’) and included nine experimental blocks: four blocks presented faces bearing negative affect and five were control blocks presenting geometric forms. Each block lasted 32.5 seconds for a total scan length of 4:53 min (see Fig. 1) (31). We chose this task because of significant differences seen between control and manic subjects in amygdala and prefrontal cortical activation (34).
Fig. 1.
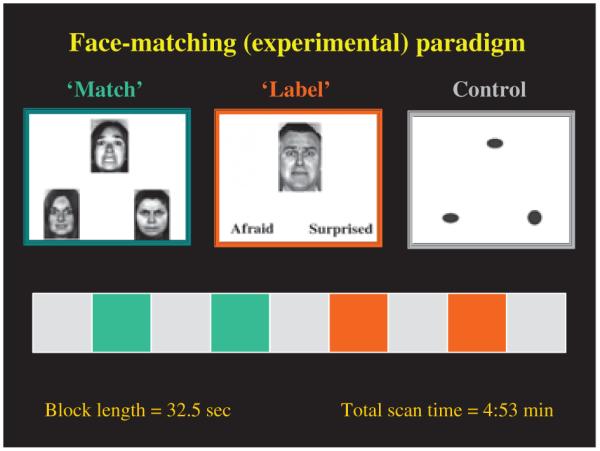
Functional MRI activation task: face-matching paradigm.
Of the four blocks involving experimental faces, two required the subject to choose the correct match of a face with one of two other affectively charged faces (match faces). Faces were shown with neutral or negative affect (anger or fear). The other two required subjects to identify one of two presented words (e.g., angry, afraid) that best matched an affectively charged face (identify faces). For each affect condition, 12 different images portraying negative facial emotions were used [six per block, three of each gender, all derived from a standard set of pictures of facial affect (42)]. There were 12 observations per condition, and each observation was shown for 5 seconds. The emotions were randomized across blocks and the order of task presentation was balanced equally in the bipolar depressed and control subjects. Between ‘match’ and ‘identify’ affect conditions, subjects performed a control task where they matched an elliptical form to one of two other forms presented in the same or a different orientation (match forms). During imaging, subjects responded by pressing one of two buttons with their right hand. Response and accuracy times were calculated for each group.
Data analysis
From the above paradigm, the data from the ‘match faces’ (experimental) and ‘match forms’ (control) tasks were used for the current analysis because prior work with this paradigm in control subjects showed this contrast reliably activated the orbitofrontal cortex and amygdala (31, 34). Group averaged statistical parametric mapping analysis (SPM) was used to analyze the patterns of activation on fMRI.
Preprocessing and SPM
All functional image volumes were examined closely for time points containing severe motion or spike artifacts. Single corrupted volumes (i.e., those containing spike artifacts and volume series or runs containing significant head motion of two voxels or greater) were removed from further analysis. The number of time points included was 108.6 + 6.06 for the bipolar depressed group and 111.7 + 4.44 for the control subjects. Mean time points removed were 8.4 and 5.2 for bipolar depressed and control subjects, respectively. Images were corrected for head motion and spatially normalized using Automated Image Registration (AIR) tools (43). First, the images from the high-resolution echo planar anatomic scans were aligned automatically to a site-specific atlas (44). The co-planar functional scans were concatenated and corrected for linear head motion using a 6-parameter algorithm in AIR. Following this, the data were smoothed using a 6-mm full width at half maximum Gaussian kernel in AIR. Then the high-resolution file was resampled to match the functional files. Next, all transformation parameters from realignment and spatial normalization were applied to the functional files, which were realigned to correct for head motion in atlas space (AIR). Within-subject masking was then applied, retaining only those voxels for which there was signal in all images/scans. In analyzing within-subject data after head motion correction, portions of the top and bottom slices were removed automatically by AIR when there was through-plane motion (i.e., when there were voxels not represented throughout the whole times series due to motion).
The group preprocessing consisted first of cropping images not shared across all subjects (i.e., eliminating planes that did not have brain images across all subjects), such that voxels were entered into analysis if they were represented in all subjects. After cropping, the scan coverage was 7 cm, covering approximately −20 to +50 in the Z plane in Talairach coordinate space. Lastly, the cropped functional files were smoothed and the group data then processed statistically by SPM.
Statistical analysis
Bipolar depressed subjects and controls were compared on performance variables (response time, percentage of errors) using two sample t-tests as inspection revealed that the data were normally distributed. The group data were processed statistically using SPM 99 (http://www.fil.ion.ucl.ac.uk/spm/). Contrasts were first made for the ‘match faces’ versus ‘match forms’ (control task) comparison within each group (patients and controls separately) for a fixed effect analysis. We used a height threshold of p < 0.05, which is corrected for multiple comparisons, and an extent threshold of >10 voxels for the within-group contrasts. This extent threshold was chosen to be small enough to capture a small structure like the amygdala but not so small as to capture false positives. The individual single-subject contrasts from this analysis were then entered into a second-level analysis with subject as a random factor (random effects analysis). Only voxels demonstrating significant activity in the within-group analyses were entered into the between-groups comparisons. This approach minimizes false positive errors due to random differences in pixel values between groups and reduces the need to correct for multiple comparisons over the entire brain.
Results
Behavioral data
There were no significant differences between bipolar depressed and control groups in the response time on either the match faces task (2.34 ± 0.5 versus 2.38 ± 0.5 seconds; bipolar depressed versus controls; t = 0.21, p = 0.8) or on the match forms task (1.25 ± 0.3 versus 1.23 ± 0.3 seconds; bipolar depressed versus controls; t = 1.06, p = 0.30). Similarly, there were no significant group differences in accuracy of response on the match faces task (84% ± 8% bipolar depressed; 80% ± 14% controls; t = 0.79, p = 0.44) or match forms task (99% ± 3% bipolar depressed versus 98% ± 3% controls; t = 0.79, p = 0.45).
Functional imaging data
SPM within-group analyses
Table 1 gives the extent thresholds, Talairach coordinates (45) and z-scores for significant areas of activation with an extent threshold ≥10 voxels seen within either the bipolar depressed or control groups (p < 0.05 corrected for multiple comparisons) for the match faces minus match forms (control) comparisons. Figure 2 displays activation results of the within-group fixed effect analysis in specific slices through the brain in the control and bipolar groups, respectively. Both groups displayed robust, bilateral fusiform activity consistent with activation of the fusiform face area, suggesting that subjects were seeing and attending to the faces shown. The control group additionally demonstrated significant bilateral activation of the anterior inferior orbitofrontal lobe (BA47) (Talairach coordinates x= −50, y = 18, z = −4; x = 46, y = 18, z = −4, p < 0.0001). This was not seen in the bipolar subjects (Table 1; Fig. 2A). Significant activation was also seen in right BA9 in both groups, but the extent of activation was much greater in the control [(k) = 163; x = 48, y = 16, z = 26] than the bipolar subjects [(k) = 14; x = 42; y = 22, z = 30] (Table 1).
Table 1.
Statistical parametric mapping within-group analyses: regions of significant activation during faces task (match faces versus forms)
| Normal controls (n = 17) |
Bipolar depressed (n = 11) |
|||||||||
|---|---|---|---|---|---|---|---|---|---|---|
| Brain region | [k] | x | y | z | (z) | [k] | x | y | z | (z) |
| Amygdala | ||||||||||
| Left amygdala | [10] | −26 | 0 | −10 | (6.15) | |||||
| Right amygdala | [21] | 22 | −2 | −12 | (6.78) | |||||
| Frontal lobe | ||||||||||
| L BA 47 | [44] | −50 | 18 | −4 | Infinity | |||||
| R BA 47 | [107] | 46 | 18 | −4 | Infinity | |||||
| L BA 10 | [144] | −42 | 48 | 6 | (6.76) | |||||
| R BA 10 | ||||||||||
| L BA 9 | ||||||||||
| R BA 9 | [163] | 48 | 16 | 26 | (7.09) | [14] | 42 | 22 | 30 | (6.61) |
| Fusiform | ||||||||||
| Left fusiform | [44] | −26 | −62 | −12 | Infinity | [26] | −38 | −58 | −14 | (6.43) |
| Right fusiform | [36] | 36 | −58 | −12 | Infinity | [49] | 34 | −58 | −12 | Infinity |
All areas with extent threshold [k] ≥10 displayed, p < 0.05, corrected for multiple comparisons.
L = left; R = right.
Fig. 2.
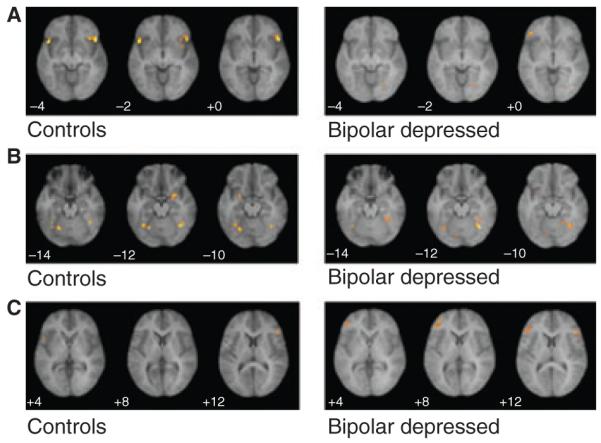
Statistical parametric mapping within-group activation in specific slices in control and bipolar depressed subjects during face-matching paradigm (match faces versus forms). (A) Bilateral activation in BA47 in controls but not bipolar depressed subjects. (B) Activation in left and right amygdala in controls, but not bipolar depressed subjects (despite fusiform activity in both groups). (C) Activation in left BA10 in bipolar depressed subjects, but not control subjects.
Significant amygdala activation was seen bilaterally in the control group (Talairach coordinates x=−26, y =0, z =−10; p=0.005; x=22, y=−2, z = −12, p < 0.0001) during the match faces versus match forms task. No amygdala activation was seen in the bipolar depressed group, despite good fusiform activity (Table 1; Fig. 2B). Even when the threshold of activation was reduced to an uncorrected p < 0.1, no amygdala activation was seen in the bipolar depressed group.
SPM additionally revealed a significant area of activation in left orbital prefrontal cortex (BA10) unique to the bipolar depressed group [(k) = 144; spanning from x=−42, y=48, z= 6 to x=−42, y = 36, z = 10; p < 0.0001] (Table 1; Fig. 2C). No activation was seen in this brain region in control subjects.
SPM between-group (random effects) analyses
Table 2 gives the extent thresholds, Talairach coordinates, and z-scores for the significant areas of activation with an extent threshold ≥10 voxels (p < 0.01) in the between-groups random effects analyses of controls versus bipolar depressed and depressed versus controls during the match faces versus match forms comparison. Figure 3 shows lateral views of the major findings. The activation in control versus bipolar depressed subjects in right and left OFC (BA47) and right dorsolateral prefrontal cortex (DLPFC) (BA9) remained significant with random effects analyses [(k) = 139 (x = 44, y = 20, z = 0); (k) = 23 (x = −48, y = 12, z = 2); and (k) = 114 (x = 48, y = 14, z = 28); p < 0.0001 uncorrected voxel level, respectively]. The left orbitofrontal cortex (BA10) was significantly more activated in the bipolar depressed versus the control group, with significant between-group differences found in random effects analysis [(k) = 14 (x = −36, y = 40, z = 14); p = 0.003 uncorrected voxel level]. Follow-up analysis of these regions using a small volume correction to correct for multiple comparisons demonstrated that all of these regions remained significant at a corrected p-value of <0.05. While the within-group fixed effects analyses demonstrated significant amygdala activation in the control group and no significant amygdala activation in the bipolar depressed group, random effects analysis did not reveal a significant between-group difference in amygdala activation in control versus bipolar depressed subjects.
Table 2.
Statistical parametric mapping between-group analyses: regions of significant activation during faces task (match faces versus forms)
| Brain region | Normal controls versus bipolar depressed | Bipolar depressed versus normal controls | ||||||||
|---|---|---|---|---|---|---|---|---|---|---|
| Frontal lobe | [k] | x | y | z | (z) | [k] | x | y | z | (z) |
| L BA 47 | [23] | −48 | 12 | 2 | 2.98 | |||||
| R BA 47 | [139] | 44 | 22 | 0 | 3.99 | |||||
| L BA 10 | [14] | −36 | 40 | 14 | 2.76 | |||||
| R BA 9 | [114] | 48 | 14 | 28 | 3.48 | |||||
All areas with extent threshold [k] ≥10 displayed, uncorrected p < 0.01.
L = left; R = right.
Fig. 3.
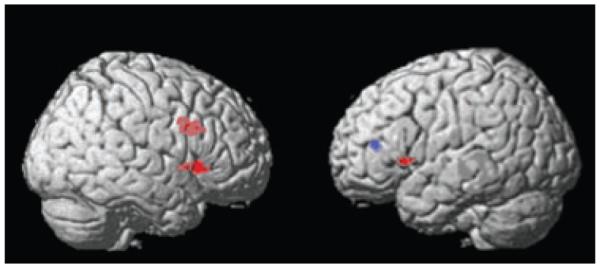
Between-group random effects analyses. Regions of increased activation in control versus bipolar depressed subjects (red) or in bipolar versus control subjects (blue).
Discussion
In this study, using an activation paradigm involving the matching of emotional facial expression, we found (i) significant attenuation of right lateral and left orbitofrontal (BA47) and right dorsolateral (BA9) cortical activation, and (ii) a significant increase in activation in the left lateral orbitofrontal cortex (BA10) in the bipolar depressed subjects compared to controls. Additionally, as opposed to the control group, the bipolar depressed subjects did not show any significant (within-group) amygdala activation, but the between-group difference was not significant.
The activation of what appears to be orbitofrontal region BA47 seen in our control subjects using the current paradigm has been previously reported in other normal control samples (31, 32, 34). No study, to our knowledge, has used this paradigm with bipolar depressed subjects. In bipolar depressed subjects in the current study, there was a lack of activation of this brain region. Five functional neuroimaging studies have previously probed orbitofrontal function in patients with bipolar disorder during mania, and they report a striking convergence of findings of reduced activation in this brain region (25, 33, 34, 46, 47). Further, in one [15O] H2O positron emission tomography study involving six euthymic bipolar subjects, decreased bilateral OFC activity at rest was also noted (47). These studies, in conjunction with the current study, suggest that BA47 hypoactivation may occur in all bipolar mood states and thus represent a possible physiologic trait marker of the disorder. One study using voxel-based morphometry found reductions in gray matter density in subjects with bipolar disorder, including reductions in right inferior frontal gyrus (BA47) (48). Whether an enduring structural deficit (decreased BA47 gray matter density) underlies functional abnormalities seen in BA47 across mood states deserves further study.
The orbitofrontal brain region has been implicated in processing emotional salience (35) and ‘drive’ (49). It has been speculated that the OFC is involved in regulating the highest level of control of behavior, especially in relation to emotion, through pathways between the OFC and autonomic systems that govern visceral responses associated with affective stimuli (50). There is extensive anatomical connectivity between OFC, amygdale, and cingulate (36, 50, 51). Orbital prefrontal areas are also connected with temporal polar and entorhinal temporal cortex and thus have connections with the limbic cortex (52–54). Neuroimaging studies have demonstrated a role for medial and lateral regions of the OFC in mood regulation (55, 56) and in associative emotional memory functions (35, 57–59). Orbitofrontal hypo-activity has been reported in the literature to be associated with both euphoric and depressive mood states (23, 60–62). The OFC may thus participate in aspects of emotional processing/expression that are not exclusively related to a specific valence of emotion. Lack of normal functioning in this region might result in dysregulation of mood, to either pole.
The bipolar depressed group showed an area of activation in another orbitofrontal area, the left anterior prefrontal cortex (BA10), that was not observed in the control subjects while performing the face-matching task. This region of activation is important in that it demonstrates that neither mood state per se nor medications per se globally dampen brain activity in the bipolar depressed subjects. Our finding of an increased left prefrontal cortical activation in bipolar depression is consistent with another fMRI study that assessed 10 bipolar depressed subjects using a different neurocognitive task (25): a relative increase in activation in left ventral prefrontal cortex was found in this study in the bipolar depressed compared to the bipolar euthymic group. This left prefrontal activation is not typically seen in the face-matching task. This regional activation appears to be limited to the bipolar depressed state, as activation was not seen in the controls in this study, nor in manic subjects using the same paradigm in another study by our group (34).
Activation of BA10 has been reported to occur in association with conflict resolution and decision making (63). Further, this region is recruited as cognitive tasks become more difficult (64, 65). It is possible that in the depressed state, increased cognitive effort was expended by patients to perform the task and the increased activation is a reflection of this increased effort. This region was also shown to activate in another study of unmedicated bipolar patients (performing an attentional task), suggesting again that medications are not solely responsible for this effect (66). In that study, however, bipolar subjects were euthymic. Thus, the state versus trait activation of BA10 requires further study. The exact role of BA10 in mood regulation, if any, is not known and will require further evaluation in both normal and bipolar depressed subjects with paradigms that can specifically probe this brain region.
The significant amygdala activation reported previously in a small number of manic patients contrasts sharply with the lack of detectable activation seen in the current bipolar depressed sample and suggests that activation/responsivity of this brain region may vary as a function of mood state. Given the small size of the structure, it is possible there was no activation in the bipolar depressed group due to a threshold effect. However, we tested this more directly by reducing the threshold of activation to p < 0.1, and we were still unable to detect any amygdala activation in the bipolar depressed subjects. While the current study suggests a reduction of activation during bipolar depression, the between-group differences were not significant with random effects analysis. As the structure is small, our sample was small, and there were only two blocks of the match faces condition, there may have been inadequate power to detect between-group differences. One other published fMRI study used a paradigm that, like ours, specifically probed amygdala function in depressed bipolar subjects, but amygdala activation was not reported in patients or controls in that study (24). Prior fMRI studies in bipolar subjects in either the manic or euthymic state have suggested significantly increased amygdala activation in equally small subject samples with either mania or euthymia (22, 34, 67) compared to control subjects. Blunted amygdala activation during bipolar depression may represent a state marker of a core physiologic change of amygdala reactivity. A larger sample may be necessary for more definitive results.
Both control and bipolar depressed groups showed substantial bilateral fusiform activation as well as activation of right DLPFC (BA9), suggesting that both groups used working memory circuits to perform the task. However, activation of right DLPFC was significantly less in the bipolar depressed compared to control subjects, suggesting a failure to fully activate secondary brain regions involved in the task. Visuospatial tasks involving a working memory component have been reported to activate DLPFC in normal subjects (68, 69). The task we used was not designed to explicitly test cognitive function of working memory and we had no a priori hypothesis regarding DLPFC function when designing the current study. Additionally, we had a limited extent of coverage of the dorsal prefrontal cortex in this protocol, with the more dorsal regions not covered. However, it is known that the DLPFC is a brain region involved in willed actions (70) and is integrally involved with the ‘holding in mind’ of information on which a future action will be based (71). Functional MRI studies involving DLPFC function have reported reduced DLPFC activation (67, 72) or no differences in DLPFC activation in euthymic bipolar versus control subjects (73). In the current study, there were no behavioral differences between groups in performing the faces task, despite the fact of significant between-group activation. Studies using fMRI with neuropsychological paradigms assessing working memory in bipolar depressed subjects may further delineate functional deficits in this brain region that are state versus trait related.
There are several limitations of the current study. First, our sample size is small, involving 11 bipolar depressed and 17 control subjects, and thus it may not be possible to extrapolate our findings to the larger population of bipolar depressed subjects. It is, however, one of the larger in the very few published fMRI studies involving subjects with bipolar depression. While only two bipolar (and no control subjects) had a history of substance abuse, most bipolar patients studied were on antimanic and antidepressant medications at the time of scanning. The impact of these medications on blood flow in the frontal lobes and amygdala has not been comprehensively studied. Antimanic agents such as divalproex sodium (in patients with epilepsy) and lithium have both been shown to decrease overall cerebral blood flow (74–77) or to have no effect (78, 79). The majority of patients in the current study were taking these mood stabilizers. However, despite taking these medications, significant activation was seen in some brain regions in the bipolar group, including fusiform and orbitofrontal (BA10) and DLPFC (BA9) areas. Additionally, in the three published studies using face-matching paradigms in bipolar subjects on these same medications but in either a manic or euthymic state (22, 34, 67), amygdala or frontal lobe regional brain activation was significantly greater in the bipolar than control subjects despite medication exposure. Thus, medication status alone does not appear to fully account for the current findings. Rather, mood state may play a role in mediating some state-related brain imaging findings, or bipolar disorder per se may be associated with some persistent trait-related changes as well, and these could have complex interactions with medications.
Conclusion
We report an attenuation of the magnitude of activation in bipolar depressed subjects in specific frontal brain regions (right and left BA47; right BA9) and an increased activation in another frontal region (left BA10) in the bipolar depressed group. Additionally, we observed a lack of signal activation in the amygdala in the bipolar depressed group, which is in contrast to the results from the control group in this study and from manic subjects in another study (34). These data, in relation to prior studies of other bipolar subjects, suggest that some functional brain abnormalities may be mood dependent and others may represent trait markers of the illness. As the functional neuroanatomic circuits involved in bipolar depression and in bipolar subjects who are euthymic remain largely unexplored, future functional neuroimaging studies involving activation paradigms that probe regional brain function in the same bipolar patients in different mood states may help distinguish state- versus trait-functional neuroanatomic abnormalities. Additionally, our findings of lateralized activation (left BA10) and attenuation (BA9) deserve further evaluation regarding specific hemispheric involvement in the regulation of mood. Studies with larger numbers of patients with varying symptom presentation may also provide the ability to correlate the presence of specific symptoms with different patterns of regional brain activation.
This is one of the first fMRI studies of bipolar depression involving a lateral OFC and amygdala activation paradigm. As changes in blood flow and metabolism reflect differences in regional synaptic activity (whether that activity is excitatory or inhibitory) (80, 81), it may not be surprising that some of the same brain regions affected in mania may also be affected in depression. The attenuation of orbitoprefrontal (BA47) function seen in the bipolar depressed subjects may be a primary marker of bipolar disorder, as it has also been reported in mania and euthymia. Reduction in amygdala activation and heightened BA10 activation have not, to our knowledge, been reported in bipolar manic subjects. Our findings suggest dissociation between mood-dependent and disease-dependent functional brain abnormalities in bipolar disorder. Whether either type of change represents a primary regional pathologic physiology or the result of a primary pathologic process elsewhere in the brain that secondarily alters function in the regions probed by our fMRI paradigm remains to be further elucidated.
Acknowledgements
The authors gratefully acknowledge the Stanley Medical Research Institute, the National Alliance for Research on Schizophrenia and Depression, and the National Institute of Mental Health (K24 MH01848) for their financial support of this study. For generous support, the authors also wish to thank the Brain Mapping Medical Research Organization, Brain Mapping Support Foundation, Pierson-Lovelace Foundation, the Ahmanson Foundation, Tamkin Foundation, Jennifer Jones-Simon Foundation, Capital Group Companies Charitable Foundation, Robson Family, Northstar Fund, the National Institute of Drug Abuse grant DA13054 and the National Center for Research Resources grants RR12169, RR13642, and RR08655.
Footnotes
The authors of this paper do not have any commercial associations that might pose a conflict of interest in connection with this manuscript.
References
- 1.Kessler RC, Rubinow DR, Holmes C, Abelson JM, Zhao S. The epidemiology of DSM-III-R bipolar I disorder in a general population survey. Psychol Med. 1997;27:1079–1089. doi: 10.1017/s0033291797005333. [DOI] [PubMed] [Google Scholar]
- 2.Judd LL, Akiskal HS, Schettler PJ, et al. The long-term natural history of the weekly symptomatic status of bipolar I disorder. Arch Gen Psychiatry. 2002;59:530–537. doi: 10.1001/archpsyc.59.6.530. [DOI] [PubMed] [Google Scholar]
- 3.Judd LL, Schettler PJ, Akiskal HS, et al. Long-term symptomatic status of bipolar I vs. bipolar II disorders. Int J Neuropsychopharmacol. 2003;6:127–137. doi: 10.1017/S1461145703003341. [DOI] [PubMed] [Google Scholar]
- 4.Keller MB, Lavori PW, Coryell W, Endicott J, Mueller TI. Bipolar I: a five-year prospective follow-up. J Nerv Ment Dis. 1993;181:238–245. doi: 10.1097/00005053-199304000-00005. [DOI] [PubMed] [Google Scholar]
- 5.Post RM, Leverich GS, Altshuler LL, et al. An overview of recent findings of the Stanley Foundation Bipolar Network (Part I) Bipolar Disord. 2003;5:310–319. doi: 10.1034/j.1399-5618.2003.00051.x. [DOI] [PubMed] [Google Scholar]
- 6.Drevets WC. Neuroimaging studies of mood disorders. Biol Psychiatry. 2000;48:813–829. doi: 10.1016/s0006-3223(00)01020-9. [DOI] [PubMed] [Google Scholar]
- 7.Phillips ML, Drevets WC, Rauch SL, Lane R. Neurobiology of emotion perception I: the neural basis of normal emotion perception. Biol Psychiatry. 2003;54:504–514. doi: 10.1016/s0006-3223(03)00168-9. [DOI] [PubMed] [Google Scholar]
- 8.Mayberg HS. Positron emission tomography imaging in depression: a neural systems perspective. Neuroimaging Clin N Am. 2003;13:805–815. doi: 10.1016/s1052-5149(03)00104-7. [DOI] [PubMed] [Google Scholar]
- 9.Davidson RJ, Sutton SK. Affective neuroscience: the emergence of a discipline. Curr Opin Neurobiol. 1995;5:217–224. doi: 10.1016/0959-4388(95)80029-8. [DOI] [PubMed] [Google Scholar]
- 10.Baxter LR, Jr, Schwartz JM, Phelps ME, et al. Reduction of prefrontal cortex glucose metabolism common to three types of depression. Arch Gen Psychiatry. 1989;46:243–250. doi: 10.1001/archpsyc.1989.01810030049007. [DOI] [PubMed] [Google Scholar]
- 11.Bench CJ, Friston KJ, Brown RG, Frackowiak RS, Dolan RJ. Regional cerebral blood flow in depression measured by positron emission tomography: the relationship with clinical dimensions. Psychol Med. 1993;23:579–590. doi: 10.1017/s0033291700025368. [DOI] [PubMed] [Google Scholar]
- 12.Drevets WC, Price JL, Simpson JR, Jr, et al. Subgenual prefrontal cortex abnormalities in mood disorders. Nature. 1997;386:824–827. doi: 10.1038/386824a0. [DOI] [PubMed] [Google Scholar]
- 13.George MS, Ketter TA, Parekh PI, et al. Blunted left cingulate activation in mood disorder subjects during a response interference task (the Stroop) J Neuropsychiatry Clin Neurosci. 1997;9:55–63. doi: 10.1176/jnp.9.1.55. [DOI] [PubMed] [Google Scholar]
- 14.DeAsis J, Silbersweig D, Alexopoulos G, et al. Decreased hippocampal and anterior cingulate activation in geriatric depression. Biol Psychiatry. 1999;45:5115–5116. [Google Scholar]
- 15.Mayberg HS. Limbic-cortical dysregulation: a proposed model of depression. J Neuropsychiatry Clin Neurosci. 1997;9:471–481. doi: 10.1176/jnp.9.3.471. [DOI] [PubMed] [Google Scholar]
- 16.Wu JC, Gillin JC, Buchsbaum MS, Hershey T, Johnson JC, Bunney WE., Jr Effect of sleep deprivation on brain metabolism of depressed patients. Am J Psychiatry. 1992;149:538–543. doi: 10.1176/ajp.149.4.538. [DOI] [PubMed] [Google Scholar]
- 17.Drevets WC, Videen TO, Price JL, Preskorn SH, Carmichael ST, Raichle ME. A functional anatomical study of unipolar depression. J Neurosci. 1992;12:3628–3641. doi: 10.1523/JNEUROSCI.12-09-03628.1992. [DOI] [PMC free article] [PubMed] [Google Scholar]
- 18.Drevets WC. Prefrontal cortical-amygdalar metabolism in major depression. Ann N Y Acad Sci. 1999;877:614–637. doi: 10.1111/j.1749-6632.1999.tb09292.x. [DOI] [PubMed] [Google Scholar]
- 19.Drevets WC, Bogers W, Raichle ME. Functional anatomical correlates of antidepressant drug treatment assessed using PET measures of regional glucose metabolism. Eur Neuropsychopharmacol. 2002;12:527–544. doi: 10.1016/s0924-977x(02)00102-5. [DOI] [PubMed] [Google Scholar]
- 20.Sheline YI, Barch DM, Donnelly JM, Ollinger JM, Snyder AZ, Mintun MA. Increased amygdala response to masked emotional faces in depressed subjects resolves with antidepressant treatment: an fMRI study. Biol Psychiatry. 2001;50:651–658. doi: 10.1016/s0006-3223(01)01263-x. [DOI] [PubMed] [Google Scholar]
- 21.Siegle GJ, Steinhauer SR, Thase ME, Stenger VA, Carter CS. Can’t shake that feeling: event-related fMRI assessment of sustained amygdala activity in response to emotional information in depressed individuals. Biol Psychiatry. 2002;51:693–707. doi: 10.1016/s0006-3223(02)01314-8. [DOI] [PubMed] [Google Scholar]
- 22.Lawrence NS, Williams AM, Surguladze S, et al. Subcortical and ventral prefrontal cortical neural responses to facial expressions distinguish patients with bipolar disorder and major depression. Biol Psychiatry. 2004;55:578–587. doi: 10.1016/j.biopsych.2003.11.017. [DOI] [PubMed] [Google Scholar]
- 23.Kruger S, Seminowicz D, Goldapple K, Kennedy SH, Mayberg HS. State and trait influences on mood regulation in bipolar disorder: blood flow differences with an acute mood challenge. Biol Psychiatry. 2003;54:1274–1283. doi: 10.1016/s0006-3223(03)00691-7. [DOI] [PubMed] [Google Scholar]
- 24.Chen CH, Lennox B, Jacob R, et al. Explicit and implicit facial affect recognition in manic and depressed States of bipolar disorder: a functional magnetic resonance imaging study. Biol Psychiatry. 2006;59:31–39. doi: 10.1016/j.biopsych.2005.06.008. [DOI] [PubMed] [Google Scholar]
- 25.Blumberg HP, Leung HC, Skudlarski P, et al. A functional magnetic resonance imaging study of bipolar disorder: state- and trait-related dysfunction in ventral prefrontal cortices. Arch Gen Psychiatry. 2003;60:601–609. doi: 10.1001/archpsyc.60.6.601. [DOI] [PubMed] [Google Scholar]
- 26.Malhi GS, Lagopoulos J, Ward PB, et al. Cognitive generation of affect in bipolar depression: an fMRI study. Eur J Neurosci. 2004;19:741–754. doi: 10.1111/j.0953-816x.2003.03159.x. [DOI] [PubMed] [Google Scholar]
- 27.Breiter HC, Etcoff NL, Whalen PJ, et al. Response and habituation of the human amygdala during visual processing of facial expression. Neuron. 1996;17:875–887. doi: 10.1016/s0896-6273(00)80219-6. [DOI] [PubMed] [Google Scholar]
- 28.Morris JS, Frith CD, Perrett DI, et al. A differential neural response in the human amygdala to fearful and happy facial expressions. Nature. 1996;383:812–815. doi: 10.1038/383812a0. [DOI] [PubMed] [Google Scholar]
- 29.Adolphs R, Tranel D, Damasio H, Damasio AR. Fear and the human amygdala. J Neurosci. 1995;15:5879–5891. doi: 10.1523/JNEUROSCI.15-09-05879.1995. [DOI] [PMC free article] [PubMed] [Google Scholar]
- 30.Calder AJ, Young AW, Rowland D, Perrett DI, Hodges JR, Etcoff NL. Facial emotion recognition after bilateral amygdala damage: differentially severe impairment of fear. Cogn Neuropsychol. 1996;13:699–745. [Google Scholar]
- 31.Hariri AR, Bookheimer SY, Mazziotta JC. Modulating emotional responses: effects of a neocortical network on the limbic system. Neuroreport. 2000;11:43–48. doi: 10.1097/00001756-200001170-00009. [DOI] [PubMed] [Google Scholar]
- 32.Lieberman MD, Hariri A, Jarcho JM, Eisenberger NI, Bookheimer SY. An fMRI investigation of race-related amygdala activity in African-American and Caucasian-American individuals. Nat Neurosci. 2005;8:720–722. doi: 10.1038/nn1465. [DOI] [PubMed] [Google Scholar]
- 33.Elliott R, Ogilvie A, Rubinsztein JS, Calderon G, Dolan RJ, Sahakian BJ. Abnormal ventral frontal response during performance of an affective go/no go task in patients with mania. Biol Psychiatry. 2004;55:1163–1170. doi: 10.1016/j.biopsych.2004.03.007. [DOI] [PubMed] [Google Scholar]
- 34.Altshuler L, Bookheimer S, Proenza MA, et al. Increased amygdala activation during mania: a functional magnetic resonance imaging study. Am J Psychiatry. 2005;162:1211–1213. doi: 10.1176/appi.ajp.162.6.1211. [DOI] [PubMed] [Google Scholar]
- 35.Cabeza R, Nyberg L. Imaging cognition II: an empirical review of 275 PET and fMRI studies. J Cogn Neurosci. 2000;12:1–47. doi: 10.1162/08989290051137585. [DOI] [PubMed] [Google Scholar]
- 36.Fuster JM. The prefrontal cortex – an update: time is of the essence. Neuron. 2001;30:319–333. doi: 10.1016/s0896-6273(01)00285-9. [DOI] [PubMed] [Google Scholar]
- 37.Hamilton M. A rating scale for depression. J Neurol Neurosurg Psychiatry. 1960;23:56–62. doi: 10.1136/jnnp.23.1.56. [DOI] [PMC free article] [PubMed] [Google Scholar]
- 38.Young RC, Biggs JT, Ziegler VE, Meyer DA. A rating scale for mania: reliability, validity and sensitivity. Br J Psychiatry. 1978;133:429–435. doi: 10.1192/bjp.133.5.429. [DOI] [PubMed] [Google Scholar]
- 39.Rosenthal NE, Hefferman ME. Bulimia, carbohydrate craving and depression: a central connection? In: Wortman RJ, Wortman JJ, editors. Nutrition and the Brain. Raven Press; New York: 1987. pp. 139–166. [Google Scholar]
- 40.Reese TG, Davis TL, Weisskoff RM. Automated shimming at 1.5 T using echo-planar image frequency maps. J Magn Reson Imaging. 1995;5:739–745. doi: 10.1002/jmri.1880050621. [DOI] [PubMed] [Google Scholar]
- 41.Hoppel BE, Weisskoff RM, Thulborn KR, Moore JB, Kwong KK, Rosen BR. Measurement of regional blood oxygenation and cerebral hemodynamics. Magn Reson Med. 1993;30:715–723. doi: 10.1002/mrm.1910300609. [DOI] [PubMed] [Google Scholar]
- 42.Eckman P, Friesen WV. Pictures of Facial Affect. Consulting Psychologists Press; Palo Alto: 1976. [Google Scholar]
- 43.Woods RP, Grafton ST, Holmes CJ, Cherry SR, Mazziotta JC. Automated image registration: I. general methods and intrasubject, intramodality validation. J Comput Assist Tomogr. 1998;22:139–152. doi: 10.1097/00004728-199801000-00027. [DOI] [PubMed] [Google Scholar]
- 44.Woods RP, Dapretto M, Sicotte NL, Toga AW, Mazziotta JC. Creation and use of a Talairach-compatible atlas for accurate, automated, nonlinear intersubject registration, and analysis of functional imaging data. Hum Brain Mapp. 1999;8:73–79. doi: 10.1002/(SICI)1097-0193(1999)8:2/3<73::AID-HBM1>3.0.CO;2-7. [DOI] [PMC free article] [PubMed] [Google Scholar]
- 45.Talairach J, Tournoux P. Co-Planar Stereotaxic Atlas of the Human Brain. Thieme Medical Publishers; New York: 1988. [Google Scholar]
- 46.Rubinsztein JS, Fletcher PC, Rogers RD, et al. Decision-making in mania: a PET study. Brain. 2001;124:2550–2563. doi: 10.1093/brain/124.12.2550. [DOI] [PubMed] [Google Scholar]
- 47.Blumberg HP, Stern E, Ricketts S, et al. Rostral and orbital prefrontal cortex dysfunction in the manic state of bipolar disorder. Am J Psychiatry. 1999;156:1986–1988. doi: 10.1176/ajp.156.12.1986. [DOI] [PubMed] [Google Scholar]
- 48.Lyoo IK, Kim MJ, Stoll AL, et al. Frontal lobe gray matter density decreases in bipolar I disorder. Biol Psychiatry. 2004;55:648–651. doi: 10.1016/j.biopsych.2003.10.017. [DOI] [PubMed] [Google Scholar]
- 49.Tucker DM, Luu P, Pribram KH. Social and emotional self-regulation. Ann N Y Acad Sci. 1995;769:213–239. doi: 10.1111/j.1749-6632.1995.tb38141.x. [DOI] [PubMed] [Google Scholar]
- 50.Morris JS, Dolan RJ. Dissociable amygdala and orbitofrontal responses during reversal fear conditioning. Neuroimage. 2004;22:372–380. doi: 10.1016/j.neuroimage.2004.01.012. [DOI] [PubMed] [Google Scholar]
- 51.Price JL, Carmichael ST, Drevets WC. Networks related to the orbital and medial prefrontal cortex; a substrate for emotional behavior? Prog Brain Res. 1996;107:523–536. doi: 10.1016/s0079-6123(08)61885-3. [DOI] [PubMed] [Google Scholar]
- 52.Markowitsch HJ, Emmans D, Irle E, Streicher M, Preilowski B. Cortical and subcortical afferent connections of the primate’s temporal pole: a study of rhesus monkeys, squirrel monkeys, and marmosets. J Comp Neurol. 1985;242:425–458. doi: 10.1002/cne.902420310. [DOI] [PubMed] [Google Scholar]
- 53.Van Hoesen GW, Pandya DN, Butters N. Cortical afferents to the entorhinal cortex of the Rhesus monkey. Science. 1972;175:1471–1473. doi: 10.1126/science.175.4029.1471. [DOI] [PubMed] [Google Scholar]
- 54.Van Hoesen G, Pandya DN, Butters N. Some connections of the entorhinal (area 28) and perirhinal (area 35) cortices of the rhesus monkey. II. Frontal lobe afferents. Brain Res. 1975;95:25–38. doi: 10.1016/0006-8993(75)90205-x. [DOI] [PubMed] [Google Scholar]
- 55.Baker SC, Frith CD, Dolan RJ. The interaction between mood and cognitive function studied with PET. Psychol Med. 1997;27:565–578. doi: 10.1017/s0033291797004856. [DOI] [PubMed] [Google Scholar]
- 56.Northoff G, Richter A, Gessner M, et al. Functional dissociation between medial and lateral prefrontal cortical spatiotemporal activation in negative and positive emotions: a combined fMRI/MEG study. Cereb Cortex. 2000;10:93–107. doi: 10.1093/cercor/10.1.93. [DOI] [PubMed] [Google Scholar]
- 57.Price JL. Comparative aspects of amygdala connectivity. Ann N Y Acad Sci. 2003;985:50–58. doi: 10.1111/j.1749-6632.2003.tb07070.x. [DOI] [PubMed] [Google Scholar]
- 58.Bookheimer S. Functional MRI of language: new approaches to understanding the cortical organization of semantic processing. Annu Rev Neurosci. 2002;25:151–188. doi: 10.1146/annurev.neuro.25.112701.142946. [DOI] [PubMed] [Google Scholar]
- 59.Dapretto M, Bookheimer SY. Form and content: dissociating syntax and semantics in sentence comprehension. Neuron. 1999;24:427–432. doi: 10.1016/s0896-6273(00)80855-7. [DOI] [PubMed] [Google Scholar]
- 60.Angrilli A, Palomba D, Cantagallo A, Maietti A, Stegagno L. Emotional impairment after right orbitofrontal lesion in a patient without cognitive deficits. Neuroreport. 1999;10:1741–1746. doi: 10.1097/00001756-199906030-00021. [DOI] [PubMed] [Google Scholar]
- 61.Joseph R. Frontal lobe psychopathology: mania, depression, confabulation, catatonia, perseveration, obsessive compulsions, and schizophrenia. Psychiatry. 1999;62:138–172. doi: 10.1080/00332747.1999.11024862. [DOI] [PubMed] [Google Scholar]
- 62.Grafman J, Vance SC, Weingartner H, Salazar AM, Amin D. The effects of lateralized frontal lesions on mood regulation. Brain. 1986;109:1127–1148. doi: 10.1093/brain/109.6.1127. [DOI] [PubMed] [Google Scholar]
- 63.Rogers RD, Owen AM, Middleton HC, et al. Choosing between small, likely rewards and large, unlikely rewards activates inferior and orbital prefrontal cortex. J Neurosci. 1999;19:9029–9038. doi: 10.1523/JNEUROSCI.19-20-09029.1999. [DOI] [PMC free article] [PubMed] [Google Scholar]
- 64.Pochon JB, Levy R, Fossati P, et al. The neural system that bridges reward and cognition in humans: an fMRI study. Proc Natl Acad Sci U S A. 2002;99:5669–5674. doi: 10.1073/pnas.082111099. [DOI] [PMC free article] [PubMed] [Google Scholar]
- 65.Kroger JK, Sabb FW, Fales CL, Bookheimer SY, Cohen MS, Holyoak KJ. Recruitment of anterior dorsolateral prefrontal cortex in human reasoning: a parametric study of relational complexity. Cereb Cortex. 2002;12:477–485. doi: 10.1093/cercor/12.5.477. [DOI] [PubMed] [Google Scholar]
- 66.Strakowski SM, Adler CM, Holland SK, Mills N, DelBello MP. A preliminary FMRI study of sustained attention in euthymic, unmedicated bipolar disorder. Neuropsychopharmacology. 2004;29:1734–1740. doi: 10.1038/sj.npp.1300492. [DOI] [PubMed] [Google Scholar]
- 67.Yurgelun-Todd DA, Gruber SA, Kanayama G, Killgore WD, Baird AA, Young AD. fMRI during affect discrimination in bipolar affective disorder. Bipolar Disord. 2000;2:237–248. doi: 10.1034/j.1399-5618.2000.20304.x. [DOI] [PubMed] [Google Scholar]
- 68.Thomas KM, King SW, Franzen PL, et al. A developmental functional MRI study of spatial working memory. Neuroimage. 1999;10:327–338. doi: 10.1006/nimg.1999.0466. [DOI] [PubMed] [Google Scholar]
- 69.Casey BJ, Cohen JD, O’Craven K, et al. Reproducibility of fMRI results across four institutions using a spatial working memory task. Neuroimage. 1998;8:249–261. doi: 10.1006/nimg.1998.0360. [DOI] [PubMed] [Google Scholar]
- 70.Frith C, Dolan R. The role of the prefrontal cortex in higher cognitive functions. Brain Res Cogn Brain Res. 1996;5:175–181. doi: 10.1016/s0926-6410(96)00054-7. [DOI] [PubMed] [Google Scholar]
- 71.Fuster JM. Synopsis of function and dysfunction of the frontal lobe. Acta Psychiatr Scand Suppl. 1999;395:51–57. doi: 10.1111/j.1600-0447.1999.tb05983.x. [DOI] [PubMed] [Google Scholar]
- 72.Monks PJ, Thompson JM, Bullmore ET, et al. A functional MRI study of working memory task in euthymic bipolar disorder: evidence for task-specific dysfunction. Bipolar Disord. 2004;6:550–564. doi: 10.1111/j.1399-5618.2004.00147.x. [DOI] [PubMed] [Google Scholar]
- 73.Strakowski SM, Adler CM, Holland SK, Mills NP, DelBello MP, Eliassen JC. Abnormal FMRI brain activation in euthymic bipolar disorder patients during a counting Stroop interference task. Am J Psychiatry. 2005;162:1697–1705. doi: 10.1176/appi.ajp.162.9.1697. [DOI] [PubMed] [Google Scholar]
- 74.Gaillard WD, Zeffiro T, Fazilat S, DeCarli C, Theodore WH. Effect of valproate on cerebral metabolism and blood flow: an 18F-2-deoxyglucose and 15O water positron emission tomography study. Epilepsia. 1996;37:515–521. doi: 10.1111/j.1528-1157.1996.tb00602.x. [DOI] [PubMed] [Google Scholar]
- 75.Leiderman DB, Balish M, Bromfield EB, Theodore WH. Effect of valproate on human cerebral glucose metabolism. Epilepsia. 1991;32:417–422. doi: 10.1111/j.1528-1157.1991.tb04671.x. [DOI] [PubMed] [Google Scholar]
- 76.Caligiuri MP, Brown GG, Meloy MJ, et al. An fMRI study of affective state and medication on cortical and subcortical brain regions during motor performance in bipolar disorder. Psychiatry Res. 2003;123:171–182. doi: 10.1016/s0925-4927(03)00075-1. [DOI] [PubMed] [Google Scholar]
- 77.Silverstone PH, Bell EC, Willson MC, Dave S, Wilman AH. Lithium alters brain activation in bipolar disorder in a task- and state-dependent manner: an fMRI study. Ann Gen Psychiatry. 2005;4:14. doi: 10.1186/1744-859X-4-14. [DOI] [PMC free article] [PubMed] [Google Scholar]
- 78.Oliver DW, Dormehl IC. Cerebral blood flow effects of sodium valproate in drug combinations in the baboon model. Arzneimittelforschung. 1998;48:1058–1063. [PubMed] [Google Scholar]
- 79.Theodore WH. PET: cerebral blood flow and glucose metabolism – pathophysiology and drug effects. Adv Neurol. 2000;83:121–130. [PubMed] [Google Scholar]
- 80.DiRocco RJ, Kageyama GH, Wong-Riley MTT. The relationship between CNS metabolism and cytoarchitecture: a review of 14C-deoxyglucose studies with correlation to cytochrome oxidase histochemistry. Comput Med Imaging Graph. 1989;13:81–92. doi: 10.1016/0895-6111(89)90080-3. [DOI] [PubMed] [Google Scholar]
- 81.Raichle ME. Circulatory and metabolic correlates of brain function in normal humans. In: Mountcastle VB, Plum F, Geiger SR, editors. Handbook of Physiology – The Nervous System V – Part 2. American Physiological Society; Bethesda, MD: 1987. pp. 643–674. [Google Scholar]