Abstract
Impaired or deficient autophagy is believed to cause or contribute to aging, as well as several age-related pathologies. Thymic epithelial cells had a high constitutive level of autophagy. The autophagic process may play a supporting role or even a crucial role in the presentation of self-Ags in the thymus to shape the T-cell repertoires. Autophagic activity in the liver is important for the balance of energy and nutrients for basic cell functions. The abundance of autophagic structure in both cortical and medullary thymic epithelial cells and liver with mouse age has not been examined in detail. Here, we demonstrated that the architecture of mouse thymus and liver markedly changed with age. We found that the expression of LC3 detected by immunofluorescence and Western blot analysis was greatly decreased in thymus and liver of 12-month-old mice. The same level of reduction was observed in thymus and liver of 24-month-old mice. Ultrastructure analysis by an electron microscope revealed that the number of autophagic structure/vacuole in total thymic epithelial cells and hepatocytes decrease with age. The age-related decrease of autophagic structure in thymic epithelial cells may cause the reduction of immunocompetent T-cell pool in aged mice. The age-related decrease of autophagy in liver may induce accumulation of cellular materials in liver of aged mice.
Keywords: TEC, Hepatocytes, Autophagy, Aging, Liver
Introduction
All cells rely on surveillance mechanisms, chaperones, and proteolytic systems to control the quality of their proteins and organelles and to guarantee that any malfunctioning or damaged intracellular components are repaired or eliminated (Morimoto 2008; Goldberg 2003). Aging is an inevitable physiological process characterized by a progressive accumulation of damaged aberrant macromolecules and organelles in somatic cells during the post-developmental period, leading to the decreased ability of the organism to survive (Guarente and Kenyon 2000; Hekimi and Guarente 2003; Kirkwood and Austad 2000; Bishop and Guarente 2007). Inefficient removal of nonfunctional aberrant cellular components generated by oxidative damages and a general decline in housekeeping mechanisms appear to be critical in the progression of aging (Cuervo et al. 2005; Rajawat and Bossis 2008).
Autophagy is a process of self-degradation of cellular components in which double-membrane autophagosomes sequester organelles or portions of cytosol and fuse with lysosomes or vacuoles for breakdown by resident hydrolases. Defective autophagy plays a significant role in human pathologies, including cancer, neurodegeneration, and infectious diseases (He and Klionsky 2009). The participation of autophagy in different physiological functions is attributable, in almost all cases, to one of its two main functions: as an energy source or as a mechanism for the removal of unwanted cellular structures (Mizushima and Klionsky 2007).
Autophagy has been implicated in both innate and acquired immunity through sampling, digestion, and presentation of peptides from both invasive cellular pathogens and also from their own cellular milieu (Levine and Deretic 2007). The autophagic process may play a supporting role or even a crucial role in the presentation of self-Ags in the thymus to shape the T-cell repertoires (Kasai et al. 2009). Thymic epithelial cells (TECs) had a high constitutive level of autophagy. Autophagy focuses the MHC-II–peptide repertoire of TECs on their intracellular milieu, which contributes to T-cell selection and is essential for the generation of a self-tolerant T-cell repertoire (Nedjic et al. 2008). Genetic interference with autophagy specifically in TECs led to altered selection of certain MHC-II-restricted T-cell specificities and resulted in severe colitis and multi-organ inflammation.
Macroautophagy in the liver is important for the balance of energy and nutrients for basic cell functions, the removal of misfolded proteins resulting from genetic mutations or pathophysiological stimulations, and the turnover of major subcellular organelles such as mitochondria, endoplasmic reticulum, and peroxisomes under both normal and pathophysiological conditions. Disturbance of autophagy function in the liver could thus have a major impact on liver physiology and liver disease (Yin et al. 2008).
In the present study, we investigated TEC in the cortical and medulla regions of thymus to observe autophagy abundance at different stages of life. In addition, we observed the ultrastructure of the liver at different stages of life and examined hepatic autophagy.
Methods
Animals
C57BL/6NCrSlc (C57BL/6) female mice were purchased from SLC. They were maintained at the Animal Research Facility at Nagoya University Graduate School of Medicine under specific pathogen-free conditions with food and water ad libitum and maintained on a 12-h light/dark cycle. After 1-week adaptation, 2-month-old mice were sacrificed. Mice, 12 (adult) and 24 months (old), were maintained in the same condition. Mice were sacrificed by performing cervical dislocation and perfused transcardially with ice-cold phosphate-buffered saline (PBS). After sacrificing, the liver and thymus tissues were collected immediately. We did not have starvation period. All mice were handled in accordance with the Nagoya University Guideline for Animal Experiments.
Reagents and antibodies
Mayer’s hematoxylin solution was purchased from Wako (134-13065) and eosin Y-solution (0.5% aqueous) from MERCK, Germany. Xyline was obtained from Katayama Chemical, Japan and malinol from Muto Pure Chemical Co, Japan.
For immunostaining, rabbit polyclonal anti-LC3 was purchased from Novus Biologicals and we reduced the non-specificity using mouse serum precipitation method. Alexa Fluor-488 (AF488) goat anti-rabbit IgG (H + L) and fluorescent streptavidin conjugates were both obtained from Invitrogen (Tokyo). Fluorescent mounting medium and goat serum (normal) were each purchased from DakoCytomation/Dako (Carpinteria, CA/Denmark).
Rabbit polyclonal anti-LC3 was purchased from Novus Biologicals and anti-rabbit IgG HRP-linked F(ab′)2 fragment raised in donkey and Amersham ECL Plus Western blotting detection reagents were bought from GE Healthcare.
Glutaraldehyde, 2,4,6-tri-dimethylaminomethyl phenol (DMP-30, code-D032), docenyl succinic anhydride (DDSA EM, code-D027), EPON 812 resin (code-T026), and methyl nadic anhydride (MNA, code-MO12) were obtained from TAAB.
Tissue processing for H & E and immunostaining
After euthanization, each mouse was perfused transcardially with PBS and then its thymus and liver were surgically removed and embedded in Tissue-Tek OCT (optimum cutting temperature) compound (Sakura Finetek USA, Inc., Torrance, CA, USA), frozen in liquid nitrogen, and then immediately stored at −30°C. When needed for analyses, the samples were then sectioned at 10-μm thickness using a Leica cryostat (CM3050 S; Leica Instrument Gmbh, Nussloch, Germany).
H & E staining
Thymus and liver cryosections (10 μm) were dried and fixed with 4% formaldehyde. The sections were then stained with hematoxylin for 2 min, washed in tap water for 5 min, then stained with eosin for 4 min, and washed in tap water for 5 min. After dehydration, the sections were mounted with mounting medium (Malinol), observed, and then photographed using a Keyence BZ-8000 microscope (Osaka) and with an Olympus BX50F microscope fitted with an Olympus DP12-2 camera (Olympus Optical Co. Ltd, Tokyo).
Immunostaining
Frozen thymic and liver tissue samples were sectioned at 10-μm thickness with the cryostat. The cryosections were then fixed in acetone, and non-specific binding sites were blocked with 0.2% bovine serum albumin and 1% goat serum in PBS. The sections were then incubated with optimal dilutions of rabbit anti-LC3 (1:1,000) antibody. Immunoreactivity was ultimately detected with AF488-conjugated goat anti-rabbit IgG. After dehydration, all slides were mounted with fluorescent mounting medium and viewed with a Nikon Eclipse E600 (Kawasaki, Japan) equipped with a Radience 2100 model confocal scanning system (Bio-Rad, Hertfordshire, UK).
Western blot
Thymus and liver tissues were lyzed in SDS lysis buffer (1 M Tris HCl (pH 6.8), 20 mM EDTA Na2⋅2H2O, 10% SDS). Cell debris was removed by centrifugation and the protein concentration was determined by the Bio-Rad protein assay reagents. After sodium dodecyl sulfate-polyacrylamide gel electrophoresis (SDS-PAGE), the proteins were transferred to nitrocellulose membranes. The membranes were blocked with 3% non-fat milk in PBS-T and incubated with primary antibody overnight at 4°C. After washing, the membrane was incubated with HRP-linked Amersham ECL anti-rabbit IgG F(ab)2 fragment and detected with Amersham ECL Plus Western blotting detection reagents.
Ultrastructure of the thymus and liver
The thymus and liver of dedicated mice in each regimen were removed, cut into 1-mm3 pieces, immediately immersed in 2.5% glutaraldehyde in phosphate buffer (pH 7.2) for 1 h, in osmium tetraoxide for 1 h, and then dehydrated for 10 min in succession with 50%, 70%, 80%, 90%, and 100% ethyl alcohol. Thereafter, the samples were dehydrated three times with propylene oxide (for 10 min each), then infiltrated for 10 min with propylene oxide and epoxy resin (v/v = 1:1), embedded with EPON 812 epoxy resin, DDSA, DMP-30, and MNA resin, and then aggregated for 24–48 h at 60°C. After polymerization, 70-nm ultrathin sections were made with a diamond knife using Reichert-Nissei ultracuts (Leica), and these were then stained with uranyl acetate and lead stain solution (Sigma Aldrich). The stained sections were then observed and photographed using a JEOL JEM-1400EX transmission electron microscope (Tokyo).
Autophagic structure observation and enumeration under an electron microscope
Autophagic structure was enumerated in different types of thymic epithelial cells in the thymus and in liver cell. Thymic epithelial cells in the cortical and medulla regions were categorized according to a previous description (Milićević et al. 2008). Subcapsular epithelial cells are positioned against the connective tissue and always have a basal lamina. These cells are irregular in shape and have delicate cellular prolongations. The nucleus is euchromatic and the cytoplasm has a very active appearance. “Pale epithelial cells” show the low electron density of the nucleus and cytoplasm. They are stellate in shape with delicate cytoplasmic prolongations. The nucleus is very large, oval, markedly euchromatic, with patent nucleolus. The cytoplasm is not abundant, but reflects a high cell activity. “Intermediate epithelial cells” show higher electron density of the nucleus and cytoplasm. The nucleus is polygonal in shape and shows a characteristic pattern of chromatin organization with prominent nucleolus. Cytoplasm is abundant and shows massive extensions. Dark epithelial cells show a very high electron density of the nucleus and cytoplasm. The large clumps of heterochromatin are scattered all over the nucleus. The cytoplasm is sparse. The cytoplasmic prolongations are extensive and packed with organelles. “Large medullary epithelial cells” have very abundant cytoplasm and inconspicuous prolongations. The cytoplasm displays dilated profiles of rough endoplasmic reticulum, large Golgi fields. We observed autophagic structure/vacuole in different types of critical thymic epithelial cells such as subcapsullar epithelial cells, pale epithelial cells, intermediate epithelial cells, dark epithelial cells, and large medullary epithelial cells.
We also enumerated the number of autophagic structure/vacuole in epithelial cell extension where we cannot observe the epithelial cell nucleus. In case of the liver, we observed autophagic structure in the liver cell.
Statistical analysis
Statistical analysis was expressed as mean ± standard deviation (SD). Student’s t test was used to determine statistical significance. Results were considered significant if the P value was <0.05.
Results
Histological changes of thymus and liver with age
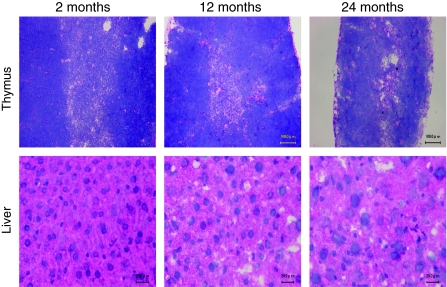
We used H & E staining for preliminary observations of the changes in murine thymus and liver of different ages. There were distinct compartments between the cortical and medullary regions in the thymus of 2-month-old (young) mice (Fig. 1, upper panel). The cortico-medullary junction was clear and defined. In the 12-month-old (middle aged) mice, the medullary area became shortened and the cortico-medullary junction appeared disrupted. In 24-month-old (aged) mice, the medullary area was very difficult to recognize and the cortico-medullary region was hard to define. Two-year-old mice showed marked atrophy both in the cortical and medullary regions of the thymus. The cortico-medullary junction was irregular and poorly defined.
Fig. 1.
Structural and architectural changes occurred by aging. Frozen sections (10 μm) of thymus (upper panel) and liver (lower panel) tissues from 2-, 12-, and 24-month-old C57BL/6J ♀ mice were made. Cryosections were stained with hematoxylin–eosin (H & E). The bar indicates 20 μM in the liver and 100 μM in the thymus. This figure shows the representative results from three independent experiments
Young mice showed normal liver histology, with typically distributed and well-organized cells in the liver. The hepatocytes had cuboidal cells with a round nucleus, a prominent nucleolus, and eosinophilic cytoplasm. Some cells were binucleated (Fig. 1, lower panel). Cytoplasm loosening, cell edema, and focal vacuole degeneration appeared in the liver of 12-month-old mice. The degree of degeneration proceeded by age. Obvious edema and some ballooning degeneration increased in the liver of 24-month-old mice (Fig. 2, lower panel).
Fig. 2.
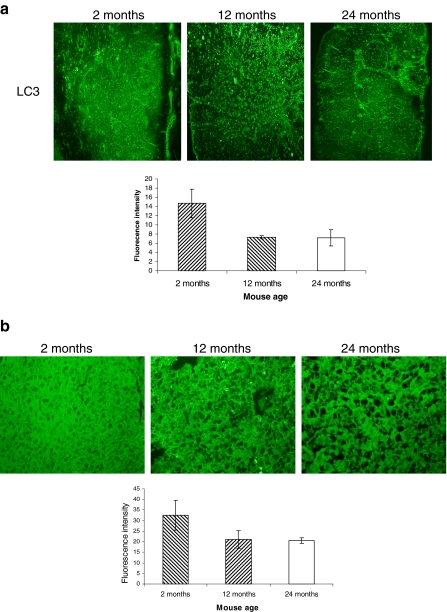
Basal autophagosome in the thymus and liver decreases with aging. a Frozen sections (10 μm) of the thymus (a) and liver (b) from 2-, 12-, and 24-month-old C57BL/6J ♀ mice were made. The sections were stained with rabbit anti-LC3 and immunoreactivity was detected with AF488-conjugated goat anti-rabbit IgG. The slides were then viewed and relative fluorescence was measured with BZ-8000 fluorescence microscopy. This figure shows the representative results from three independent experiments. Error bars represent standard deviation (SD). Statistical significance was determined by Student’s t test
Autophagosome abundance in the thymus and liver
We assessed the LC3 expression, which is involved in autophagosome formation in the thymus and liver by relative immunofluorescence study. Thymus has a constitutive level of autophagosome. Young mouse thymus showed moderate expression of LC3 protein. The expression was reduced by more than 50% in the thymus of 12-month-old mice. The same level of reduced expression was also observed in the thymus of 24-month-old mice (Fig. 2, upper panel). Compared to young mouse liver, LC3 expression was strongly reduced in the liver of 12-month-old mice. The same level of reduced expression was observed in the liver of 24-month-old mice (Fig. 2, lower panel).
Western blot analysis of the thymus and liver
During autophagy induction, LC3-I is converted to LC3-II through lipidation by a ubiquitin-like system, resulting in the association of LC3-II with autophagy vesicles. LC3-II bound to the autophagosome membrane. The change from LC3-I to LC3-II can be also monitored by SDS-PAGE followed by immunoblot analysis. When separated by SDS-PAGE, the LC3-II form migrates faster than the LC3-I form, and thus, the increase in the LC3-II form can be correlated with autophagic turnover.
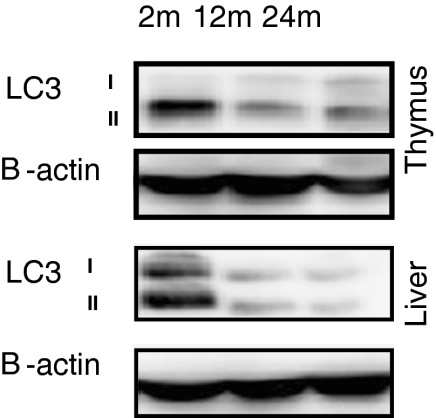
For the observation of the autophagy process during the life course of mouse, we examined the LC3 conversion in the thymus (Fig. 3a) and liver (Fig. 3b) of 2-, 12-, and 24-month-old mice by immunoblotting. The LC3-II expression decreased greatly both in the thymus and liver of 12-month-old mice. The same level of reduction was observed both in the thymus and liver of 24-month-old mice.
Fig. 3.
LC3 expression in the thymus and liver at different stages of mouse age. Thymus and liver tissues from 2-, 12-, and 24-month-old C57BL/6J ♀ mice were prepared for Western blot analysis. LC3 expression was measured by anti-LC3. As an internal control, β-actin was used. This figure shows the representative results from three independent experiments
Ultrastructure study of the thymus and thymic epithelial cell autophagy
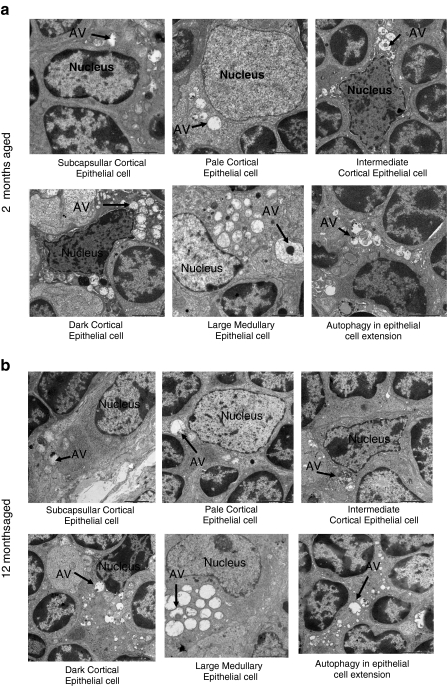
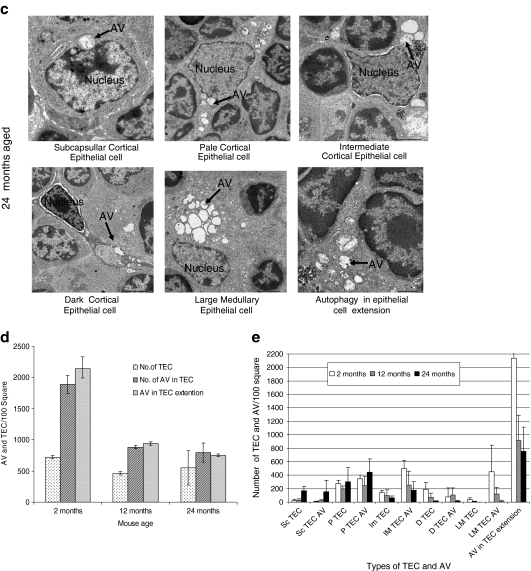
Ultrastructure analysis of tissue by an electron microscope is one of the most important ways to observe autophagic structure. In thymus, two types of TECs exist: cortical TECs and medullary TECs. By electron microscopic examination, different types of cortical TECs were observed in the cortical thymus. We discriminated subcapsullar epithelial cell, pale epithelial cell, intermediate epithelial cell, and dark epithelial in the cortex of thymus. In the medulla, a large medullary epithelial cell was observed (Fig. 4). We investigated the different types of TECs and epithelial cell extension from 2-month-old young mice (Fig. 4a), 12-month-old middle aged mouse (Fig. 4b), and 24-month-old aged mice (Fig. 4c).
Fig. 4.
Ultrastructure analysis for thymic epithelial cells for autophagy. Electron micrograph (×2,500) of thymus tissues from a 2-, b 12-, and c 24-month-old C57BL/6J ♀ mice. Seventy-nanometer ultrathin sections were stained with uranyl acetate and lead stain solution. They were observed under the transmission electron microscope and photographed at ×2,500. Arrow marks indicate the autophagic structure in thymic epithelial cells. d The number of autophagic structure in thymic epithelial cells were enumerated under the electron microscope and presented as the number of thymic epithelial cells and autophagic structure per 100 squares in the copper grid. This figure shows the representative results from three independent experiments. e The number of autophagic structure in subcapsullar thymic epithelial cell (Sc TEC), pale thymic epithelial cell (P TEC), intermediate thymic epithelial cell (Im TEC), dark thymic epithelial cell (D TEC), large medullary thymic epithelial cell (LM TEC), and in epithelial cell extension was enumerated under the electron microscope and presented as the number of thymic epithelial cells and autophagic vacuole (AV) per 100 squares in the copper grid. This figure shows the representative results from three independent experiments
We counted the total number of TECs in the thymic ultrastructure and the total number of autophagic vacuoles among the different types of TECs. Under the electron microscope, we have found some epithelial cell extension without the nucleus. That extension may come from the particular epithelial cell, but it is difficult to identify the kind of epithelial cell extension. That is why we calculated the number of autophagic vacuoles of these extensions separately from others.
First, we present the data of age-related changes of the total number of TECs per 100 square of copper grid and the total number of autophagic structure into the TECs and total number of autophagic vacuoles in the epithelial cell cytoplasmic extension (nucleus does not appear) in the same area. The total number of TECs in a defined area was not changed with age but the number of autophagic vacuoles in the TEC and epithelial cell extension was greatly reduced at the 12-month-old mice. This reduction continued until the 24-month-old mice (Fig. 4d). Then, we present the data of age-related changes of different types of TECs. The number of subcapsullar epithelial cells, pale epithelial cells, and autophagic vacuoles within these types of cell increased with age, whereas the number of intermediate epithelial cells, dark epithelial cells, large medullary epithelial cells, and autophagic vacuoles within these types of epithelial cells significantly reduced with age. TECs having the cytoplasmic extension without the nucleus was abundant and the number was decreased with age. The number of autophagic vacuoles in the cytoplasmic extension of epithelial cells also significantly reduced with age (Fig. 4e).
Ultrastructural analyses and autophagic structure in liver
Mammalian autophagy has been well characterized in the liver and in hepatocytes. Autophagy plays important roles in the normal physiology of the liver and in the pathogenesis of several liver diseases. Autophagy in the liver was first defined by electron microscopy, which is a valid and reliable method for analyzing autophagy in hepatocytes. The early stage autophagosomes can be identified with the clear presence of the double membrane and cellular content, such as the cytoplasm or subcellular organelles. These are usually termed initial autophagic compartments (autophagosomes). The more mature autophagosomes are those that have completed the fusion with the lysosomes. They are delimited by a single membrane and may contain partially, partly degraded cytoplasmic materials, which typically show signs of disintegration and increased electron density. These autolysosomes are also known as degradative autophagic compartments. The extent of autophagy may be determined by morphometric analysis. The number of autophagosomes, autolysosomes, or total autophagic vesicles can be determined in a given cell section, or area. The size or the area of the autophagic vesicles, relative to the size or area of the cell, can be also determined.
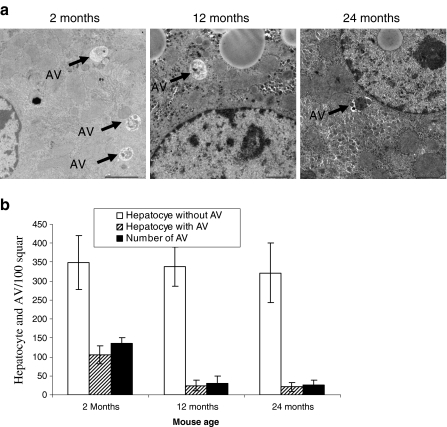
We investigated the autophagic structure in the liver from 2-, 12-, and 24-month-old mice. Representative pictures from different ages of mice are shown in Fig. 5a. Under the electron microscope, we enumerated the number of hepatocytes having an autophagic structure, total number of autophagic structure, and number of hepatocytes having no autophagic structure. After counting, we presented as total number of autophagic structure, autophagic structure bearing hepatocytes, and hepatocytes without autophagic structure per 100 square in a copper grid (Fig. 5b). The total number of hepatocytes without autophagic structure did not change with mouse age. However, the number of hepatocytes having an autophagic structure and the total number of autophagic structure in hepatocytes significantly reduced in 12-month and 24-month-old mice.
Fig. 5.
Ultrastructure analysis of liver cells for autophagic structure. a Electron micrograph (×2,500) of liver tissues from 2-, 12-, and 24-month-old C57BL/6J ♀ mice. Seventy-nanometer ultrathin sections were stained with uranyl acetate and lead stain solution. They were observed under the transmission electron microscope and photographed at ×2,500. Arrow marks indicate the autophagy in liver cells. b The number of autophagic structure in liver cells was enumerated under the electron microscope and presented as the number of liver cells and autophagic structure per 100 squares in the copper grid. This figure shows the representative results from three independent experiments. Error bars represent standard deviation (SD). Statistical significance was determined by Student’s t test
Discussion
Here, at first, we investigated the structural changes of the thymus with age and the level of LC3 expression, which shows the autophagosome formation using immunofluorescence and Western blot analyses at different stages of mouse age. Finally, we investigated the abundance of autophagic vacuoles in the different types of cortical thymic epithelial cells, large medullary epithelial cells, and in the cytoplasmic extension of epithelial cells. In this study, we have found that with increasing age the medullary and cortical areas of the mouse thymus were greatly changed in terms of their organization and a decrease in thymus size was observed. The medullary area was reduced and the cortico-medullary junction became disrupted. In the aged mice, the medullary area was broken into smaller islands very difficult to recognize and the cortico-medullary region was difficult to define. In our previous experiment, we also found that cortical and medullary thymic epithelial cells showed disorganized distribution throughout the thymus (Uddin et al. 2010). Both the Western blot and immunofluorescence study revealed that the thymus has autophagic vacuole formation capability under normal conditions. Compared to young mouse thymus, the autophagic vacuole formation ability decreases with age. To show more precisely the age-related changes in TECs, we used electron microscopic studies. We showed that the number of subcapsullar epithelial cells, pale epithelial cells, and autophagic vacuoles within these types of cells increases with mouse age. A large number of the intermediate epithelial cells, dark epithelial cells, large medullary epithelial cells, and autophagic vacuole within these types of epithelial cells significantly reduced with mouse age. The number of autophagic vacuoles in the cytoplasmic extension of epithelial cells also significantly reduced with age. What caused these results? One possibility is that some parts of TECs with cytoplasmic extension without the nucleus are included in subcapsullar epithelial cells and pale epithelial cells. Because the number of TECs with cytoplasmic extension without nucleus is much larger than the subcapsullar epithelial cells and pale epithelial cells, these types of TECs may decrease with age. At present, it is difficult to conclude whether these TECs are decreased with age or not. Some markers, which discriminate the subtype of TECs, will solve this question.
Thymic epithelial cells had a high constitutive level of autophagy. Cortical TECs have predominantly been implicated in positive selection of thymocytes carrying self-MHC-restricted T-cell receptors (Starr et al. 2003), whereas medullary TECs fulfill a non-redundant role in tolerance induction by “promiscuously” expressing otherwise tissue-restricted antigens (Kyewski and Derbinski 2004).
Due to the inefficient presentation of self antigen to the developing T cell in the thymus, not only the potential T-cell production decreases, but also autoreactive T-cell number increases with age. These show the decrease of T-cell immune responses and the increase of autoimmune disease in aged subjects. We found the decrease of autophagic activity in the thymus and different types of thymic epithelial cells in aged mice. The age-related decrease in autophagy in TECs may cause the reduction of immunocompetent T-cell pool.
Autophagy plays important roles in liver physiology and pathology (Yin et al. 2008). In fact, most of the early work on autophagy was conducted involving the liver (Deter and De Duve 1967). One important role of hepatic autophagy is to provide the body under starvation conditions with necessary nutrients through the degradation of intracellular materials. This activity can be regulated by the plasma levels of amino acids, insulin, and glucagon (Deter and De Duve 1967; Mortimore and Poso 1987). Hepatic autophagy is also required for the homeostasis of subcellular organelles, including the mitochondria, endoplasmic reticulum, and peroxisomes (Yin et al. 2008). Mitophagy, selective autophagic degradation of mitochondria, leads to the removal of damaged mitochondria that are associated with increased generation of reactive oxygen species and can thus serve to protect against cell death, aging, and tumorigenesis (Jin 2006).
Autophagy is an important mechanism for the clearance of these misfolded proteins. Here, we demonstrated that the architecture of mouse liver markedly changed with age. We also investigated the autophagosome formation ability in liver tissue through the observation of LC3 expression using immunofluorescence and Western blot analyses at different stages of mouse life. From our experiment, it was confirmed that autophagosome formation ability in the liver greatly decreases with mouse age. Electron microscopy data also show the abundance of autophagic vacuoles in the hepatocytes significantly reduced with mouse age.
Due to autophagic reduction, turnover of the cellular constituents may decrease in aged liver. The age-related decrease in autophagy in liver may account for accumulation of misfolded protein and other cellular garbage and finally worsen the liver activity. Here, we also demonstrated that architecture of mouse liver markedly changed with age. One mechanism of tissue degradation may be caused by the decrease of autophagy by aging.
In this experiment, we observed autophagic activity under the normal feeding state. Age-related decline in liver autophagy refers to the function during the feeding state when it is inhibited by nutrient abundance and that maximal rate of autophagy, during the fasting state, may differently behave during aging.
Acknowledgment
We thank Yoshikazu Fujita for technical assistance with electron microscopy and Ikuyo Mizuguchi for confocal microscopic study. This work was supported by the Ministry of Education, Science, Technology, Sports and Culture, Japan and The Hori Information Science Promotion Foundation, Japan.
References
- Bishop NA, Guarente L. Genetic links between diet and lifespan: shared mechanisms from yeast to humans. Nat Rev Genet. 2007;8:835–844. doi: 10.1038/nrg2188. [DOI] [PubMed] [Google Scholar]
- Cuervo AM, Bergamini E, Brunk UT, Droge W, Ffrench M, Terman A. Autophagy and aging: the importance of maintaining “clean” cells. Autophagy. 2005;1(3):131–140. doi: 10.4161/auto.1.3.2017. [DOI] [PubMed] [Google Scholar]
- Deter RL, Duve C. Influence of glucagon, an inducer of cellular autophagy, on some physical properties of rat liver lysosomes. J Cell Biol. 1967;33:437–449. doi: 10.1083/jcb.33.2.437. [DOI] [PMC free article] [PubMed] [Google Scholar]
- Goldberg AL. Protein degradation and protection against misfolded or damaged proteins. Nature. 2003;426:895–899. doi: 10.1038/nature02263. [DOI] [PubMed] [Google Scholar]
- Guarente L, Kenyon C. Genetic pathways that regulate ageing in model organisms. Nature. 2000;408:255–262. doi: 10.1038/35041700. [DOI] [PubMed] [Google Scholar]
- He C, Klionsky DJ. Regulation mechanisms and signaling pathways of autophagy. Annu Rev Genet. 2009;43:67–93. doi: 10.1146/annurev-genet-102808-114910. [DOI] [PMC free article] [PubMed] [Google Scholar]
- Hekimi S, Guarente L. Genetics and the specificity of the aging process. Science. 2003;299:1351–1354. doi: 10.1126/science.1082358. [DOI] [PubMed] [Google Scholar]
- Jin S. Autophagy, mitochondrial quality control, and oncogenesis. Autophagy. 2006;2:80–84. doi: 10.4161/auto.2.2.2460. [DOI] [PubMed] [Google Scholar]
- Kasai M, Tanida I, Ueno T, Kominami E, Seki S, Ikeda T, Mizuochi T. Autophagic compartments gain access to the MHC class II compartments in thymic epithelium. J Immunol. 2009;183:7278–7285. doi: 10.4049/jimmunol.0804087. [DOI] [PubMed] [Google Scholar]
- Kirkwood TB, Austad SN. Why do we age? Nature. 2000;408:233–238. doi: 10.1038/35041682. [DOI] [PubMed] [Google Scholar]
- Kyewski B, Derbinski J. Self-representation in the thymus: an extended view. Nature Rev Immunol. 2004;4:688–698. doi: 10.1038/nri1436. [DOI] [PubMed] [Google Scholar]
- Levine B, Deretic V. Unveiling the roles of autophagy in innate and adaptive immunity. Nat Rev Immunol. 2007;7:767–777. doi: 10.1038/nri2161. [DOI] [PMC free article] [PubMed] [Google Scholar]
- Milićević NM, Nohroudi K, Milićević Z, Westermann J. Activation of cortical and inhibited differentiation of medullary epithelial cells in the thymus of lymphotoxin-beta receptor-deficient mice: an ultrastructural study. J Anat. 2008;212(2):114–124. doi: 10.1111/j.1469-7580.2007.00851.x. [DOI] [PMC free article] [PubMed] [Google Scholar]
- Mizushima N, Klionsky D. Protein turnover via autophagy: implications for metabolism. Annu Rev Nutr. 2007;27:19–40. doi: 10.1146/annurev.nutr.27.061406.093749. [DOI] [PubMed] [Google Scholar]
- Morimoto RI. Proteotoxic stress and inducible chaperone networks in neurodegenerative disease and aging. Genes Dev. 2008;22:1427–1438. doi: 10.1101/gad.1657108. [DOI] [PMC free article] [PubMed] [Google Scholar]
- Mortimore GE, Poso AR. Intracellular protein catabolism and its control during nutrient deprivation and supply. Annu Rev Nutr. 1987;7:539–564. doi: 10.1146/annurev.nu.07.070187.002543. [DOI] [PubMed] [Google Scholar]
- Nedjic J, Aichinger M, Emmerich J, Mizushima N, Klein L. Autophagy in thymic epithelium shapes the T-cell repertoire and is essential for tolerance. Nature. 2008;455:396–400. doi: 10.1038/nature07208. [DOI] [PubMed] [Google Scholar]
- Rajawat YS, Bossis I. Autophagy in aging and in neurodegenerative disorders. Hormones. 2008;7:46–61. doi: 10.14310/horm.2002.1111037. [DOI] [PubMed] [Google Scholar]
- Starr TK, Jameson SC, Hogquist KA. Positive and negative selection of T cells. Annu Rev Immunol. 2003;21:139–176. doi: 10.1146/annurev.immunol.21.120601.141107. [DOI] [PubMed] [Google Scholar]
- Uddin MN, Nishio N, Ito S, Suzuki H, Isobe K. Toxic effects of D-galactose on thymus and spleen that resemble aging. J Immunotoxicol. 2010;7(3):165–173. doi: 10.3109/15476910903510806. [DOI] [PubMed] [Google Scholar]
- Yin XM, Ding WX, Gao W. Autophagy in the liver. Hepatology. 2008;47:1773–1785. doi: 10.1002/hep.22146. [DOI] [PubMed] [Google Scholar]


