

Abstract
Men and women differ in susceptibility to many diseases and in responses to treatment. Recent advances in genome-wide association studies (GWAS) provide a wealth of data for associating genetic profiles with disease risk; however, in general, these data have not been systematically probed for sex differences in gene-disease associations. Incorporating sex into the analysis of GWAS results can elucidate new relationships between single nucleotide polymorphisms (SNPs) and human disease. In this study, we performed a sex-differentiated analysis on significant SNPs from GWAS data of the seven common diseases studied by the Wellcome Trust Case Control Consortium. We employed and compared three methods: logistic regression, Woolf’s test of heterogeneity, and a novel statistical metric that we developed called permutation method to assess sex effects (PMASE). After correction for false discovery, PMASE finds SNPs that are significantly associated with disease in only one sex. These sexually dimorphic SNP-disease associations occur in Coronary Artery Disease and Crohn’s Disease. GWAS analyses that fail to consider sex-specific effects may miss discovering sexual dimorphism in SNP-disease associations that give new insights into differences in disease mechanism between men and women.
Introduction
There are clear biological and physiological differences between men and women, including differences in the incidence and progression of diseases. For instance, autoimmune diseases such as rheumatoid arthritis, multiple sclerosis and lupus are known to be much more prevalent in women (Compston and Coles 2008; Cutolo et al. 2003; Whitacre 2001). Although recent studies suggest that sex-specific genetic architecture influences human disease phenotypic traits (Arnold et al. 2009; Ober et al. 2008), many published genetic association studies do not take sex into account beyond controlling for sex as a covariate.
Genome-wide association studies (GWAS) have been used to rapidly scan genetic markers across the genomes of many individuals to find single nucleotide polymorphisms (SNPs) associated with a particular phenotype or disease. A main purpose of GWAS is to find polymorphisms that act as markers to highlight biological processes related to disease phenotype. A SNP with different disease associations in males and females can provide insight into sex differences that may further guide the discovery of how disease mechanisms differ between men and women. Another application of GWAS is to find genetic variants for prediction of individual disease risk (Ginsburg and Willard 2009). However, it is known that GWAS results based on individuals of one ethnic group or geographic region may not always apply to a different population (Rosenberg et al. 2010). Similarly, given the known physiological sex differences in many diseases, GWAS results that are not stratified by sex cannot be expected to predict disease risk with the same accuracy for both men and women.
Several of the first large-scale GWAS were carried out by the Wellcome Trust Case Control Consortium (WTCCC) (Burton et al. 2007; WTCCC 2007), the largest of which compared 2,000 individuals in each of seven disease cohorts (bipolar disease, coronary artery disease, Crohn’s disease, hypertension, rheumatoid arthritis, type 1 diabetes, and type 2 diabetes) to 3,000 individuals in a common control group. The WTCCC did not systematically analyze sex differences, beyond performing an association test that combined male and female test statistics and compared these against a 2 degrees-of-freedom or 4 degrees-of-freedom null hypothesis of no disease association. While this test is sensitive to associations of greater magnitude in one sex, the purpose of the test was to find additional SNPs significantly associated with disease, rather than to show that the difference between male and female associations is significant. Consequently, the investigators reported only a single SNP from this analysis, rs11761231, which showed a stronger association for rheumatoid arthritis in females that was absent in males, but cautioned that it was in an area of the genome with high recombination and very weak linkage disequilibrium.
A few more recent GWAS have included sex-specific analyses, including studies on the regulation of uric acid concentrations (Kolz et al. 2009), and sex-specific associations near LYPLAL1 with adiposity and fat distribution (Heid et al. 2010; Lindgren et al. 2009). In cases of schizophrenia and bipolar disorder, specific SNPs in the RELN gene were found to be associated with disease in females but not males (Goes et al. 2010; Shifman et al. 2008). Previous studies have also shown a sex difference in the DLG5 gene in pediatric Crohn’s disease patients, with a polymorphism providing female-specific protection from disease (Biank et al. 2007a, b; Browning et al. 2008). We have also investigated 71 meta-analysis confirmed loci in Crohn’s disease and found sexual dimorphism in the ATG16L1 gene, and additionally found sex-specific parental transmission distortion in this region in multiple populations (Liu et al. 2011). These examples provide evidence that genetic studies that ignore sex-specific effects could fail to identify sexual dimorphism in genes that contribute to risk for complex diseases. However, a limitation of many of these studies is that they directly compare SNP disease association p values between males and females without rigorously testing the statistical significance of the sex differences. The previous studies were also limited to single diseases or single genes.
In this study, we present a systematic sex-specific analysis of the original WTCCC study of seven diseases. We apply stringent filtering criteria to focus our analysis on the most biologically relevant SNPs. We then employ three statistical measures to assess the statistical significance of the differential sex-specific results. Here, we ask a different question than in previous sex-differentiated analyses performed by the WTCCC and other groups. Rather than combining male and female association tests to find disease loci that would otherwise not be called significant, we directly test for sex differences in disease-associated loci using three methods, one of which we developed, called PMASE. Using PMASE, we found significantly sexually differentiated SNPs in important loci in coronary artery disease and Crohn’s disease.
Materials and methods
Study participants and data quality control
The data for our analysis were obtained from the original WTCCC study of 2,000 cases for each of seven complex human diseases (BD, CAD, CD, HT, RA, T1D, and T2D) and 3,000 shared controls (1,500 from the 1958 British Birth Cohort, and 1,500 blood donors recruited specifically for this project). Access to the data was authorized by the WTCCC. Genotyping was carried out using the Affymetrix GeneChip 500K Mapping Array Set, which comprises 500,568 SNPs (WTCCC 2007). We applied quality control criteria at both the SNP level and the individual level. We exclude all 31,011 SNPs and 809 individuals that were excluded during quality control checks in the original WTCCC study. To limit the impact of genotype calling errors, we combine the genotype calls made by the two algorithms used by the WTCCC, Chiamo (Marchini et al., in preparation) and BRLMM (Affymetrix). For each SNP, we individually consider the genotype calls of both programs for each individual; if the calls made by the two algorithms differ, or if one of the two algorithms does not make a call, then the genotype of the individual for this SNP is considered unknown. Finally, individual participants with more than 5% of unknown genotypes are excluded from our analysis, and for each disease, SNPs with more than 5% of unknown genotypes are also excluded. Supplementary Table 1 lists the number of SNPs and individuals used for analysis in each disease after filtering.
Selection of genome-wide significant SNPs
We used a Chi-square test with two degrees of freedom to compute disease association test statistics and p values. Similar to the WTCCC, we used the control cohort of 3,000 individuals as a common control group for each disease-control comparison. We recomputed disease association p values for each disease using the filtered data (described above) and applied a Bonferroni correction to the SNP p values for each disease. We limited our analysis to SNPs with a Bonferroni-corrected p value < 0.05 (raw p value < 1.7 × 10⁻⁷) in the sexes combined in each disease.
Filtering SNPs based on linkage disequilibrium
Multiple SNPs that are in tight linkage disequilibrium (LD) with each other are often all associated with a disease. In such a situation, there is often one single SNP (which might not have been genotyped) that is functionally linked to the disease, whereas the other ones are only associated because of their high LD with that SNP (HapMap 2005). Therefore, testing all SNPs in a region of high LD is redundant and unnecessarily increases the hypothesis space without gaining biologically distinct tests. In addition, it may bias our analysis to a particular region that may be overrepresented on the chip. To perform LD filtering for these genome-wide significant SNPs, we used linkage disequilibrium data from the HapMap cohort of US Utah residents with northern and western European ancestry (CEU) (HapMap 2005). We considered two SNPs to be in LD if the pair-wise r2 value exceeds 0.8. Among a set of SNPs in tight LD, we only wanted to consider the SNP with the best disease association p value for further analysis. Therefore, we applied a greedy algorithm to each set of SNPs occurring on the same chromosome for each disease. We ranked SNPs by p value (most significant to least significant) and iteratively eliminated lower-ranked SNPs with pair-wise r2 values >0.8. Using the LDheatmap package in R (Graham 2006), we constructed plots of LD blocks. The set of SNPs that were selected using this method were analyzed for sex-specific effects.
PMASE: Permutation-based method to compute sex-difference p values
For each SNP that passed all the filtering criteria, we performed disease association tests separately in males and females using a Chi-square test with two degrees of freedom (male cases vs. male controls for each disease, and similarly for females). We then computed the absolute value of the difference between the Chi-square statistic for males ( ) and the Chi-square statistic for females . A large ΔMF may indicate a difference in disease association between males and females; however, other factors could also cause this. Those factors include differences in sample sizes (as a larger sample size will lead to a more significant test statistic for the same effect size), and the fact that for very significant associations, there may be large differences between the Chisquare statistics of the two groups due to random chance. We, therefore, needed to specifically assess the statistical significance of the difference ΔMF given the overall genotype counts of the SNP of interest.
To assess the significance of the ΔMF statistic for a given SNP, we perform N = 10,000 random sex-label swappings. In each swapping, individuals’ sex labels are randomly re-labeled amongst the cases (and separately for the controls) while keeping the genotype information intact. This means that the number of “male” and “female” labels and the total counts for each genotype are the same as in the original experiment. Each label swapping is equivalent to a random sampling of male and female individuals under the null hypothesis that there is no difference in allele frequencies between males and females. We perform disease association tests separately in individuals with “male” labels and “female” labels. We then compute the absolute value of the difference between the Chi-square statistic for “male” labels ( ) and “female” labels . From the N samplings, we computed the fraction that has a difference in Chi-square statistics that is greater than or equal to the observed value of ΔMF as: . This fraction represents the empirical probability of obtaining a statistic ΔR at least as extreme as the observed ΔMF under the null hypothesis, and is thus a p value, which we term the “sex difference p value.” Due to the nature of random swappings, the p value for each SNP will vary slightly across different runs of PMASE. This variation is small and occurs only in the third decimal point, and has no downstream effect on the decision to call a SNP significant using false discovery rate calculation (discussed below). In the plots (Fig. 2, Supplementary Figs. 1, 2), each point represents a pair of Chi-square statistics ( ). Points in the green regions represent swappings that have a ΔR at least as extreme as ΔMF.
Fig. 2.
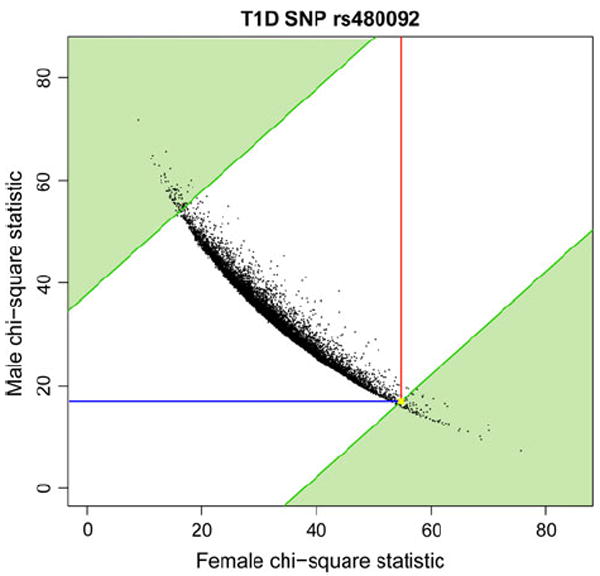
Chi-square statistics for T1D SNP rs480092 from 10,000 random label permutations. Lines are drawn to indicate the actual male (blue) and female (red) Chi-square statistics from the disease genotype data. The sex difference p value is 0.0191, and is calculated from the proportion of random permutations where the absolute value of the difference between male and female Chi-square statistics is more extreme than the actual difference we observed from the real data (upper left corner and lower right corner of the plot, shaded in green). The position corresponding to the ordered pair of the actual male and female Chi-square statistics is highlighted in yellow (color figure online)
Logistic regression with genotype-sex interaction term
We performed logistic regression with a genotype-sex interaction term to assess the effect of sex on genotype. Using the following multivariate logistic regression model for a single SNP, we model the probability of the outcome variable (the cohort to which an individual belongs, case or control) as a function of predictor variables X1 and X2 (genotype and sex).
We use pi to represent the probability of belonging to the disease class, and model the natural logarithm (ln) of the odds of the probabilities. Letting m represent the minor allele and M the major allele in the controls, we coded genotype (X1) as MM = 0, Mm = 1, and mm = 2. Sex (X2) was coded as male = 1, female = 2. We represented the effect of sex on genotype by including the interaction term X1X2. We tested the significance of the interaction term using a likelihood ratio test comparing the full model with the interaction term and the reduced model without the interaction term, and report p values. The likelihood ratio test statistic follows a Chi-square distribution with one degree of freedom: where F refers to the full model as shown above and R refers to the reduced model without the β3X1X2term.
Woolf’s test of heterogeneity
Woolf’s test is a method for testing the heterogeneity of 2 × 2 contingency tables over multiple strata (Woolf 1955). The method tests whether the log odds ratios (ORs) are the same in all strata. For our case, the strata are male and female and we test if the allelic odds ratios for disease association are equal between male and female for a single SNP. This test is sensitive both to ORs in opposite directions (the allele is protective for one sex and risky for the other) as well as in the same direction but of different magnitude. We represent allelic counts for males and females separately for one SNP in 2 × 2 contingency tables such as the following:
| Cases | Controls | |
| Has allele ‘A’ | a | b |
| No allele ‘A’ | c | d |
We then compute a pooled OR using the Mantel–Haenszel method:
where k =2 sex strata and Ti = ai + bi + ci + di
Then the Woolf’s Chi-square statistic is
where k = 2 sex strata and .
False discovery rate calculation
We computed q values for all SNPs tested in each disease. We applied the same procedure to estimate q values for each statistical test used. For each disease, we randomly shuffled the sex labels of disease individuals 1,000 times (and separately also for control individuals). Let the number of SNPs tested in a particular disease be S, and let X be a particular SNP for which we are estimating the q value. Using the PMASE method as an example, we count the number of times the randomly generated PMASE p values of any of the S SNPs is smaller than the actual PMASE value of the SNP X. We compute the q value for each test as the proportion of times (out of 1,000) we get a smaller random p value for that test in any of the S SNPs.
Manual inspection of significant results
We manually inspected the intensity plots for each SNP with a significant sex difference. We plotted the normalized signal data generated from the Affymetrix intensity (‘CEL’) files by the WTCCC. We then manually inspected the quality of the genotype calling, and verified that there is no suspicious difference in signal intensity between male and female samples. This manual inspection led to the exclusion of rs2734973 due to too many disagreeing calls between the two genotype-calling algorithms (Supplementary Fig. 3).
Results
In this study, we carried out sex-specific analysis of genome-wide significant disease-associated SNPs. We used three statistical approaches to assess the significance of sex-specific SNPs, including logistic regression, Woolf’s test, and a novel method that we developed, called permutation method to assess sex effects (PMASE). We applied these methods to GWAS data across seven complex diseases [bipolar disease (BD), coronary artery disease (CAD), Crohn’s disease (CD), hypertension (HT), rheumatoid arthritis (RA), type 1 diabetes (T1D), and type 2 diabetes (T2D)] in a sex-specific manner to discover SNPs with disease association of greater magnitude in one sex.
Selection of disease-associated SNPs
Our stringent SNP selection process had two main purposes: data quality control, and restriction of our hypothesis space to test only the most biologically relevant loci for sex differences in disease association. Figure 1 shows the sequential filtering steps that we took to narrow down our set of SNPs. The remaining numbers of SNPs and patients used for our analysis are shown in Supplementary Table 1. There is previous scientific support for reducing the number of hypotheses prior to testing, in order to reduce the proportion of false discoveries that are simply due to testing too many redundant hypotheses (Chen et al. 2008). Since we are only interested in sex differences in association with disease, we restricted our analysis to only those loci significantly associated with the disease of interest in both sexes combined. To select these SNPs, we calculated disease association p values (see “Materials and methods”) and selected SNPs with a Bonferroni-corrected p value <0.05 (raw p value <1.7 × 10⁻⁷). After this step, there were 523 SNPs remaining across five diseases (Fig. 1). BD and HT did not have any SNPs that were genome-wide significant. T1D had 337 significant SNPs, RA had 136 SNPs, CD had 29 SNPs, T2D had 11 SNPs, and CAD had ten genome-wide significant SNPs (Table 1). We also performed filtering based on linkage disequilibrium for the SNPs from each disease (see “Materials and methods”). We performed sex-specific disease association analysis only on the 280 SNPs remaining after LD filtering, which included 186 SNPs in T1D, 72 in RA, 15 in CD, 4 in T2D, and 3 in CAD (Fig. 1; Table 1).
Fig. 1.

The analysis pipeline for each of seven diseases. We performed sequential filtering steps and applied stringent quality control criteria at both the SNP and individual level. We then performed disease-control association analysis on each sex separately
Table 1.
280 SNPs tested for sex-specific effects across diseases
| Disease | Number of genome-wide significant SNPs | Number of SNPs remaining after LD filtering |
|---|---|---|
| T1D | 337 | 186 |
| RA | 136 | 72 |
| CD | 29 | 15 |
| T2D | 11 | 4 |
| CAD | 10 | 3 |
| BD | 0 | |
| HT | 0 | |
| Total | 523 | 280 |
Genome-wide significance (p value<1.7 × 10⁻⁷ in combined sexes) was assessed using a Bonferroni correction on the disease association p values for all SNPs for a given disease. Sex-specific association analysis was performed on the SNPs that remained after performing LD filtering in each disease
PMASE finds 13 sex-specific SNPs
We applied our method PMASE to assess the statistical significance of sex differences in disease association. We first computed the strength of association separately for male and female cohorts for each of the 280 SNPs that we selected, using a Chi-square test with two degrees of freedom. We then applied a permutation-based metric to assess the significance of the difference in disease-association values between males and females. We generated the empirical distribution of the male and female Chi-square statistics for each SNP based on 10,000 random sex-label permutations of the original data (see “Materials and methods”). The empirical distribution is used to compute a p value of how likely we are to see a difference in the male and female Chi-square statistics that is as or more extreme than the observed difference, given the genotype frequencies of the SNP. We call this p value as the “sex-difference p value.” This method is more precise than simply comparing male and female p values for a SNP, since direct comparison of p values is not possible when male and female sample sizes differ (as is the case with all disease cohorts in the WTCCC data), and large differences are not necessarily significant (see “Materials and methods”). The permutation testing ensures that the findings are not due to any sample-size imbalance between male and female cohorts, and gives an exact test for the difference observed between male and female disease association strengths for each SNP.
Figure 2 shows an example of how PMASE works, where we plot the Chi-square statistic for T1D SNP rs480092 in males and females. As a background, we plotted the Chi-square values from label swapping as ordered pairs, with the female Chi-square values on the x axis and the male Chi-square values on the y axis. We calculated the sex-difference p value as the proportion of simulations where the absolute value of the difference between the male and female Chi-square statistics exceeded the observed difference (visually, this corresponds to a point falling in the green shaded regions of the plot), yielding a sex-difference p value of 0.0191. For an example of a Chi-square plot of a SNP that is not called significant by PMASE, see Supplementary Fig. 1.
PMASE yielded 13 SNPs with significant sex-difference p values (p<0.05). The results for all SNPs that are called significant out of 280 SNPs by PMASE are shown in Table 2. In total, we find one SNP in CAD, two in CD, three in RA and seven in T1D that show evidence of sex-specific effects. Figure 3 shows overall association results for each disease and highlights the 13 loci with evidence of more significant association in each sex, among the 280 SNPs that were selected for sex-difference testing. Individual Chi-square plots for these SNPs can be found in the Supplementary Materials. We excluded rs2734973 after inspection of the intensity plot (see “Materials and methods” and Supplementary Fig. 3), giving 12 significant SNPs. Genotype counts for these SNPs are in Supplementary Table 2.
Table 2.
13 SNPs showing evidence of a sex-specific effect in disease association using PMASE
| Disease | SNP | Combined p value | Female p value | Male p value | Combined OR | Female OR | Male OR | PMASE p value | Q-value | Gene |
|---|---|---|---|---|---|---|---|---|---|---|
| CAD | rs7865618 | 1.57 × 10⁻⁸ | 0.167 | 1.38 × 10⁻⁸ | 1.290 | 1.161 | 1.381 | 0.0214 | 0.053 | |
| CD | rs3792106 | 4.77 × 10 −12 | 6.85 × 10 −13 | 0.0134 | 1.346 | 1.477 | 1.223 | 0.0019 | 0.04 | ATG16L1 |
| rs6431654 | 7.75 × 10⁻¹⁴ | 1.15 × 10⁻¹² | 0.00208 | 1.385 | 1.511 | 1.255 | 0.0101 | 0.18 | ATG16L1 | |
| RA | rs3134926 | 8.03 × 10⁻²² | 1.02 × 10⁻¹⁸ | 0.000137 | 1.645 | 1.773 | 1.439 | 0.0296 | 1 | |
| rs4947244 | 6.70 × 10⁻⁸ | 2.95 × 10⁻⁸ | 0.250 | 1.292 | 1.344 | 1.140 | 0.0127 | 1 | HLA-G | |
| rs3132666 | 7.00 × 10⁻⁸ | 1.57 × 10⁻⁸ | 0.0526 | 0.789 | 0.745 | 0.864 | 0.0225 | 1 | ||
| T1D | rs2763979 | 9.90 × 10−61 | 1.73 × 10−41 | 1.81 × 10⁻²¹ | 0.497 | 0.438 | 0.562 | 0.0031 | 1 | HSPA1B |
| rs4148873 | 2.78 × 10⁻²⁴ | 1.30 × 10⁻⁷ | 9.15 × 10⁻¹⁹ | 1.976 | 1.664 | 2.381 | 0.0088 | 1 | TAP2 | |
| rs3131622 | 6.49 × 10⁻¹² | 1.92 × 10⁻¹⁰ | 0.00197 | 0.745 | 0.676 | 0.820 | 0.0226 | 1 | ||
| rs480092 | 8.41 × 10⁻¹⁵ | 1.31 × 10⁻¹² | 0.000212 | 1.511 | 1.695 | 1.348 | 0.0191 | 1 | VARS | |
| rs3134926 | 8.19 × 10⁻¹⁰ | 7.68 × 10⁻⁹ | 0.00817 | 1.361 | 1.517 | 1.224 | 0.0285 | 1 | ||
| rs12660883 | 1.54 × 10⁻¹² | 0.000573 | 2.55 × 10⁻¹⁰ | 0.626 | 0.708 | 0.551 | 0.0371 | 1 | ||
| rs2734973 | 2.08 × 10⁻¹¹ | 2.69 × 10⁻⁹ | 0.0013 | 1.64 | 1.88 | 1.43 | 0.0470 | 1 |
The 13 SNPs with significant sex-difference p values (PMASE p value <0.05) out of the original 280 SNPs are shown below. The allelic odds ratios (OR) are calculated with respect to the risk allele. rs2734973 (italicized) was later excluded after inspection of the intensity plot
Fig. 3.

Genome-wide scan for seven diseases highlighting sex-specific SNPs. The log10 of the disease association p values for SNPs are plotted against chromosomal position for each of seven diseases. The separate male p value and female p value are plotted for each SNP. The 280 SNPs considered for sex-specific effects are colored in green. SNPs with a sex-difference p value <0.05 are colored in red and blue, with the female p value in red and the male p value in blue. Red open upper arrows and dark blue lower arrows highlight these SNPs as well, respectively. All panels are truncated at 1 × 10⁻¹⁵, although some markers exceed this significance threshold (e.g., chromosome 6 in T1D and RA). The red and blue horizontal lines indicate the Bonferroni correction for each disease (color figure online)
Sex-specific association testing using two other methods
To confirm that our results could be replicated, we compared results from PMASE with two standard methods of assessing subgroup differences, logistic regression and Woolf’s test of heterogeneity. We included a genotype-sex interaction term in the regression model to account for the effect of sex on genotype and performed a likelihood ratio test (see “Materials and methods”). We found that eight SNPs were called significant by both PMASE and regression. There were four SNPs that regression calls significant, but PMASE does not (Table 3). We found that while the SNPs rs3094123 and rs2596571 in T1D are close to being significant by PMASE, the other two SNPs in RA (rs3128963 and rs9348904) have high PMASE p values. Chi-square plots for these four SNPs can be found in Supplementary Fig. 1. We additionally used Woolf’s test, which measures heterogeneity of effect sizes (Woolf 1955). In this study, we use odds ratios to measure effect size, so Woolf’s test detects significant differences in odds ratios between men and women for the disease. In total, seven SNPs overlapped between all three methods (Table 3). This gave us higher confidence in these sexually dimorphic SNPs since they could be replicated across three different tests. While these comparisons were encouraging, we do not require significance across three tests as a criterion for reporting—as detailed below, we use the false discovery rate for each test as a stringent correction of significant results.
Table 3.
Sex-specific association using PMASE, logistic regression and Woolf’s test
| Disease | SNP | PMASE p value | Regression p value | Woolf p value |
|---|---|---|---|---|
| CAD | rs7865618 | 0.0214 | 0.0989 | 0.0776 |
| CD | rs3792106 | 0.0019 | 0.0300 | 0.0370 |
| rs6431654 | 0.0101 | 0.0365 | 0.0376 | |
| RA | rs3134926 | 0.0296 | 0.0804 | 0.0584 |
| rs4947244 | 0.0127 | 0.0844 | 0.105 | |
| rs3132666 | 0.0225 | 0.109 | 0.111 | |
| T1D | rs2763979 | 0.0031 | 0.0051 | 0.0030 |
| rs4148873 | 0.0088 | 0.0122 | 0.0095 | |
| rs3131622 | 0.0226 | 0.0208 | 0.0205 | |
| rs480092 | 0.0191 | 0.0328 | 0.0293 | |
| rs3134926 | 0.0285 | 0.0338 | 0.0245 | |
| rs12660883 | 0.0371 | 0.0367 | 0.0518 | |
| Additional SNPs called significant by regression but not by PMASE | ||||
| RA | rs3128963 | 0.427 | 0.00787 | 0.00816 |
| rs9348904 | 0.738 | 0.0132 | 0.0158 | |
| T1D | rs3094123 | 0.0610 | 0.0394 | 0.0768 |
| rs2596571 | 0.0981 | 0.0420 | 0.0924 | |
The likelihood ratio test p values from logistic regression and the Woolf’s test p values are shown for each SNP that is called significant by PMASE. Neither logistic regression nor Woolf’s test finds any SNP with a q value <0.2
Correction for false discovery rate reveals three sexually dimorphic SNPs
We computed false discovery rates on a disease-specific basis to account for the multiple tests performed in each disease (see “Materials and methods”). We computed q values separately for each type of test and set a false discovery rate (FDR) threshold of 0.2. From PMASE, three SNPs in total have q values less than this threshold. In CAD, we found one SNP, rs7865618 on chromosome 9p21 that was significantly differentiated between the sexes. The 9p21 region and more specifically rs7865618 have been previously reported to have significant associations with CAD and T2D (Harismendy et al. 2011; Koch et al. 2011). rs7865618 has a PMASE p value of 0.0261 (q value = 0.053) for CAD and higher OR in males than females (male OR = 1.38, female OR = 1.16). The male p value is 1.38 × 10⁻⁸ but the association is absent in females (female p value = 0.17). We checked the association of rs7865618 with T2D, and while it is not overall genome-wide significant in WTCCC, there does appear to be a slightly stronger male association (male p value = 2.85 × 10⁻³, female p value = 0.086). For CD, two SNPs pass the FDR threshold and are both in the gene ATG16L1 on chromosome 2. rs3792106 has a PMASE p value of 0.0016 (q value = 0.04) and higher OR in females than males (Table 2). rs6431654 has a PMASE p value of 0.011 (q value = 0.18) and a similar difference in ORs between male and female. For both logistic regression and Woolf’s test, no SNP passes this false discovery threshold. The four additional SNPs found by regression (Table 3) also do not pass the false discovery threshold.
Discussion
In this study, we have demonstrated that using a sex-specific approach to analyze results from genome-wide association studies can reveal polymorphisms that are significantly associated with disease in only one sex. We applied our approach to seven common complex diseases to discover novel loci that exhibit putative sex differences in disease association. We proposed a method, PMASE, which discovered sexually dimorphic SNPs in important, previously known disease-associated regions. These findings could shed new light into sex-related differences in disease mechanisms.
We find evidence of sex differences in SNPs in CAD and CD after correcting for false discovery. The CAD SNP rs7865618 is located on chromosome 9p21, an important region known to be involved in coronary artery disease (Helgadottir et al. 2007; McPherson 2010). We find that the association of this SNP with disease is male-specific, which is in agreement with the male-bias in incidence of CAD (Lerner and Kannel 1986). The two loci in CD are in an intronic region of the gene ATG16L1 (Autophagy related 16-like 1), which has been demonstrated in multiple studies to confer increased risk for CD (Cotterill et al. 2010; Hampe et al. 2007; Lacher et al. 2009; Rioux et al. 2007; WTCCC 2007). Here we show that multiple loci in this gene have female-specific disease association. The association for rs3792106 in females is stronger than the association of the SNP in males and females combined and is not genome-wide significant in males alone. We previously discovered sexual dimorphism in ATG16L1 using a hypothesis-driven approach focusing on replicated CD risk loci (Liu et al. 2011), and now we are showing that a more agnostic approach also discovers this result. These SNPs showing evidence of sexual dimorphism in disease risk should be further confirmed in studies with larger overall sample size, however they represent potentially interesting findings, given the known sex differences in prevalence for these diseases.
While we report sex-specific associations that are genome-wide significant in combined-sex analysis, there are likely more SNPs with weaker overall associations but significant sex-specific associations. Our stringent filtering process limits us from finding these SNPs. By focusing only on combined genome-wide significant SNPs, our method may be underpowered for finding effects significant only in one sex. In some cases, the disease cohorts were not sufficiently powered to discover more weakly associated SNPs (some cohorts included only 400 individuals of one sex). It is interesting to note here that the single SNP reported by the WTCCC in their sex-differentiated analysis, rs11761231 in RA, did not meet our Bonferroni correction for disease association significance (nor did it meet WTCCC’s threshold in the original study) and was not included in our analysis. A study that included balanced numbers of individuals and larger cohorts would enable a more thorough investigation of sex-specific effects at a truly genome-wide level. One explanation for the additional SNPs in RA discovered by regression analysis but not by PMASE is that RA is one of the most sex-unbalanced cohorts. By chance, our permutation method may be slightly more likely to generate sampling distributions with many more extreme group differences in these unbalanced cohorts, thus resulting in large PMASE p values (see Supplementary Fig. 1). A method for finding sex differences which takes into consideration unbalanced sample sizes and variances is Welch’s T test on sex-specific regression coefficients as described in Heid et al. (2010). Future genome-wide association studies should consider recruiting large numbers of both male and female cases and controls to enable genome-wide sex-specific analysis.
We could have included more SNPs in our analysis and chosen a less-stringent threshold for LD filtering to discover possible secondary associations or SNP–SNP interactions. However, we chose the stringent thresholds to focus on known important regions and to control for multiple testing by choosing only one SNP per region. This could be expanded in future analyses. Due to our requirement of significant disease-associated SNPs as input to PMASE, it was difficult to find SNPs with opposite effects in males and females in which one allele is protective for one sex while the other allele increases disease risk for the other sex (similar to (Sirota et al. 2009)). These SNPs would not have had significant overall disease associations since the opposite effects in males and females would cancel each other. Therefore, our approach is underpowered to discover flipped effects. Larger overall sample sizes and less stringent thresholds may allow for discovery of these flipped effects on a genome-wide scale. Simulation approaches have shown that if these flipped effects exist, adding sex analysis can increase, rather than decrease, the power of a study (Magi et al. 2010). Testing more SNPs with PMASE, however, would be more computationally intensive and this is a limitation of the PMASE method in comparison to logistic regression or Woolf, which do not require permutation testing. The Woolf method is able to find flipped effects but at the cost of testing all SNPs and losing many possible findings to multiple testing correction. PMASE is the most appropriate for a two-stage study design like the one we have taken here, in which some initial filtering of redundant hypotheses is first performed.
We considered several alternative explanations for the sex differences we observed. First, we visually inspected the signal intensities from the genotyping chip, and found no sign of genotype calling errors (except for one SNP, which we excluded), or other unusual differences between male and females. Second, we considered the possibility that the significant differences between the two groups could be due to a confounding factor rather than an actual difference in disease association. A possible confounding factor in the context of sex-specific disease association is disease prevalence itself, as a large number of diseases have very different incidence rates in men and women. Given that the control individuals represent a sample of the general population, it is likely that a fraction of those control individuals might have a genetic predisposition to the disease but have not yet been diagnosed or do not exhibit symptoms yet. This is a well-known phenomenon in the context of GWAS that leads to a decrease in the statistical power of the study. Therefore, if the prevalence of the disease is higher in one sex, the statistical power of the study in that sex would be lower, which could explain why a SNP shows stronger association in the other sex. The sex-specific p values we find for Crohn’s disease are more strongly associated with CD in female even though CD has a higher prevalence in females (Kappelman et al. 2007). This indicates that we have enough power to detect an effect in females despite the female controls possibly having a higher incidence (and genetic predisposition) of CD. In other words, the large difference we observe in disease association is not likely confounded by a difference in disease prevalence. We find the same situation in the case of CAD, with higher prevalence in males (Lerner and Kannel 1986) and stronger disease association in males.
An oft-mentioned limitation of GWAS is the “missing heritability” problem. The SNPs discovered using GWAS often explain only a tiny fraction of heritability for a particular disease, and have a small effect on increasing an individual’s disease risk (Manolio et al. 2009). However, new advances in using GWAS data along with environmental studies and gene expression analysis in mice are yielding new insights into gene–environment interactions (Cadwell et al. 2010). Studying sex differences can help provide a missing link in terms of different gene-endocrine and gene–environment interactions in males and females. These SNPs can lead to discovery of genes and pathways under differential regulatory control and causing different disease progression in males and females. For example, it is possible that these SNPs lie near binding sites for sex hormones and lead to differential transcriptional control of key genes. This could be investigated in future experiments and may provide insight into novel sex-specific disease mechanisms and help explain why some diseases have a higher prevalence in one sex. These results demonstrate that GWAS and other large-scale genetic association studies should take sex into account, and report sex-specific results.
We have proposed a method to quantify sex differences in disease association in a genome-wide association study, and demonstrated that our approach finds 12 polymorphisms in CAD, CD, RA, and T1D that showed sex-specific association with increased disease risk. After correcting for multiple hypothesis testing, three SNPs are significant using PMASE. We believe that this is one of the first systematic demonstrations of putative sexually dimorphic loci in multiple common complex diseases. Our approach can easily be generalized to apply to any other GWAS in which any binary population feature (not necessarily sex) is present. We propose that the inclusion of sex in the analysis of genetic association studies is necessary to obtain a more complete picture of individual disease risk. A deeper understanding of molecular sex differences will aid in the development of more personalized prevention, diagnosis, and treatment of human disease.
Supplementary Material
Acknowledgments
We acknowledge the following individuals and funding sources for their contribution to this work: Joel Dudley, Rong Chen, Alex Morgan, Michael Walker, Rita Popat, Rob Tibshirani, and Daniel Newburger. We thank Alex Skrenchuk and Boris Oskotsky from Stanford University for computer support. We acknowledge the Hewlett Packard Foundation and Lucile Packard Foundation for Children’s Health for financial support. We also thank the reviewers for their helpful comments. This study makes use of data generated by the Wellcome Trust Case–Control Consortium. A full list of the investigators who contributed to the generation of the data is available from www.wtccc.org.uk. Funding for the project was provided by the Wellcome Trust under award 076113. This work was supported by the US National Institute of General Medical Sciences [R01 GM079719 to A.J.B.] Hewlett Family Stanford Graduate Fellowship to L.Y.L.; National Science Foundation Graduate Research Fellowship to L.Y.L.; Richard and Naomi Horowitz Stanford Graduate Fellowship to M.A.S.; and US National Library of Medicine [T15 LM007033 to M.S.].
Footnotes
Electronic supplementary material The online version of this article (doi:10.1007/s00439-011-1081-y) contains supplementary material, which is available to authorized users
Conflict of interest The authors declare that there are no conflicts of interest related to this manuscript.
Contributor Information
Linda Y. Liu, Email: lyl@stanford.edu, Division of Systems Medicine, Department of Pediatrics, Stanford University School of Medicine, 1265 Welch Road, MS-5415 Room X-163, Stanford, CA 94305-5415, USA; Lucile Packard Children’s Hospital, 725 Welch Road, Palo Alto, CA 94304, USA.
Marc A. Schaub, Computer Science Department, Stanford University, 353 Serra Mall, Stanford, CA 94305, USA, marc.schaub@cs.stanford.edu
Marina Sirota, Email: msirota@stanford.edu, Division of Systems Medicine, Department of Pediatrics, Stanford University School of Medicine, 1265 Welch Road, MS-5415 Room X-163, Stanford, CA 94305-5415, USA; Lucile Packard Children’s Hospital, 725 Welch Road, Palo Alto, CA 94304, USA.
Atul J. Butte, Division of Systems Medicine, Department of Pediatrics, Stanford University School of Medicine, 1265 Welch Road, MS-5415 Room X-163, Stanford, CA 94305-5415, USA, abutte@stanford.edu Lucile Packard Children’s Hospital, 725 Welch Road, Palo Alto, CA 94304, USA.
References
- Arnold AP, van Nas A, Lusis AJ. Systems biology asks new questions about sex differences. Trends Endocrinol Metab. 2009;20:471–476. doi: 10.1016/j.tem.2009.06.007. [DOI] [PMC free article] [PubMed] [Google Scholar]
- Biank V, Broeckel U, Kugathasan S. Pediatric inflammatory bowel disease: clinical and molecular genetics. Inflamm Bowel Dis. 2007a;13:1430–1438. doi: 10.1002/ibd.20213. [DOI] [PubMed] [Google Scholar]
- Biank V, Friedrichs F, Babusukumar U, Wang T, Stoll M, Broeckel U, Kugathasan S. DLG5 R30Q variant is a female-specific protective factor in pediatric onset Crohn’s disease. Am J Gastroenterol. 2007b;102:391–398. doi: 10.1111/j.1572-0241.2006.01011.x. [DOI] [PubMed] [Google Scholar]
- Browning BL, Annese V, Barclay ML, Bingham SA, Brand S, Buning C, Castro M, Cucchiara S, Dallapiccola B, Drummond H, Ferguson LR, Ferraris A, Fisher SA, Gearry RB, Glas J, Henckaerts L, Huebner C, Knafelz D, Lakatos L, Lakatos PL, Latiano A, Liu X, Mathew C, Muller-Myhsok B, Newman WG, Nimmo ER, Noble CL, Palmieri O, Parkes M, Petermann I, Rutgeerts P, Satsangi J, Shelling AN, Siminovitch KA, Torok HP, Tremelling M, Vermeire S, Valvano MR, Witt H. Gender-stratified analysis of DLG5 R30Q in 4707 patients with Crohn disease and 4973 controls from 12 Caucasian cohorts. J Med Genet. 2008;45:36–42. doi: 10.1136/jmg.2007.050773. [DOI] [PubMed] [Google Scholar]
- Burton PR, Clayton DG, Cardon LR, Craddock N, Deloukas P, Duncanson A, Kwiatkowski DP, McCarthy MI, Ouwehand WH, Samani NJ, Todd JA, Donnelly P, Barrett JC, Davison D, Easton D, Evans DM, Leung HT, Marchini JL, Morris AP, Spencer CC, Tobin MD, Attwood AP, Boorman JP, Cant B, Everson U, Hussey JM, Jolley JD, Knight AS, Koch K, Meech E, Nutland S, Prowse CV, Stevens HE, Taylor NC, Walters GR, Walker NM, Watkins NA, Winzer T, Jones RW, McArdle WL, Ring SM, Strachan DP, Pembrey M, Breen G, St Clair D, Caesar S, Gordon-Smith K, Jones L, Fraser C, Green EK, Grozeva D, Hamshere ML, Holmans PA, Jones IR, Kirov G, Moskivina V, Nikolov I, O’Donovan MC, Owen MJ, Collier DA, Elkin A, Farmer A, Williamson R, McGuffin P, Young AH, Ferrier IN, Ball SG, Balmforth AJ, Barrett JH, Bishop TD, Iles MM, Maqbool A, Yuldasheva N, Hall AS, Braund PS, Dixon RJ, Mangino M, Stevens S, Thompson JR, Bredin F, Tremelling M, Parkes M, Drummond H, Lees CW, Nimmo ER, Satsangi J, Fisher SA, Forbes A, Lewis CM, Onnie CM, Prescott NJ, Sanderson J, Matthew CG, Barbour J, Mohiuddin MK, Todhunter CE, Mansfield JC, Ahmad T, Cummings FR, Jewell DP, et al. Association scan of 14,500 nonsynonymous SNPs in four diseases identifies autoimmunity variants. Nat Genet. 2007;39:1329–1337. doi: 10.1038/ng.2007.17. [DOI] [PMC free article] [PubMed] [Google Scholar]
- Cadwell K, Patel KK, Maloney NS, Liu TC, Ng AC, Storer CE, Head RD, Xavier R, Stappenbeck TS, Virgin HW. Virus-plus-susceptibility gene interaction determines Crohn’s disease gene Atg16L1 phenotypes in intestine. Cell. 2010;141:1135–1145. doi: 10.1016/j.cell.2010.05.009. [DOI] [PMC free article] [PubMed] [Google Scholar]
- Chen R, Morgan AA, Dudley J, Deshpande T, Li L, Kodama K, Chiang AP, Butte AJ. FitSNPs: highly differentially expressed genes are more likely to have variants associated with disease. Genome Biol. 2008;9:R170. doi: 10.1186/gb-2008-9-12-r170. [DOI] [PMC free article] [PubMed] [Google Scholar]
- Compston A, Coles A. Multiple sclerosis. Lancet. 2008;372:1502–1517. doi: 10.1016/S0140-6736(08)61620-7. [DOI] [PubMed] [Google Scholar]
- Cotterill L, Payne D, Levinson S, McLaughlin J, Wesley E, Feeney M, Durbin H, Lal S, Makin A, Campbell S, Roberts SA, O’Neill C, Edwards C, Newman WG. Replication and metaanalysis of 13,000 cases defines the risk for interleukin-23 receptor and autophagy-related 16-like 1 variants in Crohn’s disease. Can J Gastroenterol. 2010;24:297–302. doi: 10.1155/2010/480458. [DOI] [PMC free article] [PubMed] [Google Scholar]
- Cutolo M, Capellino S, Montagna P, Villaggio B, Sulli A, Seriolo B, Straub RH. New roles for estrogens in rheumatoid arthritis. Clin Exp Rheumatol. 2003;21:687–690. [PubMed] [Google Scholar]
- Ginsburg GS, Willard HF. Genomic and personalized medicine: foundations and applications. Transl Res. 2009;154:277–287. doi: 10.1016/j.trsl.2009.09.005. [DOI] [PubMed] [Google Scholar]
- Goes FS, Willour VL, Zandi PP, Belmonte PL, MacKinnon DF, Mondimore FM, Schweizer B, DePaulo JR, Jr, Gershon ES, McMahon FJ, Potash JB. Sex-specific association of the Reelin gene with bipolar disorder. Am J Med Genet B Neuropsychiatr Genet. 2010;153B:549–553. doi: 10.1002/ajmg.b.31018. [DOI] [PMC free article] [PubMed] [Google Scholar]
- Graham J. LDheatmap: an R function for graphical display of pairwise linkage disequilibria between single nucleotide polymorphisms. J Stat Soft. 2006;16(3):1–9. [Google Scholar]
- Hampe J, Franke A, Rosenstiel P, Till A, Teuber M, Huse K, Albrecht M, Mayr G, De La Vega FM, Briggs J, Gunther S, Prescott NJ, Onnie CM, Hasler R, Sipos B, Folsch UR, Lengauer T, Platzer M, Mathew CG, Krawczak M, Schreiber S. A genomewide association scan of nonsynonymous SNPs identifies a susceptibility variant for Crohn disease in ATG16L1. Nat Genet. 2007;39:207–211. doi: 10.1038/ng1954. [DOI] [PubMed] [Google Scholar]
- HapMap IC. A haplotype map of the human genome. Nature. 2005;437:1299–1320. doi: 10.1038/nature04226. [DOI] [PMC free article] [PubMed] [Google Scholar]
- Harismendy O, Notani D, Song X, Rahim NG, Tanasa B, Heintzman N, Ren B, Fu XD, Topol EJ, Rosenfeld MG, Frazer KA. 9p21 DNA variants associated with coronary artery disease impair interferon-gamma signalling response. Nature. 2011;470:264–268. doi: 10.1038/nature09753. [DOI] [PMC free article] [PubMed] [Google Scholar]
- Heid IM, Jackson AU, Randall JC, Winkler TW, Qi L, Steinthorsdottir V, Thorleifsson G, Zillikens MC, Speliotes EK, Magi R, Workalemahu T, White CC, Bouatia-Naji N, Harris TB, Berndt SI, Ingelsson E, Willer CJ, Weedon MN, Luan J, Vedantam S, Esko T, Kilpelainen TO, Kutalik Z, Li S, Monda KL, Dixon AL, Holmes CC, Kaplan LM, Liang L, Min JL, Moffatt MF, Molony C, Nicholson G, Schadt EE, Zondervan KT, Feitosa MF, Ferreira T, Allen HL, Weyant RJ, Wheeler E, Wood AR, Estrada K, Goddard ME, Lettre G, Mangino M, Nyholt DR, Purcell S, Smith AV, Visscher PM, Yang J, McCarroll SA, Nemesh J, Voight BF, Absher D, Amin N, Aspelund T, Coin L, Glazer NL, Hayward C, Heard-Costa NL, Hottenga JJ, Johansson A, Johnson T, Kaakinen M, Kapur K, Ketkar S, Knowles JW, Kraft P, Kraja AT, Lamina C, Leitzmann MF, McKnight B, Morris AP, Ong KK, Perry JR, Peters MJ, Polasek O, Prokopenko I, Rayner NW, Ripatti S, Rivadeneira F, Robertson NR, Sanna S, Sovio U, Surakka I, Teumer A, van Wingerden S, Vitart V, Zhao JH, Cavalcanti-Proenca C, Chines PS, Fisher E, Kulzer JR, Lecoeur C, Narisu N, Sandholt C, Scott LJ, Silander K, Stark K, Tammesoo ML, et al. Meta-analysis identifies 13 new loci associated with waist-hip ratio and reveals sexual dimorphism in the genetic basis of fat distribution. Nat Genet. 2010;42:949–960. doi: 10.1038/ng.685. [DOI] [PMC free article] [PubMed] [Google Scholar]
- Helgadottir A, Thorleifsson G, Manolescu A, Gretarsdottir S, Blondal T, Jonasdottir A, Sigurdsson A, Baker A, Palsson A, Masson G, Gudbjartsson DF, Magnusson KP, Andersen K, Levey AI, Backman VM, Matthiasdottir S, Jonsdottir T, Palsson S, Einarsdottir H, Gunnarsdottir S, Gylfason A, Vaccarino V, Hooper WC, Reilly MP, Granger CB, Austin H, Rader DJ, Shah SH, Quyyumi AA, Gulcher JR, Thorgeirsson G, Thorsteinsdottir U, Kong A, Stefansson K. A common variant on chromosome 9p21 affects the risk of myocardial infarction. Science. 2007;316:1491–1493. doi: 10.1126/science.1142842. [DOI] [PubMed] [Google Scholar]
- Kappelman MD, Rifas-Shiman SL, Kleinman K, Ollendorf D, Bousvaros A, Grand RJ, Finkelstein JA. The prevalence and geographic distribution of Crohn’s disease and ulcerative colitis in the United States. Clin Gastroenterol Hepatol. 2007;5:1424–1429. doi: 10.1016/j.cgh.2007.07.012. [DOI] [PubMed] [Google Scholar]
- Koch W, Turk S, Erl A, Hoppmann P, Pfeufer A, King L, Schomig A, Kastrati A. The chromosome 9p21 region and myocardial infarction in a European population. Atherosclerosis. 2011 doi: 10.1016/j.atherosclerosis.2011.03.014. [DOI] [PubMed] [Google Scholar]
- Kolz M, Johnson T, Sanna S, Teumer A, Vitart V, Perola M, Mangino M, Albrecht E, Wallace C, Farrall M, Johansson A, Nyholt DR, Aulchenko Y, Beckmann JS, Bergmann S, Bochud M, Brown M, Campbell H, Connell J, Dominiczak A, Homuth G, Lamina C, McCarthy MI, Meitinger T, Mooser V, Munroe P, Nauck M, Peden J, Prokisch H, Salo P, Salomaa V, Samani NJ, Schlessinger D, Uda M, Volker U, Waeber G, Waterworth D, Wang-Sattler R, Wright AF, Adamski J, Whitfield JB, Gyllensten U, Wilson JF, Rudan I, Pramstaller P, Watkins H, Doering A, Wichmann HE, Spector TD, Peltonen L, Volzke H, Nagaraja R, Vollenweider P, Caulfield M, Illig T, Gieger C. Meta-analysis of 28, 141 individuals identifies common variants within five new loci that influence uric acid concentrations. PLoS Genet. 2009;5:e1000504. doi: 10.1371/journal.pgen.1000504. [DOI] [PMC free article] [PubMed] [Google Scholar]
- Lacher M, Schroepf S, Ballauff A, Lohse P, von Schweinitz D, Kappler R, Koletzko S. Autophagy 16-like 1 rs2241880 G allele is associated with Crohn’s disease in German children. Acta Paediatr. 2009;98:1835–1840. doi: 10.1111/j.1651-2227.2009.01438.x. [DOI] [PubMed] [Google Scholar]
- Lerner DJ, Kannel WB. Patterns of coronary heart disease morbidity and mortality in the sexes: a 26-year follow-up of the Framingham population. Am Heart J. 1986;111:383–390. doi: 10.1016/0002-8703(86)90155-9. [DOI] [PubMed] [Google Scholar]
- Lindgren CM, Heid IM, Randall JC, Lamina C, Steinthorsdottir V, Qi L, Speliotes EK, Thorleifsson G, Willer CJ, Herrera BM, Jackson AU, Lim N, Scheet P, Soranzo N, Amin N, Aulchenko YS, Chambers JC, Drong A, Luan J, Lyon HN, Rivadeneira F, Sanna S, Timpson NJ, Zillikens MC, Zhao JH, Almgren P, Bandinelli S, Bennett AJ, Bergman RN, Bonnycastle LL, Bumpstead SJ, Chanock SJ, Cherkas L, Chines P, Coin L, Cooper C, Crawford G, Doering A, Dominiczak A, Doney AS, Ebrahim S, Elliott P, Erdos MR, Estrada K, Ferrucci L, Fischer G, Forouhi NG, Gieger C, Grallert H, Groves CJ, Grundy S, Guiducci C, Hadley D, Hamsten A, Havulinna AS, Hofman A, Holle R, Holloway JW, Illig T, Isomaa B, Jacobs LC, Jameson K, Jousilahti P, Karpe F, Kuusisto J, Laitinen J, Lathrop GM, Lawlor DA, Mangino M, McArdle WL, Meitinger T, Morken MA, Morris AP, Munroe P, Narisu N, Nordstrom A, Nordstrom P, Oostra BA, Palmer CN, Payne F, Peden JF, Prokopenko I, Renstrom F, Ruokonen A, Salomaa V, Sandhu MS, Scott LJ, Scuteri A, Silander K, Song K, Yuan X, Stringham HM, Swift AJ, Tuomi T, Uda M, Vollenweider P, Waeber G, Wallace C, Walters GB, Weedon MN, et al. Genome-wide association scan meta-analysis identifies three Loci influencing adiposity and fat distribution. PLoS Genet. 2009;5:e1000508. doi: 10.1371/journal.pgen.1000508. [DOI] [PMC free article] [PubMed] [Google Scholar]
- Liu LY, Schaub MA, Sirota M, Butte AJ. Transmission distortion in Crohn’s disease risk gene ATG16L1 leads to sex difference in disease association. Inflamm Bowel Dis. 2011 doi: 10.1002/ibd.21781. [DOI] [PMC free article] [PubMed] [Google Scholar]
- Magi R, Lindgren CM, Morris AP. Meta-analysis of sex-specific genome-wide association studies. Genet Epidemiol. 2010;34:846–853. doi: 10.1002/gepi.20540. [DOI] [PMC free article] [PubMed] [Google Scholar]
- Manolio TA, Collins FS, Cox NJ, Goldstein DB, Hindorff LA, Hunter DJ, McCarthy MI, Ramos EM, Cardon LR, Chakravarti A, Cho JH, Guttmacher AE, Kong A, Kruglyak L, Mardis E, Rotimi CN, Slatkin M, Valle D, Whittemore AS, Boehnke M, Clark AG, Eichler EE, Gibson G, Haines JL, Mackay TF, McCarroll SA, Visscher PM. Finding the missing heritability of complex diseases. Nature. 2009;461:747–753. doi: 10.1038/nature08494. [DOI] [PMC free article] [PubMed] [Google Scholar]
- McPherson R. Chromosome 9p21 and coronary artery disease. N Engl J Med. 2010;362:1736–1737. doi: 10.1056/NEJMcibr1002359. [DOI] [PubMed] [Google Scholar]
- Ober C, Loisel DA, Gilad Y. Sex-specific genetic architecture of human disease. Nat Rev Genet. 2008;9:911–922. doi: 10.1038/nrg2415. [DOI] [PMC free article] [PubMed] [Google Scholar]
- Rioux JD, Xavier RJ, Taylor KD, Silverberg MS, Goyette P, Huett A, Green T, Kuballa P, Barmada MM, Datta LW, Shugart YY, Griffiths AM, Targan SR, Ippoliti AF, Bernard EJ, Mei L, Nicolae DL, Regueiro M, Schumm LP, Steinhart AH, Rotter JI, Duerr RH, Cho JH, Daly MJ, Brant SR. Genome-wide association study identifies new susceptibility loci for Crohn disease and implicates autophagy in disease pathogenesis. Nat Genet. 2007;39:596–604. doi: 10.1038/ng2032. [DOI] [PMC free article] [PubMed] [Google Scholar]
- Rosenberg NA, Huang L, Jewett EM, Szpiech ZA, Jankovic I, Boehnke M. Genome-wide association studies in diverse populations. Nat Rev Genet. 2010;11:356–366. doi: 10.1038/nrg2760.nrg2760 [DOI] [PMC free article] [PubMed] [Google Scholar]
- Shifman S, Johannesson M, Bronstein M, Chen SX, Collier DA, Craddock NJ, Kendler KS, Li T, O’Donovan M, O’Neill FA, Owen MJ, Walsh D, Weinberger DR, Sun C, Flint J, Darvasi A. Genome-wide association identifies a common variant in the reelin gene that increases the risk of schizophrenia only in women. PLoS Genet. 2008;4:e28. doi: 10.1371/journal.pgen.0040028. [DOI] [PMC free article] [PubMed] [Google Scholar]
- Sirota M, Schaub MA, Batzoglou S, Robinson WH, Butte AJ. Autoimmune disease classification by inverse association with SNP alleles. PLoS Genet. 2009;5:e1000792. doi: 10.1371/journal.pgen.1000792. [DOI] [PMC free article] [PubMed] [Google Scholar]
- Whitacre CC. Sex differences in autoimmune disease. Nat Immunol. 2001;2:777–780. doi: 10.1038/ni0901-777. [DOI] [PubMed] [Google Scholar]
- Woolf B. On estimating the relation between blood group and disease. Ann Hum Genet. 1955;19:251–253. doi: 10.1111/j.1469-1809.1955.tb01348.x. [DOI] [PubMed] [Google Scholar]
- WTCCC. Genome-wide association study of 14,000 cases of seven common diseases and 3,000 shared controls. Nature. 2007;447:661–678. doi: 10.1038/nature05911. [DOI] [PMC free article] [PubMed] [Google Scholar]
Associated Data
This section collects any data citations, data availability statements, or supplementary materials included in this article.