

Abstract
HER2/Neu is overexpressed in 20-30% of breast cancers and associated with aggressive phenotypes and poor prognosis. For deciphering the role of HER2/Neu in breast cancer, mouse mammary tumor virus (MMTV)-Her2/neu transgenic mice that develop mammary tumors resembling human HER2-subtype breast cancer have been established. Several recent studies have revealed that HER2/Neu is overexpressed in and regulates self renewal of breast tumor initiating cells (TICs). However, in the MMTV-Her2/neu transgenic mouse model, the identity of TICs remains elusive, despite previous studies showing supportive evidence for existence of TICs in Her2/neu-induced mammary tumors. Through systematic screening and characterization, we identified surface markers CD49f, CD61 and ESA were aberrantly overexpressed in Her2-overexpressing mammary tumor cells. Analysis of these markers as well as CD24 detected anomalous expansion of the luminal progenitor population in preneoplastic mammary glands of Her2/neu-transgenic mice, indicating that aberrant luminal progenitors originated Her2-induced mammary tumors. The combined markers, CD49f and CD61, further delineated the CD49fhighCD61high-sorted fraction as a TIC-enriched population, which displayed increased tumorsphere formation ability, enhanced tumorigenicity both in vitro and in vivo and drug resistance to pacitaxel and doxorubicin. Moreover, the TIC-enriched population manifested increased TGFβ signaling and exhibited gene expression signatures of stemness, TGFβ signaling and Epithelial-to-Mesenchymal Transition. Our findings that self-renewal and clonogenicity of TICs were suppressed by pharmacologically inhibiting the TGFβ signaling further indicate that the TGFβ pathway is vital for maintenance of the TIC population. Finally, we showed that the integrin β3 (CD61) signaling pathway was required for sustaining active TGFβ signaling and self-renewal of TICs. We for the first time developed a technique to highly enrich TICs from mammary tumors of Her2/neu-transgenic mice, unraveled their properties and identified the cooperative integrin β3-TGFβ signaling axis as a potential therapeutic target for HER2-induced TICs.
Keywords: Tumor Initiating Cells, Her2/neu, mammary tumor, CD49f, CD61, ESA
Introduction
According to the cancer stem cell hypothesis, a variety of tumors may be initiated and maintained by a subpopulation of cells that exhibit characteristics of stem cells. In addition to driving carcinogenesis, these stem-cell-like cancer cells (CSCs), also called tumor initiating cells (TICs), may contribute to therapeutic resistance (Clarke et al., 2006). Several recent studies have shown that human epidermal growth factor receptor 2 (HER2) may play a role in regulation of the TIC population. First, TICs of HER2-overexpressing breast cancer cell lines express the highest HER2 levels in the bulk cell population (Magnifico et al., 2009). Second, overexpression of HER2 in normal mammary epithelial cells increases the proportion of stem/progenitor cells (Korkaya et al., 2008). Thirdly, the HER2 inhibitor (trasuzumab or lapitinib) is able to specifically target this HER2-overexpressing TIC population (Korkaya et al., 2008; Magnifico et al., 2009). Lastly, a decrease in TICs was observed in HER2-positive tumors of patients receiving the EGFR/HER2 inhibitor treatment (Li et al., 2008). These lines of evidence suggest that the HER2 signaling drives carcinogenesis through regulation of the mammary stem/progenitor cell population.
The role of Her2/neu in regulating TIC properties was also studied in the MMTV-Her2/neu transgenic mouse model. Liu et al. first functionally identified the existence of TICs in primary mammary tumors of MMTV-Her2/neu-transgenic mice (Liu et al., 2007) and Cicalese et al. showed that the self-renewal division of TICs is more frequent in Her2/neu-induced tumors than normal stem cells in their normal counterparts (Cicalese et al., 2009). Furthermore, the gene profiles of MMTV-Her2/neu mammary tumors are most congruent with the gene signature of luminal progenitor cells, suggesting that Her2-induced mammary tumors may be developed from altered mammary luminal progenitor cells (Lim et al., 2010). Despite supportive evidence from these studies, currently there are no available methods developed for isolation or enrichment of TICs from Her2/neu-induced mammary tumors. Therefore, even though MMTV-Her2/neu-transgenic mice have been used as a Her2-mediated tumorigenic animal model for about two decades (Guy et al., 1992), the identity of TICs in Her2/neu-induced mammary tumors remains largely unknown.
To identify and characterize the putative TICs in the MMTV-Her2/neu transgenic mouse model, we screened numerous putative stem/progenitor marker combinations to subdivide the primary mammary tumor cells and their derivative primary cell cultures. By analyzing these markers, we identified luminal progenitors potentially giving rise to Her2-induced TICs. Importantly, we found that the CD49fhighCD61high tumor cell subset represents a TIC-enriched population and the cooperative integrin β3-TGFβ signaling axis is vital for maintaining Her2-induced TICs. These findings, taken together, suggest that targeting of the cooperative integrin β3-TGFβ signaling could be developed for the TIC-targeting therapy to treat HER2/Neu-positive breast cancer patients.
Results
Identification of TIC biomarkers for Her2/neu-induced mammary tumors
To identify potential stem-cell biomarkers and characterize molecular traits of stemness in Her2-induced mammary tumors, we performed gene expression profiling analysis of twenty-six putative stem cell markers and five epithelial lineage-specific markers (Supplementary Table 1 and 2) on H6O5 cells derived from Her2-induced mouse primary mammary gland tumors and NMuMG cells, a nontransformed mouse mammary epithelial cell line (Hynes et al., 1985) serving as a normal control for comparison. Before gene expression analysis, Her2/neu overexpression in H6O5 cells has been confirmed by Western blot analysis and its levels were almost equivalent to those in primary Her2 tumors (Supplementary Figure 1). 9 out of 26 analyzed genes were expressed at higher levels in H6O5 than in NMuMG, including Abcg2, CD49f, CD61, ESA, Nanog, Notch3, Oct3/4, Stat3 and Tp63 (Supplementary Table 2 and Figure 1a). Among lineage-specific markers, H6O5 cells expressed slightly less mRNA levels of CD24 and the luminal marker Keratin 18 (Krt18) and higher levels of myoepithelial markers such as Keratin 5 (Krt5) and Keratin 14 (Krt14) than NMuMG cells (Supplementary Table 2). To further validate that 9 aberrantly overexpressed genes identified in H6O5 cells were not attributable to forced in vitro culture condition, we performed qRT-PCR analysis on two samples each of isolated in vivo normal epithelial cells from FVB/N mammary glands and tumor epithelial cells from primary Her2/neu mammary gland tumors. As shown in Figure 1b, 8 out of 9 genes (except Stat3) consistently showed aberrant overexpression in primary Her2/neu mammary tumor epithelial cells compared to age-matched normal FVB/N mammary epithelial cells.
Figure 1.
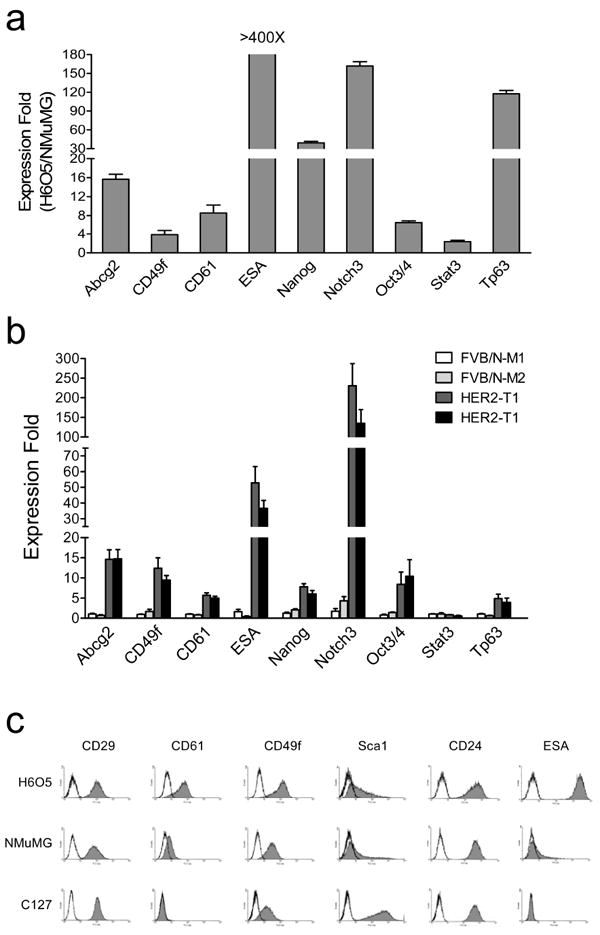
Expression analysis of stem cell marker genes in the tumor cell line derived from primary MMTV-Her2/neu tumor. (a) Quantitative RT-PCR analysis of stem cell marker genes in H6O5 cells vs. NMuMG cells. The mean and SD are calculated from triplicate experiments. (b) Quantitative expression analysis of stem cell marker genes in normal mammary epithelial cells from FVB/N mice as well as in mammary tumor epithelial cells of primary tumors from Her2/neu-transgenic mice. Two different cDNA samples each for normal or tumor epithelial cells were analyzed by real-time qRT-PCR assays. The expression folds (mean ± SD) from triplicate experiments are shown. (c) Flow cytometric (FACS) analysis of stem cell surface antigens in H6O5 cells and two immortalized mouse mammary epithelial cell lines, NMuMG and C127. Histograms are shown for displaying distributions of antibody-staining intensities of surface antigens (CD29, CD61, CD49f, Sca1, CD24 and ESA) vs. cell numbers.
Among these differentially expressed genes, CD49f (integrin α6), CD61 (integrin β3) and ESA have been identified and used as bona fide markers for the enrichment of normal and cancer stem cells (Stingl et al., 2006; Asselin-Labat et al., 2007; Vaillant et al., 2008; Lim et al., 2010). To validate qRT-PCR results and evaluate whether these selected markers can be potentially used to identify and enrich TICs, FACS analysis was performed on H6O5 cells and two normal mammary epithelial cell lines (NMuMG and C127) to examine the expression status of selected markers, including CD49f, CD29, CD61, Sca1, CD24 and ESA (EpCAM). CD49f, CD61 and ESA were selected due to their aberrant overexpression in H6O5 cells and primary tumors (Figure 1a and 1b). CD29 and Sca1 were also chosen since they have been used as markers to identify normal and neoplastic mammary stem and/or progenitor cells (Welm et al., 2003; Shackleton et al., 2006; Stingl et al., 2006; Asselin-Labat et al., 2007). CD24 was included in our study based on the studies by Liu et al., showing that only CD24+ Her2/neu tumor cells are tumorigenic (Liu et al., 2007). As shown in Figure 1c, CD49f, CD61 and ESA were expressed at higher levels in H6O5 cells than in the control cell lines, consistent with the mRNA expression data (Figure 1a). CD29 and CD24 were almost equivalently expressed between these three cell lines (Figure 1c). Sca1 was highly expressed in C127 cells compared to H6O5 and NMuMG cells (Figure 1c). Overall, these data suggest that CD49f, CD61 and ESA are potential candidates as TIC markers due to their differential expression in Her2/neu-transformed tumor cells compared to non-transformed mammary epithelial cells.
Her2/neu-induced tumors are potentially developed from the luminal progenitor population
MMTV-Her2/neu transgenic mice develop undifferentiated adenocarcinomas after a long latency (6-12 months) (Guy et al., 1992). To identify the origin of Her2-transformed TICs, we examined changes in cellular subsets of preneoplastic mammary glands. The previous study showed that CD24 and CD49f can identify mammary stem cells (mammary repopulating units, MRUs) and progenitor cells (mammary colony-forming cells, Ma-CFCs) (Stingl et al., 2006). We reproduced these data as shown in Figure 2a (the top panel). Intriguingly, the progenitor cell population (Lin−CD24highCD49fmed/low cells) was aberrantly expanded in preneoplastic mammary glands of MMTV-Her2/neu transgenic mice compared to normal counterparts of wild-type FVB/N mice (9.8% vs. 3.1%), which overlapped the majority (79.2%) of the primary tumor cell population (Figure 2a). The percentage of the mammary stem cell population (Lin−CD24medCD49fhigh, MRUs) remained unchanged in preneoplastic mammary glands of transgenic mice relative to wild-type mice (0.8% vs. 0.7%). We also analyzed the FACS profiles of CD49f and ESA due to the recent findings that these two markers could delineate cellular subsets in human mammary glands (Lim et al., 2009). Analogous to the CD24CD49f combination, ESA and CD49f could define the MRU and Ma-CFC populations (Figure 2a, the middle panel). Again, the Lin−ESAhighCD49med/low Ma-CFC population, but not the Lin−ESAmedCD49fhigh MRU population, was anomalously expanded in premalignant mammary glands of Her2/neu-transgenic mice (Figure 2a). The FACS patterns showing expansion of the Ma-CFC population in Her2/neu preneoplastic mammary glands (Figure 2a) were reproducible in multiple mice (n > 4) (data not shown). Among Lin−CD24+ mammary epithelial cells, the percentage of Lin−CD49f+ cells progressively increased with tumor development (wild type 24.3%, preneoplastic gland 36.8% and tumor 81.8%) (Figure 2a, the bottom panel). According to the studies by Stingl et al., Ma-CFCs preferentially express luminal markers such as Keratin 18 and Keratin 19, indicating that they are luminal progenitor cells (Stingl et al., 2006). We also found that Ma-CFCs exhibited the ESAhigh profile, a typical luminal feature (Lim et al., 2009). Therefore, our and other lines of evidence, taken together, suggest that the origin of Her2/neu-induced mammary tumor cells is derived from the aberrant luminal progenitor cells.
Figure 2.
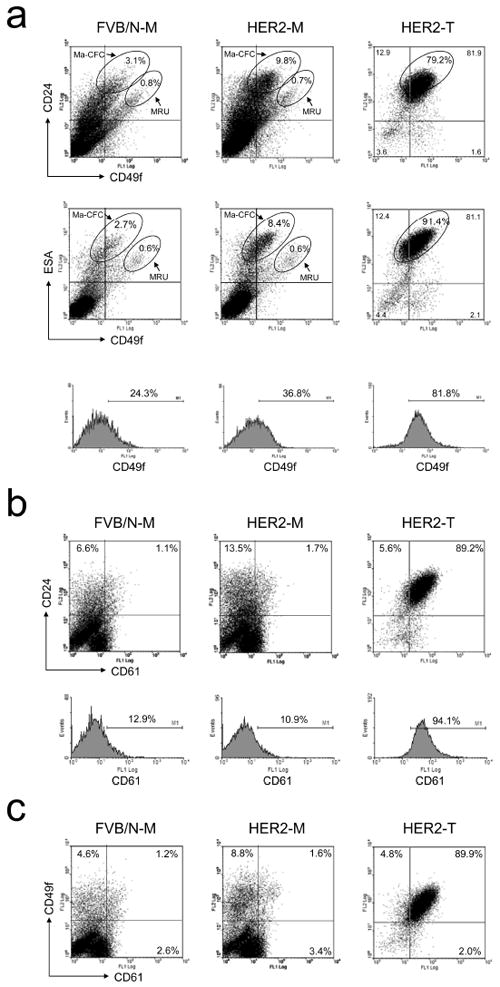
FACS analysis of CD49f, CD24, ESA and CD61 in normal mammary glands, MMTV-Her2/neu preneoplastic mammary glands and tumors. FACS analysis was performed to examine the protein expression of CD49f, CD24, ESA and CD61 on mammary glands of FVB/N mice as well as Her2/neu-transgenic mice and on primary mammary tumors arising in MMTV-Her2/neu-transgenic mice. CD24 vs. CD49f as well as ESA vs. CD49f, CD24 vs. CD61 and CD49f vs. CD61 are shown in (a), (b) and (c), respectively. Histogram analyses of CD49f and CD61 are shown in the bottom panels of subfigure (a) and (b), respectively. FVB/N-M: control mammary gland; HER2-M: Her2/neu-transgenic mouse mammary gland; NER2-T: Her2/neu tumor.
We also analyzed the cellular subset expressing CD61 in combination with CD24 or CD49f during tumor development in MMTV-Her2/neu transgenic mice. Preneoplastic mammary glands exhibited a slight increase in both Lin−CD24+CD61+ (1.7% vs. 1.1%) and Lin−CD49f+CD61+ cells (1.6% vs. 1.2%) compared to wild-type counterparts, but both Lin−CD24+CD61+ (89.2%) and Lin−CD49f+CD61+ (89.9%) cell populations were drastically expanded in primary tumors (Figure 2b and 2c). The expansion of Lin−CD24+CD61+ and Lin−CD49f+CD61+ cells in primary tumors was mainly due to a dramatic increase in the Lin−CD61+ cell population, and more importantly there was a significant, tumor-specific increase in the expression level of CD61 at the cellular level. Thus, the transition from preneoplasia to tumor formation is characterized by a significant increase in CD24/ESA/CD49f/CD61-quadruple positive cells (Figure 2).
The CD49fhighCD61high subpopulation exhibits the CD24highESAhigh profile and TIC’s characteristics
According to the Figure 2 results, we identified CD49f, CD61, ESA and CD24 as potential TIC’s makers since they can be used to track the transformed transition from luminal progenitor cells to Her2-induced tumor cells. To ascertain which two-antigen combination is potential for identifying the TIC population, we performed FACS analysis of five different antigen combinations on in vitro cultured H6O5 cells, in vivo H6O5-derived xenograft tumors and primary Her2 mammary tumors. As shown in Figure 3a, the FACS profiles of H6O5-derived xenograft tumors were almost identical to those of primary Her2 tumors, demonstrating that the primary H6O5 line is a suitable cell model for studying Her2-induced primary mammary gland tumors. Among the FACS profiles of in vitro cultured H6O5 cells, only CD49f/CD61, ESA/CD61 and ESA/CD49f were akin to those in xenograft and primary tumors (Figure 3a). The differences in CD24/CD61 and CD24/CD49f profiles between in vitro cultured tumor cells and in vivo tumors might be attributable to in vitro culture condition. For identifying both in vitro and in vivo TICs, CD49f, CD61 and ESA are suitable markers for further studies. However, due to very strong fluorescent staining of ESA in H6O5 cells, we preferred the CD49f/CD61 combination for the FACS gating in cell sorting analysis. To develop a promising FACS gating strategy, we used the CD49f/CD61 profile of NMuMG to set the quadrant threshold lines for defining three different subpopulations in H6O5 cells (Figure 3b). These three subsets, CD49fhighCD61high, CD49fhighCD61low and CD49flowCD61low, are 12-15%, 35-40% and 25-30%, respectively, of total cells. To investigate the relationship between these three gated populations and ESA/CD24 profiles, we performed four-color FACS analysis on H605 cells using antibodies against these four markers. As shown in Figure 3b, 89.9% of CD49f highCD61high subset cells overlapped CD24highESAhigh compared to only 25.4% of CD49f lowCD61low subset cells. A strong correlation between these four potential stem/progenitor cell markers suggests that tumor cell types in Her2/neu-induced mammary tumors are heterogeneous and may be organized like a hierarchy proposed in the cancer stem cell model. This phenomenon has also been confirmed using isolated in vivo tumor cells (data not shown).
Figure 3.
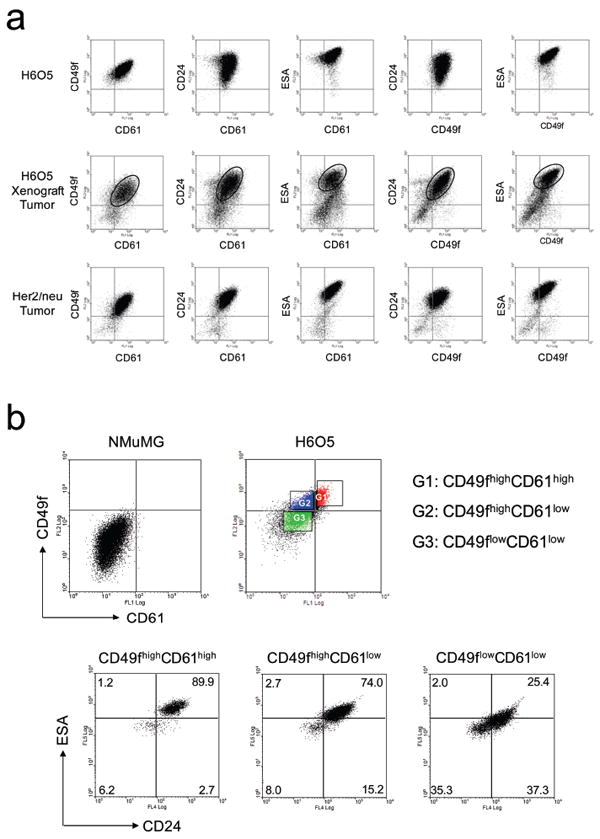
FACS profiling analysis of in vitro and in vivo Her2-overexpressing mammary tumor cells. (a) FACS profiling of CD49f, CD61, CD24 and ESA in in vitro cultured H6O5 cells, in vivo H6O5-derived xenograft tumors and primary Her2-induced mammary tumors. Isolated tumor cells were stained with several different combinations of antibodies against two surface antigens as indicated for two-color FACS analysis. The areas of two-color cell staining patterns in dot plot analysis of H6O5-derived xenograft tumors corresponding to those of primary Her2/neu tumors are circled. (b) FACS analysis of CD24 and ESA in gated CD49fhighCD61high, CD49fhighCD61low and CD49flowCD61low H6O5 cells. H6O5 cells were stained with CD61-FITC, CD49f-PE, CD24-APC and ESA-APC-Cy7 antibodies for four-color FACS analysis. The FACS profile of CD49f and CD61 in NMuMG cells was used to set the quadrant lines for defining high and low intensities of CD49f and CD61 in H6O5 cells.
To address whether CD49f and CD61 are useful markers for enriching TICs, we examined tumorsphere formation abilities of these sorted fractions. The CD49f highCD61high subpopulation exhibited the highest tumorsphere formation efficiency (2.8 ± 0.6%) compared to CD49f highCD61low and CD49f lowCD61low populations displaying much lower efficiencies (0.8 ± 0.3% and 0.3 ± 0.1%, respectively) (Figure 4a). The observed significant increase in tumorsphere formation ability indicates that TICs are enriched in the CD49fhighCD61high subpopulation.
Figure 4.
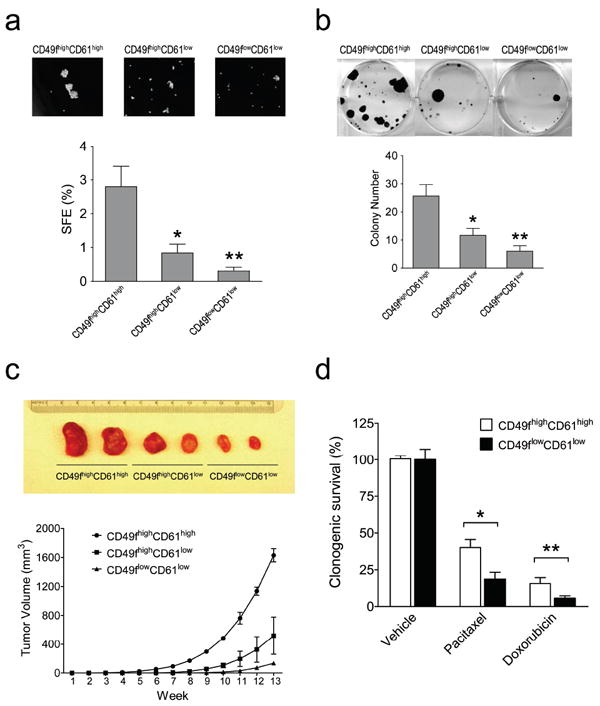
Isolated CD49fhighCD61high cells exhibit features of Tumor-initiating cells. (a) Enhanced tumorsphere formation ability in CD49fhighCD61high cells. Sorted H6O5 cells were cultured in serum-free medium for sphere formation assay. SFE: sphere formation efficiency. (b) Increased clonogenic ability in CD49fhighCD61high cells. 1000 sorted H6O5 cells were seeded for clonogenic analysis. Bar graphs (the bottom panel) shown in (a) and (b) were generated from triplicate experiments. Error bars indicate SD. The symbols (*, **) indicate statistically significant differences (p < 0.05) in sphere (a) or colony (b) numbers of the other two sorted fractions compared to that of the CD49fhighCD61high fraction. (c) CD49fhighCD61high cells showed the early onset of in vivo tumor formation. 5000 sorted H6O5 cells were transplanted into the mammary glands of syngeneic mice. The tumor formation was monitored for 13 weeks, and then mice were sacrificed and dissected. The dissected tumors were photographed and shown in the top panel. (d) CD49fhighCD61high cells manifest drug resistance to pacitaxel and doxorubicin. Sorted H6O5 cells were treated with pacitaxel (2 nM) for 24 h and doxorubicin (25 ng/ml) for 10 h, and then 5000 drug-treated cells each were plated in a 6-cm cell culture dish for clonogenic assays. Two weeks later, cell colonies were stained with crystal violet and colony numbers were counted for determining the percentages of clonogenic survival (drug-treated cells relative to vehicle-treated cells). The mean and SD of each drug-treated cell survival dataset were derived from triplicate experiments. The symbols (*, **) indicate a statistically significant difference (p < 0.05) in clonogenic survival percentages of drug-treated CD49fhighCD61high cells compared to those of drug-treated CD49flowCD61low cells.
Given that tumorigenicity is one of the hallmarks of TICs, we assessed the tumorigenic potential of the sorted cells with in vitro clonogenic and in vivo transplantation assays. As shown in Figure 4b, CD49fhighCD61high cells exhibited the highest clonogenic ability compared to other two subset cells. For in vivo transplantation assays, we transplanted serially diluted sorted subset cells from H6O5 or primary tumors, ranging from 5000 to 20, into syngeneic mice. For primary tumors, Lin−CD49f highCD61high subset cells showed the highest TIC frequency (1/70) compared to other two subset cells showing much lower TIC frequencies (1/239 for Lin−CD49f highCD61low and 1/1234 for Lin−CD49f lowCD61low) (Table 1). The sorted cells from H6O5 manifested a similar trend of TIC frequencies (Table 1). Therefore, TICs in MMTV-Her2/neu mammary tumors or in H6O5 cells were significantly enriched in the CD49f highCD61high population. In addition to the highest frequency of TICs, the CD49f highCD61high subpopulation conferred an earliest onset of tumor formation compared to other two populations (Figure 4c). To address whether the CD49f highCD61high subpopulation possesses the drug-resistant characteristic of cancer stem cells, clonogenic assays were performed on sorted CD49f highCD61high and CD49f lowCD61low H6O5 cells treated with pacitaxel or doxorubicin. Indeed, CD49f highCD61high cells were more resistant to these chemotherapeutic agents than CD49f lowCD61low cells (Figure 4d).
Table 1.
Frequency of TICs after transplantation of sorted H6O5 cells or primary mammary tumor cells into syngeneic mice
| Injected cell number | 5000 | 1000 | 100 | 50 | 20 | Frequency(TIC/cells) |
|---|---|---|---|---|---|---|
| Sorted H6O5 cells | ||||||
| CD49fhighCD61high | 2/2 | 2/2 | 3/4 | 1/4 | 1/4 | 1/62 |
| CD49fhighCD61low | 2/2 | 2/2 | 1/4 | 0/4 | 0/4 | 1/176 |
| CD49flowCD61low | 2/2 | 2/2 | 0/4 | 0/4 | 0/4 | NA |
| Sorted primary tumor cells | ||||||
| Lin−CD49fhighCD61high | 4/4 | 4/4 | 5/6 | 3/6 | NA | 1/70 |
| Lin−CD49fhighCD61low | 4/4 | 4/4 | 1/6 | 0/6 | NA | 1/239 |
| Lin−CD49flowCD61low | 4/4 | 2/4 | 0/6 | 0/6 | NA | 1/1234 |
Cancer stem cells (CSCs) are endowed with the ability to self-renew indefinitely and differentiate into phenotypically diverse cells. To reveal whether the CD49f highCD61high subpopulation exhibits these CSC features, we analyzed cellular subtypes in xenograft tumors derived from these three sorted cell fractions. The tumors derived from the CD49f highCD61high subpopulation were composed of cell populations similar to the original primary tumors, demonstrating that the CD49f highCD61high subpopulation is able to self-renew its own population (12.2± 0.7%) and also convert into other cell populations during tumor formation (Figure 5). In contrast, the tumors derived from CD49f highCD61low and CD49flowCD61low fractions contained significantly lower percentages of the CD49f highCD61high subpopulation (7.9 ± 0.6% and 1.6 ± 0.6%, respectively) (Figure 5), indicating that these two sorted cell fractions contain less CSCs than the CD49f highCD61high fraction. These results show that CD49f highCD61high cells exhibit CSC traits of self-renewal and regeneration of heterogeneity of primary tumors.
Figure 5.
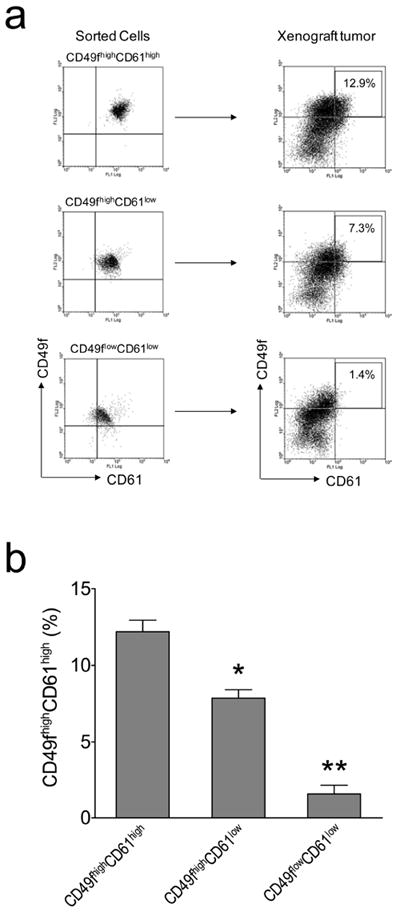
Repopulation of CD49fhighCD61high H6O5 cells during the development of xenograft tumors. (a) FACS analysis of CD49f and CD61 was performed on isolated CD49fhighCD61high, CD49fhighCD61low and CD49flowCD61low H6O5 cells as well as their respective xenograft tumors. CD49fhighCD61high cells in xenograft tumors are boxed and their percentage is indicated in the box. (b) FACS data in (a) from triplicate transplantation experiments were plotted as a bar graph with error bars (indicating SD). The symbols (*, **) indicate a statistically significant difference (p < 0.05) in CD49fhighCD61high percentages.
The TGFβ signaling and expression of EMT genes are specifically activated in the CD49fhighCD61high subpopulation
To further characterize TICs in Her2/neu tumors, gene expression profiling analysis was performed to examine expression of putative stem cell and differentiation marker genes. The cancer stem cell markers Abcg2 (Ishikawa and Nakagawa, 2009), Aldh1 (Ginestier et al., 2007), CD133 (Wright et al., 2008), Gli1 (Liu et al., 2006) and Tp63 (Hanker et al., 2010) were highly expressed in the CD49f highCD61high subpopulation compared to other two sorted subpopulations (Figure 6a). In contrast, the expression levels of differentiation marker genes such as Krt5, Krt6, Krt14 and Krt18 were lowest in CD49f highCD61high cells (Figure 6b). These data further confirm that the CD49f highCD61high subpopulation is enriched for TICs with stem cell characteristics.
Figure 6.
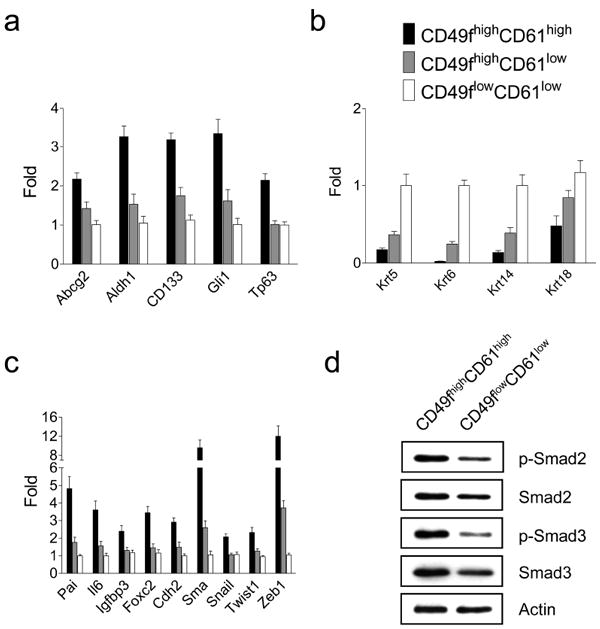
Isolated CD49fhighCD61high cells display the stemness, TGFβ signaling and EMT gene signatures. Quantitative RT-PCR analysis of stem cell (a), differentiation (b) and TGFβ/EMT (c) marker genes were performed on isolated CD49fhighCD61high, CD49fhighCD61low and CD49flowCD61low H6O5 cells. The mean and SD of each gene expression data were derived from triplicate experiments. (d) Enhanced activation of the TGFβ signaling pathway in sorted CD49fhighCD61high cells compared to sorted CD49flowCD61low cells. Western blot analysis of phospho-Smad2 (Ser465/467), total Smad2, phospho-Smad3 (Ser423/425), total Smad3 and Actin was performed on protein lysates derived from sorted CD49fhighCD61high and CD49flowCD61low cells.
The TGFβ signaling has been known to play a critical role in regulating the pluripotency of human embryonic stem cells and cancer stem cells via induction of an Epithelial–Mesenchymal Transition (EMT) (James et al., 2005; Mani et al., 2008). To examine the status of TGFβ signaling in sorted cells, we analyzed the expression of several selected TGFβ downstream responsive genes (Pai, Il6, Igfbp3 and Foxc2). Compared to CD49flowCD61low cells, expression of Pai (Yang et al., 2007), Il6 (Park et al., 2003), Igfbp3 (Kveiborg et al., 2001) and Foxc2 (Mani et al., 2007) were upregulated in CD49f highCD61high cells by 4.8, 3.8, 2.5 and 3.6 folds, respectively (Figure 6c). Moreover, increased phosphorylation and total levels of TGFβ-downstream mediators Smad2/3 were observed in CD49f highCD61high cells compared to CD49flowCD61low cells (Figure 6d). Therefore, both gene expression and protein analysis data indicate that the TGFβ signaling was further activated in the TIC-enriched subpopulation. This suggests that the TGFβ signaling may play a critical role in Her2-mediated tumorigenesis and maintenance of the TIC population.
To investigate whether expression of the EMT genes in CD49f highCD61high cells is upregulated concurrently with the TGFβ-target genes, we examined the expression status of 5 canonical EMT genes including Cdh2, Sma, Snail, Twist1 and Zeb1(Kalluri and Weinberg, 2009). All of these genes were expressed in CD49f highCD61high cells at the highest levels compared to other two subpopulations (Figure 6c). In addition, Foxc2 analyzed as a TGFβ-target gene is also involved in EMT (Mani et al., 2007). These data show that CD49f highCD61high cells express the highest TGFβ signaling and EMT gene signatures compared to non-TIC-enriched subsets.
Treatment with TGFβ pathway inhibitors suppresses EMT gene expression and concurrently leads to a reduction in the TIC population
To examine the functional relevance of the TGFβ signaling in maintenance of the CD49fhighCD61high population, we treated H6O5 cells with two different TGFβ receptor-specific inhibitors, SB431542 and A-83-01. As shown in Figure 7a, these two inhibitors dramatically decreased the CD49f highCD61high subpopulation by over 70%. This effect was not due to inhibition of overall cell growth (Supplementary Figure 2). Nevertheless, the TGFβ signaling pathway was significantly inhibited as shown by drastically reduced levels of phosphorylated Smad2/3 (Supplementary Figure 3). These data suggest that blockade of the TGFβ signaling pathway may preferentially inhibit the self-renewal of TICs.
Figure 7.
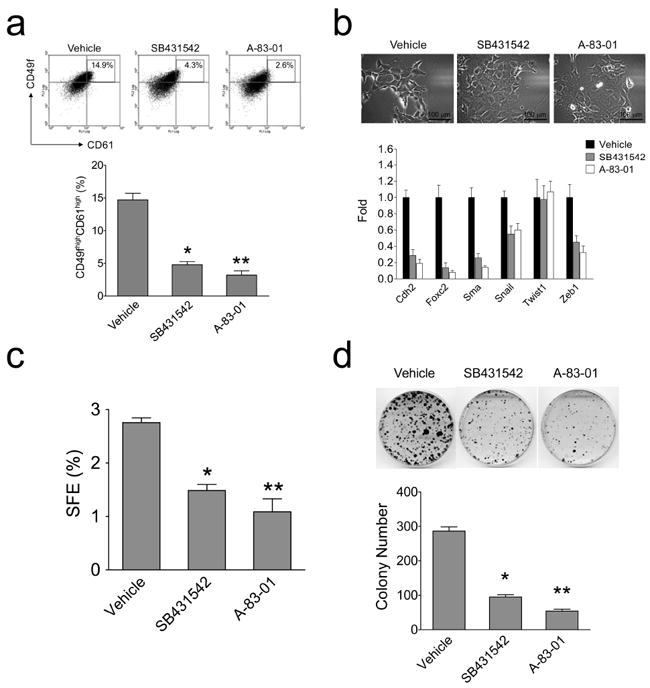
Inhibition of the TGFβ-receptor signaling leads to a decrease in TICs (CD49fhighCD61high) cells, downregulation of EMT-programmed genes and abrogation of clonogenic and tumorsphere formation abilities of H6O5 cells. (a) FACS analysis of CD49f and CD61 in TGFβ inhibitor-treated H6O5 cells. CD49fhighCD61high cells were boxed and their percentage is indicated in the box. Results from triplicate experiments were plotted as a bar graph (the bottom panel) (b) Quantitative expression analysis of EMT-programmed genes in TGFβ inhibitor-treated H6O5 cells. Triplicate experiments were performed on H6O5 cells treated with TGFβ inhibitors as described in (a). Microscopic photographs of vehicle- and drug-treated H6O5 cells are shown in the top panel. (c) Tumorsphere formation analysis of TGFβ inhibitor-treated H6O5 cells. Four-day-treated H6O5 cells were seeded for sphere formation assay. Triplicate experiments were performed. (d) Clonogenic analysis of TGFβ inhibitor-treated H6O5 cells. Stained colonies from vehicle- and drug-treated H6O5 cells are shown in the top panel. The bar graph (the bottom panel) was generated from triplicate experiments. Error bars represent SD. The symbols (*, **) shown in (a), (c) and (d) indicate a statistically significant difference (p < 0.05).
TGFβ activity is known to induce an EMT, which can potentially generate cells with stem-cell properties (Mani et al., 2008). We then addressed whether abrogation of the TGFβ signaling pathway can lead to suppression of EMT marker gene expression. As shown in Figure 7b (the bottom panel), expression levels of 5 out of 6 EMT genes (except Twist1) in drug-treated cells dramatically decreased compared to those in vehicle-treated cells. These changes in the EMT gene expression profiles correlated with reverse EMT-like morphological changes in drug-treated cells (Figure 7b, the top panel). These data suggest that the TGFβ receptor inhibitors may preferentially inhibit the expansion of the TIC population by suppressing expression of genes involved in EMT.
To further validate whether the TIC population is reduced by abrogation of the TGFβ signaling, we examined clonogenic and tumorsphere-forming abilities of drug-treated cells. Consistent with FACS results (Figure 7a), 46.1%- and 60.5%-suppressive extents of tumorsphere formation were observed in SB431542-treated and A-83-01-treated cells, respectively, relative to vehicle-treated cells (Figure 7c). Besides a decrease in tumorsphere number, a significant reduction in sizes of tumorspheres from drug-treated cells was observed (data not shown). Similarly, treatment with SB431542 and A-83-01 resulted in a dramatic reduction in colony formation by 76.8% and 81.9%, respectively (Figure 7d). These findings, taken together, indicate that the TGFβ signaling plays an essential role in maintenance of the Her2-transformed TIC population.
Suppression of the integrin β3 pathway impairs TGFβ signaling and self-renewal of TICs
The molecular mechanisms underlying elevated activation of TGFβ signaling in the TIC-enriched subpopulation are particularly interesting but unknown in our study. It has been shown that integrins are involved in activation of TGFβ signaling (Margadant and Sonnenberg, 2010). Given that the TIC-enriched subpopulation manifests the CD49f highCD61high trait, it raises the possibility that these two integrin molecules may be implicated in activation of TGFβ signaling. Several lines of evidence have shown that αvβ3 integrin molecules are able to activate the TGFβ ligand in vitro and integrin β3 interacts physically with the TGFβ receptor (TGF-βRII) to modulate the TGFβ signaling (Scaffidi et al., 2004; Galliher and Schiemann, 2006, 2007; Wipff et al., 2007). To unravel whether integrin β3 (CD61) is engaged in activating TGFβ signaling in H6O5 cells, we performed small interfering RNA (siRNA) knockdown experiments on H6O5 cells. As shown in Figure 8a, siRNA-mediated knockdown of CD61 gave rise to decreased phosphorylation of FAK at Tyr397 and c-Src at Tyr416 (the downstream mediators of integrin β3 signaling), indicating the downstream signaling of integrin β3 was inhibited by CD61 knockdown. Concurrent with reduced integrin β3 signaling, the TGFβ signaling was attenuated by CD61 knockdown, indicated by decreased phosphorylation of Smad2/3 (Figure 8a). This result demonstrated that CD61 is required for activation of TGFβ signaling. We have shown that the TGFβ signaling is essential for maintenance of Her2-induced TICs (Figure 7). This suggests that CD61 may be crucial for maintaining the TIC population. To test it, CD61 siRNA-transfected H6O5 cells were subjected to sphere formation assays compared to untransfected and control siRNA-transfected cells. A decrease of about 30% in sphere formation efficiency was observed in H6O5 cells with CD61 knockdown when compared to control cells (Figure 8b). These data, taken together, indicate and the cooperative integrin β3-TGFβ signaling axis is mandatory for self-renewal ability of TICs.
Figure 8.
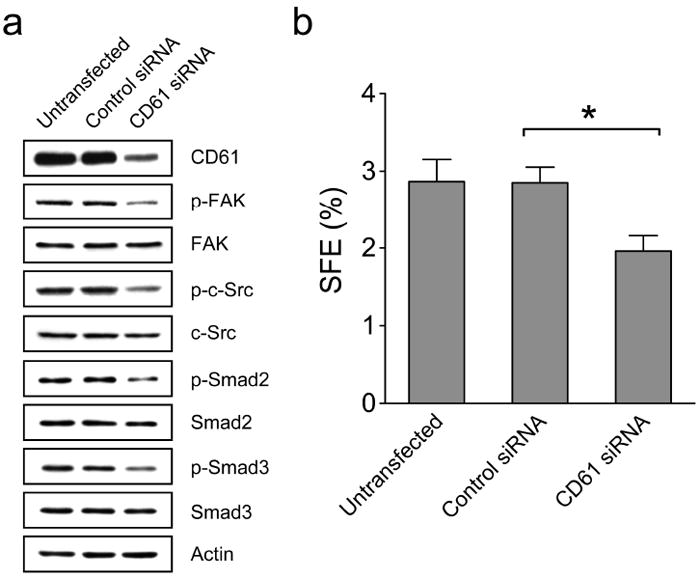
Knockdown of integrin β3 (CD61) leads to a reduction in the TGFβ signaling and suppression of TIC self-renewal. (a) Western blot analysis of integrin β3 and TGFβ signaling pathways in H6O5 cells with CD61 knockdown. H6O5 cells were transfected with control or CD61 siRNA and transfected cells were harvested at 48 h after siRNA transfections for Western blot analysis using antibodies against CD61, phospho-FAK (Tyr397), total FAK, phospho-c-Src (Tyr416), total c-Src, phospho-Smad2 (Ser465/467), total Smad2, phospho-Smad3 (Ser423/425), total Smad3 and Actin. Mouse CD61 siRNA is composed of a pool of 4 different CD61-specific siRNA duplexes (Dharmacon). Untransfected H6O5 cells were also included in the parallel analysis. (b) Tumorsphere formation analysis of CD61-knockdown H6O5 cells. Sphere formation assays were performed on untransfected, control siRNA-transfected and CD61 siRNA-transfected H6O5 cells. The symbol (*) indicates a statistically significant difference (p < 0.05).
Discussion
The growing consensus of the CSC model is attributable to the successful use of surface biomarkers for detecting and enriching CSCs in both human cancers and animal models (Clarke et al., 2006). However, the fact that no universal markers are able to identify TICs from all types of tumors may partially result from heterogeneous origins of cancer initiating cells (Visvader, 2011). Although existence of TICs has been functionally identified in MMTV-Her2/neu tumors (Liu et al., 2007), no specific markers have been found to enrich them. In our study, combined analysis of CD24, CD49f and ESA revealed that MMTV-Her2/neu-induced mammary tumors are potentially derived from the aberrant mammary luminal progenitor cell population, which is based on these following lines of evidence: (1) The CD24highCD49fmed/low Ma-CFC progenitor population was anomalously expanded in preneoplastic MMTV-Her2/neu mammary glands relative to age-matched, normal counterparts (Figure 2a). (2) The detected, expanded cell population also displayed ESAhigh (Figure 2a), a feature similar to human mammary luminal progenitor cells (Lim et al., 2009). (3) Gene expression profiles of MMTV-Her2/neu tumor cells are most concordant with the luminal progenitor gene signature (Lim et al., 2010). Therefore, we for the first time deciphered the potential cell population candidate for the origin of MMTV-Her2/neu mammary tumors. More importantly, we developed a method employing the combination of CD49f and CD61 to identify and enrich TICs in MMTV-Her2/neu mammary tumors as well as in Her2-tumor-derived primary cell cultures.
Our data convincingly demonstrate that MMTV-Her2/neu tumors are heterogeneous and CD49fhighCD61high subset cells are enriched for TICs based on both in vitro clonogenic and in vivo transplantation assays. It has been proposed by Vaillant et al. that MMTV-Her2/neu tumors are composed of a more homogeneous cell population according to FACS analysis (Vaillant et al., 2008). If tumors are composed of homogenous cells, we would expect that there is no correlated cellular distribution between markers such as ESA, CD24, CD49f and CD61. In contrast to this expectation, the CD49fhighCD61high subset also showed highest expression levels of both CD24 and ESA than other subsets, indicating co-expression of these markers in a TIC-enriched subset of tumor cells. This notion is further supported by the fact that the stemness, TGFβ pathway and EMT gene signatures are specifically, highly expressed in the TIC-enriched subset. Taken together, our results suggest that the CSC model may be still applied to the Her2/neu-induced mouse tumor model.
Through enrichment of TICs in the CD49fhighCD61high subpopulation, we found that the TIC-enriched subpopulation expresses the highest levels of the TGFβ-responsive gene signature and exhibits increased TGFβ signaling compared to the other subpopulations of tumor cells. This suggests that cells with different phenotypes, even within the same tumor and tissue type, may differentially respond to TGFβ receptor inhibitors. Indeed, our results demonstrate that treatment with TGFβ receptor inhibitors had no effect on overall cell survival and growth but led to a specific reduction in the TIC population. Analogous to our findings, Shipitsin et al. found that the TGFβ signaling pathway is specifically activated in CD44+ TICs and treatment with the TGFβ receptor inhibitors had no significant effect on the proliferation and survival of tumor cells but resulted in dramatic morphological changes in CD44+ cells, similar to mesenchymal-epithelial transition (MET) (Shipitsin et al., 2007). Taken together, our and other studies further emphasize the importance of the TGFβ signaling for maintaining the pool of TICs in both mouse and human mammary tumors.
By knockdown of CD61, we have demonstrated that the integrin β3 signaling pathway is imperative for sustaining the TGFβ signaling and the cooperative integrin β3-TGFβ signaling axis plays an indispensable role in maintaining Her2-transformed TICs. These findings for the first time provide novel evidence to link the integrin β3-TGFβ signaling mode to TICs and to decipher, at least in part, the mechanisms underlying increased activation of TGFβ signaling in TICs. The αvβ3 integrin-Src signaling axis has been shown to facilitate TGFβ-mediated induction of epithelial-mesenchymal transition (EMT) in mammary epithelial cells and promote breast cancer cell proliferation and invasion (Galliher and Schiemann, 2006, 2007). The oncogenic roles of the αvβ3 integrin-Src signaling axis in TGFβ signaling and EMT may account for our observations that the TIC-enriched CD49fhighCD61high subset exhibited increased TGFβ signaling and the typical EMT gene signature. According to accumulating evidence to show the importance of targeting of TICs in cancer therapy, our novel findings linking the integrin β3-TGFβ signaling axis to Her2-transformed TICs may have immediate therapeutic implications due to the current testing of TGFβ pathway inhibitors and αvβ3 integrin antagonists in clinical trials (Biswas et al., 2006; Desgrosellier and Cheresh, 2010).
Materials and Methods
Cell isolation and culture
Isolation of cancer epithelial cells from mammary tumors of MMTV-Her2/neu-transgenic mice and establishment of the primary Her2-overexpressing tumor cell line H6O5 were described previously (Chen et al., 2010). The procedures for isolating Lin− epithelial cells from mammary glands are described in the Supplementary Materials and Methods.
Flow cytometry analysis and sorting
Fluorescence-activated cell sorting (FACS) analysis was performed using an FC500 CXP flow cytometer (Beckman Coulter, Fullerton, CA, USA). Cells were stained with the following antibodies: FITC and PE-conjugated anti-CD49f (Becton Dickinson, Sparks, MD, USA), Alexa 488-conjugated anti-CD61 (BioLegend), PE and APC-conjugated anti-CD24 (BioLegend, San Diego, CA, USA), PE and APC-Cy7-conjugated anti-ESA (BioLegend). Cell sorting was carried out on a FACSAria II cell sorter (Becton Dickinson).
In vitro clonogenic assays
Sorted or drug-treated H6O5 cells were plated in 6-well plates at a density of 1000 cells/well or in 6-cm culture dishes at a density of 5000 cells/dish in complete medium. After 2 weeks, colonies were fixed and then stained with 0.1% crystal violet. Colonies with sizes ≥ 1 mm were counted.
In vitro tumorsphere formation assays
Sorted or drug-treated viable H6O5 cells were plated in ultra-low attachment 6-well plates (Corning, Acton, MA, USA) at a density of 10,000 cells/ml in serum-free DMEM/F12 medium (Invitrogen) supplemented with 20 ng/ml epidermal growth factor (EGF, Sigma, St. Louis, MO, USA), 10 ng/ml basic fibroblast growth factor (bFGF, Sigma), 5μg/ml insulin (Sigma), 1×B27 supplement (Invitrogen) and 0.4% bovine serum albumin (BSA, Sigma). Cells were cultured under 5% CO2 at 37°C for a week (Gu et al., 2011).
In vivo tumorigenesis assays
Sorted cells were resuspended in 20 μl DMEM/F12 medium and mixed with 20 μl Matrigel (Becton Dickinson) at a 1:1 ratio and held on ice. The entire 40μl sample was injected into either no. 3 or 4 mammary glands of MMTV-Her2/neu-transgenic mice anesthetized with isoflurane according to the animal protocol approved by the USC committee for research in vertebrate animals. Tumor sizes were measured weekly. Incidence of xenograft tumor formation was scored 12-13 weeks after injection.
Supplementary Material
Acknowledgments
The authors thank Dr. Marai M. Pena, Celestia Davis, Sara Johnson and Andrea Daamen for experimental assistance. This work was supported by the Elsa U. Pardee Cancer Foundation grant (B94AFFAA), the American Cancer Society Research Award (RSG-10-067-01-TBE) to HC and NIH grant (3P20RR017698-08) to HC and QW.
Footnotes
Please see Supplementary Materials and Methods for the description of cell isolation, quantitative real-time RT-PCR, Western blot, cell proliferation, siRNA transfection and statistical analyses.
Conflicts of Interest The authors declare no conflict of interest.
References
- Asselin-Labat ML, Sutherland KD, Barker H, Thomas R, Shackleton M, Forrest NC, et al. Gata-3 is an essential regulator of mammary-gland morphogenesis and luminal-cell differentiation. Nat Cell Biol. 2007;9:201–209. doi: 10.1038/ncb1530. [DOI] [PubMed] [Google Scholar]
- Biswas S, Criswell TL, Wang SE, Arteaga CL. Inhibition of transforming growth factor-beta signaling in human cancer: targeting a tumor suppressor network as a therapeutic strategy. Clin Cancer Res. 2006;12:4142–4146. doi: 10.1158/1078-0432.CCR-06-0952. [DOI] [PubMed] [Google Scholar]
- Chen H, Pimienta G, Gu Y, Sun X, Hu J, Kim MS, et al. Proteomic characterization of Her2/neu-overexpressing breast cancer cells. Proteomics. 2010;10:3800–3810. doi: 10.1002/pmic.201000297. [DOI] [PMC free article] [PubMed] [Google Scholar]
- Cicalese A, Bonizzi G, Pasi CE, Faretta M, Ronzoni S, Giulini B, et al. The tumor suppressor p53 regulates polarity of self-renewing divisions in mammary stem cells. Cell. 2009;138:1083–1095. doi: 10.1016/j.cell.2009.06.048. [DOI] [PubMed] [Google Scholar]
- Clarke MF, Dick JE, Dirks PB, Eaves CJ, Jamieson CH, Jones DL, et al. Cancer stem cells--perspectives on current status and future directions: AACR Workshop on cancer stem cells. Cancer Res. 2006;66:9339–9344. doi: 10.1158/0008-5472.CAN-06-3126. [DOI] [PubMed] [Google Scholar]
- Desgrosellier JS, Cheresh DA. Integrins in cancer: biological implications and therapeutic opportunities. Nat Rev Cancer. 2010;10:9–22. doi: 10.1038/nrc2748. [DOI] [PMC free article] [PubMed] [Google Scholar]
- Galliher AJ, Schiemann WP. Beta3 integrin and Src facilitate transforming growth factor-beta mediated induction of epithelial-mesenchymal transition in mammary epithelial cells. Breast Cancer Res. 2006;8:R42. doi: 10.1186/bcr1524. [DOI] [PMC free article] [PubMed] [Google Scholar]
- Galliher AJ, Schiemann WP. Src phosphorylates Tyr284 in TGF-beta type II receptor and regulates TGF-beta stimulation of p38 MAPK during breast cancer cell proliferation and invasion. Cancer Res. 2007;67:3752–3758. doi: 10.1158/0008-5472.CAN-06-3851. [DOI] [PubMed] [Google Scholar]
- Ginestier C, Hur MH, Charafe-Jauffret E, Monville F, Dutcher J, Brown M, et al. ALDH1 is a marker of normal and malignant human mammary stem cells and a predictor of poor clinical outcome. Cell Stem Cell. 2007;1:555–567. doi: 10.1016/j.stem.2007.08.014. [DOI] [PMC free article] [PubMed] [Google Scholar]
- Gu Y, Fu J, Lo P, Wang S, Wang Q, Chen H. The effect of B27 supplement on promoting in vitro propagation of Her2/neu-transformed mammary tumorspheres. J Biotech Res. 2011;3:7–18. [Google Scholar]
- Guy CT, Webster MA, Schaller M, Parsons TJ, Cardiff RD, Muller WJ. Expression of the neu protooncogene in the mammary epithelium of transgenic mice induces metastatic disease. Proc Natl Acad Sci U S A. 1992;89:10578–10582. doi: 10.1073/pnas.89.22.10578. [DOI] [PMC free article] [PubMed] [Google Scholar]
- Hanker L, Karn T, Ruckhaeberle E, Gaetje R, Solbach C, Schmidt M, et al. Clinical relevance of the putative stem cell marker p63 in breast cancer. Breast Cancer Res Treat. 2010;122:765–775. doi: 10.1007/s10549-009-0608-6. [DOI] [PubMed] [Google Scholar]
- Hynes NE, Jaggi R, Kozma SC, Ball R, Muellener D, Wetherall NT, et al. New acceptor cell for transfected genomic DNA: oncogene transfer into a mouse mammary epithelial cell line. Mol Cell Biol. 1985;5:268–272. doi: 10.1128/mcb.5.1.268. [DOI] [PMC free article] [PubMed] [Google Scholar]
- Ishikawa T, Nakagawa H. Human ABC transporter ABCG2 in cancer chemotherapy and pharmacogenomics. J Exp Ther Oncol. 2009;8:5–24. [PubMed] [Google Scholar]
- James D, Levine AJ, Besser D, Hemmati-Brivanlou A. TGFbeta/activin/nodal signaling is necessary for the maintenance of pluripotency in human embryonic stem cells. Development. 2005;132:1273–1282. doi: 10.1242/dev.01706. [DOI] [PubMed] [Google Scholar]
- Kalluri R, Weinberg RA. The basics of epithelial-mesenchymal transition. J Clin Invest. 2009;119:1420–1428. doi: 10.1172/JCI39104. [DOI] [PMC free article] [PubMed] [Google Scholar]
- Korkaya H, Paulson A, Iovino F, Wicha MS. HER2 regulates the mammary stem/progenitor cell population driving tumorigenesis and invasion. Oncogene. 2008;27:6120–6130. doi: 10.1038/onc.2008.207. [DOI] [PMC free article] [PubMed] [Google Scholar]
- Kveiborg M, Flyvbjerg A, Eriksen EF, Kassem M. Transforming growth factor-beta1 stimulates the production of insulin-like growth factor-I and insulin-like growth factor-binding protein-3 in human bone marrow stromal osteoblast progenitors. J Endocrinol. 2001;169:549–561. doi: 10.1677/joe.0.1690549. [DOI] [PubMed] [Google Scholar]
- Li X, Lewis MT, Huang J, Gutierrez C, Osborne CK, Wu MF, et al. Intrinsic resistance of tumorigenic breast cancer cells to chemotherapy. J Natl Cancer Inst. 2008;100:672–679. doi: 10.1093/jnci/djn123. [DOI] [PubMed] [Google Scholar]
- Lim E, Vaillant F, Wu D, Forrest NC, Pal B, Hart AH, et al. Aberrant luminal progenitors as the candidate target population for basal tumor development in BRCA1 mutation carriers. Nat Med. 2009;15:907–913. doi: 10.1038/nm.2000. [DOI] [PubMed] [Google Scholar]
- Lim E, Wu D, Pal B, Bouras T, Asselin-Labat ML, Vaillant F, et al. Transcriptome analyses of mouse and human mammary cell subpopulations reveal multiple conserved genes and pathways. Breast Cancer Res. 2010;12:R21. doi: 10.1186/bcr2560. [DOI] [PMC free article] [PubMed] [Google Scholar]
- Liu JC, Deng T, Lehal RS, Kim J, Zacksenhaus E. Identification of tumorsphere-and tumor-initiating cells in HER2/Neu-induced mammary tumors. Cancer Res. 2007;67:8671–8681. doi: 10.1158/0008-5472.CAN-07-1486. [DOI] [PubMed] [Google Scholar]
- Liu S, Dontu G, Mantle ID, Patel S, Ahn NS, Jackson KW, et al. Hedgehog signaling and Bmi-1 regulate self-renewal of normal and malignant human mammary stem cells. Cancer Res. 2006;66:6063–6071. doi: 10.1158/0008-5472.CAN-06-0054. [DOI] [PMC free article] [PubMed] [Google Scholar]
- Magnifico A, Albano L, Campaner S, Delia D, Castiglioni F, Gasparini P, et al. Tumor-initiating cells of HER2-positive carcinoma cell lines express the highest oncoprotein levels and are sensitive to trastuzumab. Clin Cancer Res. 2009;15:2010–2021. doi: 10.1158/1078-0432.CCR-08-1327. [DOI] [PubMed] [Google Scholar]
- Mani SA, Guo W, Liao MJ, Eaton EN, Ayyanan A, Zhou AY, et al. The epithelial-mesenchymal transition generates cells with properties of stem cells. Cell. 2008;133:704–715. doi: 10.1016/j.cell.2008.03.027. [DOI] [PMC free article] [PubMed] [Google Scholar]
- Mani SA, Yang J, Brooks M, Schwaninger G, Zhou A, Miura N, et al. Mesenchyme Forkhead 1 (FOXC2) plays a key role in metastasis and is associated with aggressive basal-like breast cancers. Proc Natl Acad Sci U S A. 2007;104:10069–10074. doi: 10.1073/pnas.0703900104. [DOI] [PMC free article] [PubMed] [Google Scholar]
- Margadant C, Sonnenberg A. Integrin-TGF-beta crosstalk in fibrosis, cancer and wound healing. EMBO Rep. 2010;11:97–105. doi: 10.1038/embor.2009.276. [DOI] [PMC free article] [PubMed] [Google Scholar]
- Park JI, Lee MG, Cho K, Park BJ, Chae KS, Byun DS, et al. Transforming growth factor-beta1 activates interleukin-6 expression in prostate cancer cells through the synergistic collaboration of the Smad2, p38-NF-kappaB, JNK, and Ras signaling pathways. Oncogene. 2003;22:4314–4332. doi: 10.1038/sj.onc.1206478. [DOI] [PubMed] [Google Scholar]
- Scaffidi AK, Petrovic N, Moodley YP, Fogel-Petrovic M, Kroeger KM, Seeber RM, et al. alpha(v)beta(3) Integrin interacts with the transforming growth factor beta (TGFbeta) type II receptor to potentiate the proliferative effects of TGFbeta1 in living human lung fibroblasts. J Biol Chem. 2004;279:37726–37733. doi: 10.1074/jbc.M403010200. [DOI] [PubMed] [Google Scholar]
- Shackleton M, Vaillant F, Simpson KJ, Stingl J, Smyth GK, Asselin-Labat ML, et al. Generation of a functional mammary gland from a single stem cell. Nature. 2006;439:84–88. doi: 10.1038/nature04372. [DOI] [PubMed] [Google Scholar]
- Shipitsin M, Campbell LL, Argani P, Weremowicz S, Bloushtain-Qimron N, Yao J, et al. Molecular definition of breast tumor heterogeneity. Cancer Cell. 2007;11:259–273. doi: 10.1016/j.ccr.2007.01.013. [DOI] [PubMed] [Google Scholar]
- Stingl J, Eirew P, Ricketson I, Shackleton M, Vaillant F, Choi D, et al. Purification and unique properties of mammary epithelial stem cells. Nature. 2006;439:993–997. doi: 10.1038/nature04496. [DOI] [PubMed] [Google Scholar]
- Vaillant F, Asselin-Labat ML, Shackleton M, Forrest NC, Lindeman GJ, Visvader J. The mammary progenitor marker CD61/beta3 integrin identifies cancer stem cells in mouse models of mammary tumorigenesis. Cancer Res. 2008;68:7711–7717. doi: 10.1158/0008-5472.CAN-08-1949. [DOI] [PubMed] [Google Scholar]
- Visvader JE. Cells of origin in cancer. Nature. 2011;469:314–322. doi: 10.1038/nature09781. [DOI] [PubMed] [Google Scholar]
- Welm B, Behbod F, Goodell MA, Rosen JM. Isolation and characterization of functional mammary gland stem cells. Cell Prolif. 2003;36(Suppl 1):17–32. doi: 10.1046/j.1365-2184.36.s.1.3.x. [DOI] [PMC free article] [PubMed] [Google Scholar]
- Wipff PJ, Rifkin DB, Meister JJ, Hinz B. Myofibroblast contraction activates latent TGF-beta1 from the extracellular matrix. J Cell Biol. 2007;179:1311–1323. doi: 10.1083/jcb.200704042. [DOI] [PMC free article] [PubMed] [Google Scholar]
- Wright MH, Calcagno AM, Salcido CD, Carlson MD, Ambudkar SV, Varticovski L. Brca1 breast tumors contain distinct CD44+/CD24- and CD133+ cells with cancer stem cell characteristics. Breast Cancer Res. 2008;10:R10. doi: 10.1186/bcr1855. [DOI] [PMC free article] [PubMed] [Google Scholar]
- Yang C, Patel K, Harding P, Sorokin A, Glass WF., 2nd Regulation of TGF-beta1/MAPK-mediated PAI-1 gene expression by the actin cytoskeleton in human mesangial cells. Exp Cell Res. 2007;313:1240–1250. doi: 10.1016/j.yexcr.2007.01.011. [DOI] [PMC free article] [PubMed] [Google Scholar]
Associated Data
This section collects any data citations, data availability statements, or supplementary materials included in this article.