

Abstract
Background
There is substantial variation in the cost and intensity of care delivered by US hospitals. We assessed how the structure of patient-sharing networks of physicians affiliated with hospitals might contribute to this variation.
Methods
We constructed hospital-based professional networks based on patient-sharing ties among 61,461 physicians affiliated with 528 hospitals in 51 hospital referral regions in the US using Medicare data on clinical encounters during 2006. We estimated linear regression models to assess the relationship between measures of hospital network structure and hospital measures of spending and care intensity in the last 2 years of life.
Results
The typical physician in an average-sized urban hospital was connected to 187 other doctors for every 100 Medicare patients shared with other doctors. For the average-sized urban hospital an increase of one standard deviation (SD) in the median number of connections per physician was associated with a 17.8% increase in total spending, in addition to 17.4% more hospital days, and 23.8% more physician visits (all p<0.001). In addition, higher “centrality” of primary care providers within these hospital networks was associated with 14.7% fewer medical specialist visits (p<0.001) as well as lower spending on imaging and tests (−9.2% and −12.9% for 1 SD increase in centrality, p<0.001).
Conclusions
Hospital-based physician network structure has a significant relationship with an institution’s care patterns for their patients. Hospitals with doctors who have higher numbers of connections have higher costs and more intensive care, and hospitals with primary care-centered networks have lower costs and care intensity.
Introduction
American regions and hospitals within those regions differ markedly in health care spending and resource use.1,2 Even after risk adjustment and price standardization, a significant amount of variation in spending and resource use remains unexplained.3,4 These findings are concerning in light of the growth in US health care costs, since hospitals with higher spending and resource use do not appear to have better outcomes and have similar performance on health care quality indicators compared to lower spending hospitals.5–7 Prior research has shown that regional levels of health care spending and utilization are associated with physicians’ tendency towards aggressive care.8–10 It is possible that these regional and institutional patterns of high or low-cost care may be reflected in the networks of physician interactions since collectively, physician interactions contribute to the culture and knowledge of a region or institution. For instance, physicians rely on each other as trusted sources of medical advice and information, often to the exclusion of published research.11,12 Therefore, one unexplored area that might contribute to hospital-level variations in care is the structure of the networks of hospital-affiliated physicians as defined by physician-to-physician interactions.13 As recently shown, physician interactions may be measured by examining whether or not physicians treat patients in common.14
We examined how networks based on physician relationships might be associated with care delivery for patients using network analysis.15,16 Network analysis has had prior successful applications in understanding the behavior of organizations such as academic departments, company boards of directors, and artistic collaborations.17–19 Some prior research has used these methods to examine physician advice networks and the diffusion of information among physicians; however, these studies included relatively small samples of physicians or focused on a single technology or drug.20–23
We used data from the Medicare program regarding 2.6 million patients cared for by 61,146 physicians associated with 528 hospitals to study professional networks of physicians defined by patient sharing. We focused our study on networks defined by physicians affiliated with individual hospitals because of the importance of hospitals to the US health care system and the depth of data available for describing hospital performance. We hypothesized that network measures reflecting poorer coordination of care within physicians’ professional networks would be associated with higher costs and care intensity within hospitals.
To evaluate this hypothesis, we map the networks of all physicians affiliated with these nationally representative hospitals and characterize these networks with well-accepted measures from the discipline of network science that reflect aspects of care coordination. For instance, the number of physicians who share care for a patient (a measure related to physician degree within the network, described below), has been shown to be associated with increased costs and utilization in prior studies.24–26
We extend this prior work by adopting concepts developed within network science. Such measures can reveal patterns of medical care that would otherwise be difficult to measure, adding a new set of tools for insight into health care delivery.
Methods
Data Sources
We used encounter data from the 2006 Medicare Carrier File for 100% of patients enrolled in Medicare Part A (hospital care) and Part B (physician services, outpatient care, and durable medical equipment) in 50 randomly sampled hospital referral regions (HRRs) and the Boston HRR to define physician relationships. We excluded patients enrolled in capitated Medicare Advantage plans since we did not have claims for these patients, and since the measures of cost and intensity used (described below) were calculated for fee-for-service enrollees. We obtained descriptive information for hospitals and physicians from the 2006 American Hospital Association annual survey and American Medical Association (AMA) Masterfile. We defined physicians as primary care physicians (PCPs), medical or surgical specialists, or “other” (e.g. psychiatry).
We obtained measures of cost and care intensity for hospitals from the Dartmouth Atlas of Health Care, which were derived using data from 2001 to 2005.27 For each hospital, we examined 3 measures of health care spending (total inpatient plus outpatient, imaging, and laboratory tests) and 6 measures of utilization, including hospital days (total, intensive care unit (ICU), and general medical/surgical combined), and number of physician visits (including visits to PCPs and medical specialists). These measures were defined based on a population of patients hospitalized at least once for one of nine life-threatening chronic illnesses (e.g., congestive heart failure) who were in the last two years of life.28 All Dartmouth measures were adjusted for patient age, sex, race, type of chronic illness, and presence of multiple chronic illnesses.29 Thus, the measures represent the case-mix-adjusted cost and intensity of care for a population of older patients with roughly comparable levels of illness.
Assigning Physicians to a Primary Hospital
We assigned each physician with an office located in a sampled HRR (assessed using the AMA Masterfile) to a principal hospital based on where they filed the plurality of inpatient claims, or if they did not do any inpatient work, to the hospital where the plurality of patients they saw received inpatient care.30
Our sample initially included 65,757 eligible physicians in office-based patient care specialties (excluding pathologists, emergency medicine, radiologists, and anesthesiologists) affiliated with 867 general medical surgical hospitals within the selected regions. After excluding low-volume hospitals for which the outcomes measured could not be ascertained (≤400 deaths annually) and physicians with no ties within their assigned hospital (mostly applicable to physicians located at the border of an HRR who primarily used a hospital outside of our sample), our final sample included 61,461 physicians affiliated with 528 hospitals.
Ascertaining and Measuring Hospital-Affiliated Networks
To define a network of relationships between the physicians in our dataset, we identified a relationship (tie) between two doctors if they each had a significant encounter with one or more common patients. These encounters included face-to-face visits or meaningful procedures with a value of at least 2 relative value units (RVUs). This was done to capture encounters where an office visit might not be billed such as those related to bundled surgical procedures. After identifying significant encounters between physicians and patients, as depicted in Figure 1A, we then created a tie between any two doctors who cared for one or more patients in common (outlined schematically in Figure 1B). The use of shared patients to identify network ties has been validated in a recent study.14
Figure 1. Schematic of Network Identification and Measurement Methods.

Figure 1A illustrates the observed connections between a hypothetical group of physicians and patients (denoted by solid lines connecting patients to physicians), the first step in creating a physician network. In Figure 1B, the group of patient-physician ties depicted in Figure 1A are transformed into a physician-physician network, where physicians are linked by a tie with strength equal to the number of patients they share. For instance, in Figs. 1A and 1B, physicians A and C share 1 patient, and physicians C and D share 2 patients. Also depicted in Fig. 1B is that physicians are assigned to hospitals, and their networks can extend within and outside their affiliated hospitals.
Figure 1C shows a simple network to illustrate the network measures used in this study. Each circle represents a physician and is colored by its specialty. The size of each circle is proportional to its betweenness centrality within hospital X (which by definition is 0 for physicians in hospitals Y and Z). The betweenness centrality measures the centrality of a physician in her network by quantifying how often the physician functions as an intermediary in the shortest paths connecting each physician to every other physician (see Appendix for details).
Degree: The adjusted degree measures how many colleagues physicians share patients with, adjusted for the number of patients they treat. In Fig. 1C, Doctor A has a degree of 4 because she is connected to 4 other physicians. Doctor B has a degree of 6. If Doctor A treated 10 Medicare patients in 2006, her adjusted degree would be 40 colleagues per 100 shared patients. Similarly, if Doctor B also treated 10 Medicare patients in 2006, her adjusted degree would be 60 colleagues per 100 shared patients.
Relative Centrality: Relative centrality measures on average, how central one group of physicians are compared to another group within a hospital network by taking the ratio of the average betweenness centrality of, for example, PCPs, versus other physicians in a hospital. In Hospital X, the PCP relative centrality is approximately 2.0, meaning that the PCPs in this network are on average about twice as central as other physicians. This is visually apparent when looking at the betweenness centrality of physicians, represented by the size of physicians’ circles in Fig 1C, where PCPs appear to have a larger overall share of the centrality than other physicians. The concept of relative centrality is illustrated with larger, real hospital networks in Fig. 2
We focused on two structural measures commonly used in network analyses that we hypothesized would reflect care coordination within the network. These measures are briefly summarized below, and are schematically explained in Figure 1C with additional details presented in the Appendix.
Degree is defined as the number of ties an individual physician has in the network, or equivalently, the number of other doctors a physician is connected with through the sharing of patients. The doctors contributing to a physicians’ degree can be any doctors a physician’s patients have seen in the physician’s HRR. To account for a physician’s Medicare patient volume, we adjusted degree by dividing each physician’s degree by the total number of Medicare patients the physician shared in 2006 with other doctors (controlling for a physician having higher degree simply because he sees more patients). A physician with a high adjusted degree shares his patients with a broader array of other doctors than a physician with a low adjusted degree. This measure is independent of the number of doctors seen per patient, since, for example, a physician’s fixed panel of patients could all see the same 20 specialists or could see 200 specialists. Because our analysis was at the hospital level, we then summarized this measure across the physicians in a hospital network by using the median adjusted degree of all physicians at a hospital. We hypothesized that hospitals whose physician networks had a higher median degree would have higher costs and care intensity due to the greater challenges of care coordination as a physician shares patients with more colleagues.24–26,31 A physician sharing patient care with a broad set of colleagues may have more difficulty consolidating his patients’ clinical information and guiding their care than a physician sharing patients with fewer colleagues.
Betweenness centrality is a measure that describes the tendency of a physician to be located in the middle of the network surrounding him.32 The betweenness centrality of a physician is calculated in the following way: consider connecting each physician to every other physician in the network going through as few intermediate relationships as possible; the betweenness centrality of a physician is proportional to the number of times he lies on any of these paths as an intermediary (see the Appendix for equation and details). Visually, doctors with high betweenness centrality lie in the middle, rather than on the periphery, of a network map visualized with standard algorithms.33 Physicians with higher betweenness centrality are well positioned in their network to have greater access to, and influence on, the flow of information among doctors in their network. In Figure 1C, the size of each circle (representing a physician) is proportional to that physician’s betweenness centrality. The calculation of betweenness centrality is confined to doctors within a hospital.
We were interested in how central PCPs were in a hospital network relative to all other doctors in the network. To calculate this measure, we used the ratio of the average centrality of PCPs over the average centrality of all other doctors in a hospital (see Appendix). The resulting relative centrality value can be interpreted as how much more or less central PCPs are when compared to the other doctors in a hospital network. Given the importance of primary care systems for health care costs,34 we hypothesized that hospitals whose networks of patient sharing were more centered around PCPs would have lower costs and care intensity. Hospitals with networks focused around PCPs may have improved capacity for care coordination because specialists are more likely to share patients with a core set of PCPs in those systems (Figure 2).
Figure 2. Example Hospital Networks: Illustrating Relative Centrality.

Three example hospital networks from the dataset in this study are depicted in Figures 2A–C. Each point represents a physician, colored by the specialty of that physician (red = primary care, orange = medical specialist, green = surgical specialist [including general surgeons], blue = other specialist). Each tie between two physicians represents the sharing of 5 or more patients. This figure depicts both the complex organization of physicians in different hospitals, but also visually demonstrates how the concept of relative centrality reflects changes in physician networks. In Figure 2A, the PCP relative centrality (explained in Fig. 1C) is 0.35, so PCPs are about a third as central as other physicians in this network. This is reflected by the tight group of medical and surgical specialists at the center of this physician network, with the many PCPs in the network pushed to the periphery of this network. In Fig. 2B and 2C, PCPs move more toward the center of patient-sharing exchanges as the PCP relative centrality grows.
Hospital Control Variables
Hospital-level control variables included the number of hospital beds, number of physicians assigned to a hospital, location (urban or suburban/rural/isolated),35 teaching hospital status (major [member of the Council of Teaching Hospitals], minor [any non-major teaching hospital with medical school affiliation or residency program], none), ownership (not-for-profit, for-profit, government),36 nurse full time equivalents per 1000 inpatient days, and the percentage of admissions from Medicare and Medicaid patients. In addition, we controlled for the proportion of physicians assigned to a hospital who were PCPs and the mean shared patient volume per physician at a hospital, defined for each physician as the number of patients shared in 2006 with other doctors.
Statistical Analysis
We compared our sample of hospitals with hospitals nationally using χ2 or t-tests and assessed differences in network measures across hospitals using one-way analysis of variance. We used multivariable weighted linear regression to model the effect of each network structure measure on cost or care intensity outcomes, adjusting for the hospital characteristics detailed above. To account for skewness, we log-transformed each outcome variable, and to account for the precision with which each outcome was measured, we weighted observations by the number of annual deaths used by the Dartmouth Atlas group to measure the cost and utilization data.27 We also used robust heteroscedastic-consistent standard error estimation in model fitting 37,38 to account for the possibility that the variance of an observations varies with the mean value of the predictors.
Because some small hospitals had excessively large or small centrality ratios, we set outliers to equal the 1st and 99th percentile values, respectively (see Appendix).39 To enable regression coefficients to be directly compared, we centered each continuous network predictor and hospital covariate to have mean 0 and standard deviation 1 over the entire sample. Regression coefficients are reported as percent change expected in the outcome of interest for an average-sized urban hospital (the median hospital) associated with an increase of one standard deviation in the network measure predictor in order to aid comparison across the models presented. Because network measures differed for urban and non-urban hospitals, we performed a secondary analysis of covariance for each model described above that included an interaction between the network variable of interest and urban/rural location.
Five hospitals had missing data for the general medical/surgical and ICU hospital days outcomes; in addition, 7 and 25 hospitals were missing data for PCP and medical specialist relative centrality respectively due to undefined values (see Appendix). Because these missing values were the outcomes and key predictors of interest, the hospitals with missing data were excluded from the relevant models (reflected in the sample sizes shown in Figure 3). We performed extensive sensitivity analyses to test the decisions made in the modeling process and found that our results were robust under a variety of conditions, including when accounting for Medicare Advantage penetration (data not shown, see Appendix). Complete results for all covariates included in the models are in Appendix Table 2.
Figure 3. Adjusted Estimates of Hospital Network Structure vs. Cost and Utilization Outcomes.
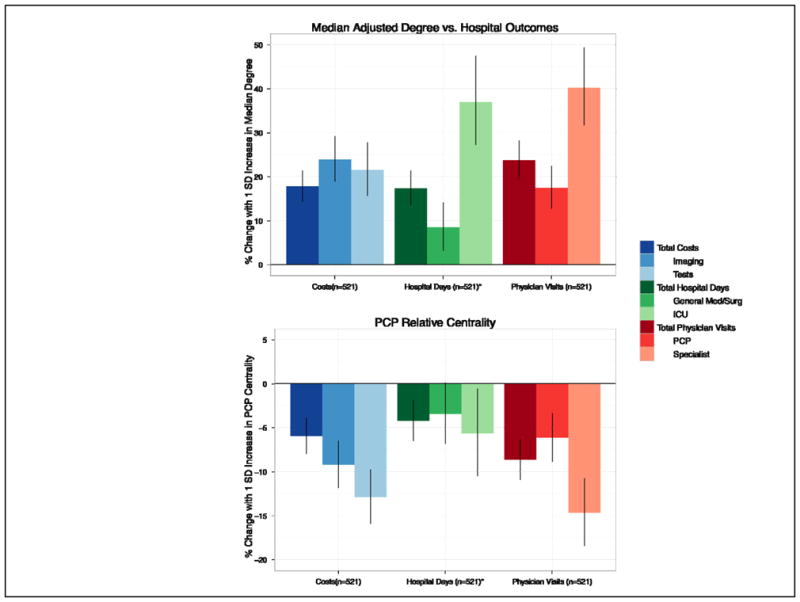
Each section represents the estimated effect of increasing a network measure (Fig 1A, median adjusted degree, Fig 1B, PCP relative centrality) by one standard deviation (SD) for the average-sized urban, non-profit, non-teaching hospital in our sample on three different cost, hospital day, and physician visit outcomes. All estimates are adjusted for several hospital characteristics described in the Methods, including hospital size, urban/rural location and case mix. Error bars show 95% confidence intervals for each estimate. *5 hospitals had missing data for the general medical/surgical and ICU hospital days outcomes, but did have data for the total hospital days outcome
All analyses were performed in R version 2.10,40 using the igraph package (version 0.5.3) for calculating network structure measures and the Zelig package (version 3.4–8) for multivariable regression models.41,42 We visualized hospital networks using the Fruchterman-Reingold algorithm as implemented in igraph.33,43 This study was approved by the institutional review board at Harvard Medical School.
Results
We studied 528 hospitals and the 61,461 physicians caring for 2.6 million Medicare patients who comprised their associated physician networks. Compared with all general medical/surgical hospitals in the US, our sample contained larger hospitals that were more likely to be in urban settings (p<0.001 for both) (Table 1).
Table 1.
Sample Characteristics
| All US General Hospitals (n = 4597) | Study Sample (n = 528) | |||
|---|---|---|---|---|
| Mean | SD | Mean | SD | |
| Beds | 166 | (181) | 248 | (240) |
| Nursing FTE/1000 Inpatient Days | 8.6 | (18.7) | 6.5 | (2.5) |
| % Medicare Admissions | 49% | (19) | 45% | (10) |
| % Medicaid Admissions | 17% | (20) | 19% | (9) |
| n | % | n | % | |
| Urban/Rural (RUCA) | ||||
| Urban | 2282 | 50% | 332 | 63% |
| Suburban/Rural | 1741 | 38% | 179 | 34% |
| Isolated | 570 | 12% | 17 | 3% |
| Teaching Status | ||||
| None | 3517 | 77% | 345 | 65% |
| Minor | 849 | 19% | 128 | 24% |
| Major | 231 | 5% | 55 | 10% |
| Governance | ||||
| Not For Profit | 2760 | 60% | 348 | 66% |
| Public | 1145 | 25% | 90 | 17% |
| For Profit | 692 | 15% | 90 | 17% |
| US Region | ||||
| Northeast | 605 | 13% | 127 | 24% |
| South | 1742 | 38% | 207 | 39% |
| Midwest | 1366 | 30% | 101 | 19% |
| West | 884 | 19% | 93 | 18% |
t-tests and χ2 tests were performed, as appropriate, to evaluate differences between the population of hospitals in the US and the sample hospitals. All comparisons were significant at the p < 0.001 level.
Hospital Characteristics and Network Structure
The average median adjusted degree of a mid-sized hospital in our sample was 187 (SD=86) and ranged from 155 (SD=57) for smaller hospitals to 281 (SD=124) for larger hospitals (p<0.001) (Table 2). Therefore, the typical physician in a mid-sized hospital shared patients with 187 other doctors for every 100 patients shared with other doctors. PCP relative centrality decreased with hospital size, from a mean of 1.11 (SD=0.87) in smaller hospitals to 0.80 (SD=0.54) in larger hospitals (p<0.001).
Table 2.
Average Network Measures by Selected Hospital Characteristics
| n | % | Median Degree per 100 Shared Patients | PCP Relative Centrality* | |||||
|---|---|---|---|---|---|---|---|---|
| Mean | (SD) | p-value | Mean | (SD) | p-value | |||
| All | 528 | 100% | 208 | (107) | N/A | 0.90 | (0.68) | N/A |
| Number of Beds | ||||||||
| Smaller (<123) | 176 | 33% | 155 | (57) | <0.001 | 1.11 | (0.87) | <0.001 |
| Mid-size (123–265) | 176 | 33% | 187 | (86) | 0.79 | (0.54) | ||
| Large (>265) | 176 | 33% | 281 | (124) | 0.80 | (0.54) | ||
| Urban/Rural Location | ||||||||
| Urban | 332 | 63% | 253 | (110) | <0.001 | 0.78 | (0.49) | <0.001 |
| Suburban/Rural/Isolated | 196 | 37% | 131 | (36) | 1.11 | (0.88) | ||
| % Medicare Admissions | ||||||||
| Low (<42%) | 175 | 33% | 270 | (126) | <0.001 | 0.90 | (0.72) | 0.21 |
| Medium (42%–50%) | 183 | 35% | 190 | (88) | 0.83 | (0.57) | ||
| High (>50%) | 170 | 32% | 163 | (68) | 0.97 | (0.73) | ||
| % Medicaid Admissions | ||||||||
| Low (<15%) | 188 | 36% | 197 | (90) | 0.008 | 0.84 | (0.62) | 0.24 |
| Medium (15%–20%) | 156 | 30% | 197 | (103) | 0.89 | (0.63) | ||
| High (>20%) | 184 | 35% | 228 | (123) | 0.97 | (0.77) | ||
| Teaching Status | ||||||||
| None | 345 | 65% | 170 | (77) | <0.001 | 0.95 | (0.75) | 0.002 |
| Minor | 128 | 24% | 236 | (98) | 0.73 | (0.48) | ||
| Major | 55 | 10% | 378 | (106) | 0.97 | (0.56) | ||
| Profit Governance | ||||||||
| Not For Profit | 348 | 66% | 213 | (109) | 0.10 | 0.86 | (0.64) | 0.30 |
| Public | 90 | 17% | 186 | (108) | 0.98 | (0.74) | ||
| For Profit | 90 | 17% | 209 | (95) | 0.96 | (0.76) | ||
| US Region | ||||||||
| Northeast | 127 | 24% | 242 | (116) | <0.001 | 0.79 | (0.55) | 0.004 |
| South | 207 | 39% | 182 | (88) | 1.02 | (0.78) | ||
| Midwest | 101 | 19% | 219 | (119) | 0.93 | (0.78) | ||
| West | 93 | 18% | 206 | (106) | 0.77 | (0.41) | ||
p-values calculated using one-way analysis of variance.
For PCP relative centrality, outlier values were set equal to 1st and 99th percentile values. In addition, PCP centrality cannot be lower than 0, so the large SD also reflects the degree of positive skew in the data.
To illustrate the concept of relative centrality, the network graphs of three similarly sized hospitals are depicted in Figure 2. In the network for the hospital in Fig. 2A, medical specialists and surgeons are far more central, with almost all PCPs being located in the periphery of the network. In contrast, the networks of the hospitals in Figs. 2B and 2C have PCPs more prominently participating as central physicians. The relative centrality of PCPs in hospitals A, B and C are 0.35, 1.0 and 2.0, respectively.
Relationship between Hospital Networks and Care Patterns
The unadjusted relationships between median adjusted degree, PCP centrality, and total Medicare spending per hospital are depicted in Appendix Figure 1.
Adjusted relationships between hospital network structure and hospital outcomes, controlling for hospital characteristics, are presented in Figure 3. For the average-sized, urban hospital in our sample, an increase of one standard deviation (SD) in the median adjusted degree (corresponding to an addition of 107 doctors per 100 patients shared to the typical doctor’s number of contacts) was associated with a 17.8% (95% CI, 13.2,22.5) increase in total Medicare spending, 17.4% (95% CI, 12.6,22.4) more hospital days, and 23.8% (95% CI, 18.6,29.1) more physician visits in the last 2 years of life.
In contrast, higher centrality of primary care providers within an average-sized urban hospital network was correlated with a decrease in overall spending of 6.0% (95% CI, −9.5, −2.4), along with 9.2% (95% CI, −13.1, −5.1) lower spending on imaging and 12.9% (95% CI,−17.0,−8.6) lower spending on tests for a 1 SD increase. In addition, higher PCP centrality was accompanied by 8.6% (95% CI, −19.4,−9.7) fewer physician visits and 14.7% (95% CI, −19.4,−9.7) fewer medical specialist visits.
In analyses examining the interaction between the network measures and urban/non-urban location, the association between median adjusted degree and all nine cost and utilization outcomes was unaffected by the urban/non-urban location of hospitals (all p>0.05 for interaction). The association between PCP relative centrality and the nine outcomes was mostly non-significant, although still negative, for non-urban hospitals (all p<0.001 for interaction except for general medical/surgical hospital days, p=0.06 and ICU days, p=0.14, results not shown).
Discussion
This is the first large-scale analysis to explore how the structure of patient-sharing relationships among physicians is related to care patterns within hospitals. In addition, we present a novel method for using readily available administrative data to construct networks of physicians that will be useful for studying physician practice patterns.14 We find that the structure of physician patient-sharing networks is significantly associated with Medicare spending and care patterns. Higher adjusted degree is associated with higher spending and health care utilization even after adjusting for hospital characteristics. In contrast, higher PCP relative centrality is associated with lower spending and utilization. These results are consistent with the hypothesis that network measures reflective of poorer coordination of care within hospitals are associated with higher costs and care intensity.
We found that hospitals with physicians whose patients see a broader array of other doctors (higher adjusted degree) have higher levels of spending. They also use more hospital care, physician visits, and imaging. These associations may reflect the difficulty of care coordination as physicians have to manage information from an increasing number of colleagues, which could be either a cause or an effect of increased health care utilization.
Another possible explanation for this phenomenon might be that hospitals whose physicians have high median adjusted degree have sicker patients (who see more physicians), leading to higher costs and utilization of services. Our methods make this unlikely for two reasons. First, our outcome measures are risk-adjusted to reflect similar patient populations, so differences in costs are not reflective of differences in burden of illness.13 Second, the adjusted degree measure is distinct from the number of physicians that patients see. The difference between a broad and focused network of physicians among the doctors caring for patients is the factor measured by the median adjusted degree.
In contrast, a network measure that likely reflects greater coordination of care, PCP relative centrality, was associated with lower imaging and test spending in addition to fewer ICU days and specialist visits. These findings build upon prior state-level analyses showing that states with more PCPs have lower costs,44 but extend this work to more formal network analysis considering the relative location of PCPs within a network of their colleagues. Interestingly, PCP relative centrality did not have a significant association with costs and utilization in non-urban hospitals. One possible interpretation of this result is that urban hospitals without primary care centered networks may be more likely to use readily-available specialist services, whereas in non-urban areas, this may not be as relevant because of less access to specialists.45 Further research is needed to understand the interaction between PCP centrality in urban and non-urban settings, but this approach could provide insight into how PCPs might best be utilized to contain costs and care utilization.
A prior study showed that the average primary care physician shares patients with approximately 99 other physicians based at 53 other practices per 100 Medicare patients treated.31 That analysis, however, was based on patients assigned to individual primary care physicians. We demonstrate that, when considering all patients being cared for by all physicians, including both PCPs and specialists, physicians are connected to 155–281 doctors per 100 Medicare patients shared with other doctors. This network-based perspective illustrates the challenge of care coordination among physicians.
Our study is subject to several limitations. First, we ascertained network structure based on the presence of shared patients using administrative data. While this technique has been validated,14 we nevertheless cannot know what information or behaviors, if any, pass across the ties defined by shared patients. In addition, our data are cross-sectional and only included elderly patients insured by the Medicare program. The local network of physicians and patients in a hospital or region is likely to be in flux, and future analyses would be enhanced by longitudinal data. Furthermore, the sample of hospitals we used is representative of larger, urban hospitals rather than all US hospitals. However, because the sample included a full range of hospital sizes, and because our focus is on the relationship between variables (not population aggregates or means), the representativeness should be less of a concern. Also, we used risk-adjusted hospital-level data on costs and care intensity averaged over 2001–2005 for our outcome measures while our networks were mapped with 2006 data. This discrepancy, however, would tend to bias our results towards the null.
Next, our main dependent variables were calculated using several years of data from the Medicare program by the Dartmouth Atlas of Healthcare. Although others have noted the possibility of inadequate risk adjustment or failure to account for differences in the prices paid for services in different regions,46,47 substantial variation in spending remains even after further risk adjustment.3,4 In addition, our models include several hospital-level characteristics that are likely to be associated with unmeasured case-mix, including size, urban versus rural location, and teaching hospital affiliation. With regards to prices, although the spending measures were not adjusted for regional payment differences, regional variation is reduced only modestly when taking prices into account.47 Moreover, our six utilization measures (e.g. hospitalizations) would not be affected by price differences and the findings for these outcomes serve to validate the findings we observed for spending.
Lastly, due to the observational design of this study, our results should not necessarily be interpreted as causal. Further work is needed to determine the causal mechanisms underlying these associations. In addition, though we adjusted for numerous covariates, we cannot rule out the possibility of unobserved confounders that could help explain the mechanisms driving the associations we observe. These unmeasured confounders could reflect local medical culture and market dynamics.
In summary, we studied a large sample of physician networks to examine how network structures reflect health care in a national sample of hospitals. This analysis highlights the importance of physician relationship networks – networks that are embedded in institutional structures and that may inform health policy and physician workforce management. We demonstrate that the characteristics of physician networks affiliated with a hospital are correlated with a hospital’s performance in a manner consistent with the hypothesis that poorer coordination of care is associated with greater spending and care intensity.
Supplementary Material
References
- 1.Fisher ES, Wennberg DE, Stukel TA, Gottlieb DJ, Lucas FL, Pinder EL. The implications of regional variations in Medicare spending. Part 1: health outcomes and satisfaction with care. Ann Intern Med. 2003;138:273–87. doi: 10.7326/0003-4819-138-4-200302180-00007. [DOI] [PubMed] [Google Scholar]
- 2.Wennberg JE, Fisher ES, Stukel TA, Skinner JS, Sharp SM, Bronner KK. Use of hospitals, physician visits, and hospice care during last six months of life among cohorts loyal to highly respected hospitals in the United States. BMJ: British Medical Journal. 2004;328:607. doi: 10.1136/bmj.328.7440.607. [DOI] [PMC free article] [PubMed] [Google Scholar]
- 3.Committee MPA. Report to Congress: measuring regional variation in service use. Washington, DC: MEDPAC; 2009. [Google Scholar]
- 4.Zuckerman S, Waidmann T, Berenson R, Hadley J. Clarifying sources of geographic differences in Medicare spending. N Engl J Med. 2010;363:54–62. doi: 10.1056/NEJMsa0909253. [DOI] [PubMed] [Google Scholar]
- 5.Yasaitis L, Fisher ES, Skinner JS, Chandra A. Hospital quality and intensity of spending: is there an association? Health Aff (Millwood) 2009;28:w566–72. doi: 10.1377/hlthaff.28.4.w566. [DOI] [PMC free article] [PubMed] [Google Scholar]
- 6.Barnato AE, Chang CC, Farrell MH, Lave JR, Roberts MS, Angus DC. Is survival better at hospitals with higher “end-of-life” treatment intensity? Med Care. 2010;48:125–32. doi: 10.1097/MLR.0b013e3181c161e4. [DOI] [PMC free article] [PubMed] [Google Scholar]
- 7.Jha AK, Chan DC, Ridgway AB, Franz C, Bates DW. Improving safety and eliminating redundant tests: cutting costs in U.S. hospitals. Health Aff (Millwood) 2009;28:1475–84. doi: 10.1377/hlthaff.28.5.1475. [DOI] [PubMed] [Google Scholar]
- 8.Sirovich B, Gottlieb D, Welch H, Fisher E. Variation in the Tendency of Primary Care Physicians to Intervene. Archives of Internal Medicine. 2005;165:2252. doi: 10.1001/archinte.165.19.2252. [DOI] [PubMed] [Google Scholar]
- 9.Sirovich B, Gallagher PM, Wennberg DE, Fisher ES. Discretionary decision making by primary care physicians and the cost of U.S. Health care. Health affairs (Project Hope) 2008;27:813–23. doi: 10.1377/hlthaff.27.3.813. [DOI] [PMC free article] [PubMed] [Google Scholar]
- 10.Lucas FL, Sirovich BE, Gallagher PM, Siewers AE, Wennberg DE. Variation in cardiologists’ propensity to test and treat: is it associated with regional variation in utilization? Circ Cardiovasc Qual Outcomes. 2010;3:253–60. doi: 10.1161/CIRCOUTCOMES.108.840009. [DOI] [PMC free article] [PubMed] [Google Scholar]
- 11.Keating NL, Zaslavsky AM, Ayanian JZ. Physicians’ experiences and beliefs regarding informal consultation. Jama. 1998;280:900–4. doi: 10.1001/jama.280.10.900. [DOI] [PubMed] [Google Scholar]
- 12.Gabbay J, le May A. Evidence based guidelines or collectively constructed “mindlines?.” Ethnographic study of knowledge management in primary care. BMJ. 2004;329:1013. doi: 10.1136/bmj.329.7473.1013. [DOI] [PMC free article] [PubMed] [Google Scholar]
- 13.Skinner J, Staiger D, Fisher ES. Looking back, moving forward. N Engl J Med. 2010;362:569–74. doi: 10.1056/NEJMp1000448. discussion 74. [DOI] [PubMed] [Google Scholar]
- 14.Barnett ML, Landon BE, O’Malley AJ, Keating NL, Christakis NA. Mapping Physician Networks with Self-Reported and Administrative Data. Health Serv Res. 2011 doi: 10.1111/j.1475-6773.2011.01262.x. [DOI] [PMC free article] [PubMed] [Google Scholar]
- 15.Newman ME. The structure and function of complex networks. SIAM Review. 2003;45:167–256. [Google Scholar]
- 16.Christakis NA, Fowler JH. The spread of obesity in a large social network over 32 years. N Engl J Med. 2007;357:370–9. doi: 10.1056/NEJMsa066082. [DOI] [PubMed] [Google Scholar]
- 17.Uzzi B. A social network’s changing statistical properties and the quality of human innovation. Journal of Physics A: Mathematical and Theoretical. 2008;41:224023. [Google Scholar]
- 18.Newman ME. Scientific collaboration networks. II. Shortest paths, weighted networks, and centrality. Phys Rev E Stat Nonlin Soft Matter Phys. 2001;64:016132. doi: 10.1103/PhysRevE.64.016132. [DOI] [PubMed] [Google Scholar]
- 19.Davis GF. The significance of board interlocks for corporate governance. Corporate Governance. 2006;4:154–9. [Google Scholar]
- 20.Keating NL, Ayanian JZ, Cleary PD, Marsden PV. Factors affecting influential discussions among physicians: a social network analysis of a primary care practice. J Gen Intern Med. 2007;22:794–8. doi: 10.1007/s11606-007-0190-8. [DOI] [PMC free article] [PubMed] [Google Scholar]
- 21.Coleman J, Katz E, Menzel H. The diffusion of innovations among physicians. Sociometry. 1957;20:253–70. [Google Scholar]
- 22.Iyengar R, Van den Bulte C, Valente TW. Opinion leadership and social contagion in new product diffusion. Marketing Science. 2010 In Press. [Google Scholar]
- 23.Christakis NA, Fowler JH. Contagion in prescribing behavior among networks of doctors. Marketing Science. 2010 In Press. [Google Scholar]
- 24.Raddish M, Horn SD, Sharkey PD. Continuity of care: is it cost effective? Am J Manag Care. 1999;5:727–34. [PubMed] [Google Scholar]
- 25.Wasson JH, Sauvigne AE, Mogielnicki RP, et al. Continuity of outpatient medical care in elderly men. A randomized trial. JAMA. 1984;252:2413–7. [PubMed] [Google Scholar]
- 26.Valenstein P, Leiken A, Lehmann C. Test-ordering by multiple physicians increases unnecessary laboratory examinations. Arch Pathol Lab Med. 1988;112:238–41. [PubMed] [Google Scholar]
- 27. [Accessed May 6, 2010];Research-level data of End of Life Measures from The Dartmouth Atlas of Health Care. 2008 at http://intensity.dartmouth.edu/?q=node/68.
- 28.Iezzoni LI, Heeren T, Foley SM, Daley J, Hughes J, Coffman GA. Chronic conditions and risk of in-hospital death. Health Serv Res. 1994;29:435–60. [PMC free article] [PubMed] [Google Scholar]
- 29.Wennberg JE, Fisher E, Goodman DC, Skinner J. Tracking The Care of Patients with Severe Chronic Illness: The Dartmouth Atlas of Health Care, 2008. Lebanon, NH: The Dartmouth Institute for Health Policy & Clinical Practice, Center for Health Policy Research; 2008. [PubMed] [Google Scholar]
- 30.Bynum JP, Bernal-Delgado E, Gottlieb D, Fisher E. Assigning ambulatory patients and their physicians to hospitals: a method for obtaining population-based provider performance measurements. Health Serv Res. 2007;42:45–62. doi: 10.1111/j.1475-6773.2006.00633.x. [DOI] [PMC free article] [PubMed] [Google Scholar]
- 31.Pham HH, O’Malley AS, Bach PB, Saiontz-Martinez C, Schrag D. Primary care physicians’ links to other physicians through Medicare patients: the scope of care coordination. Ann Intern Med. 2009;150:236–42. doi: 10.7326/0003-4819-150-4-200902170-00004. [DOI] [PMC free article] [PubMed] [Google Scholar]
- 32.Wasserman S, Faust K. Social Network Analysis: Methods and Applications. Cambridge, MA: Cambridge University Press; 1994. [Google Scholar]
- 33.Fruchterman TMJ, Reingold EM. Graph Drawing by Force-directed Placement. Software-Practice and Experience. 1991;21:1129–64. [Google Scholar]
- 34.Starfield B, Shi L, Macinko J. Contribution of primary care to health systems and health. Milbank Q. 2005;83:457–502. doi: 10.1111/j.1468-0009.2005.00409.x. [DOI] [PMC free article] [PubMed] [Google Scholar]
- 35.Rural-Urban Commuting Code database. University of Washington; [Accessed May 6, 2010]. at http://depts.washington.edu/uwruca/index.php. [Google Scholar]
- 36.Landon BE, Normand SL, Lessler A, et al. Quality of care for the treatment of acute medical conditions in US hospitals. Arch Intern Med. 2006;166:2511–7. doi: 10.1001/archinte.166.22.2511. [DOI] [PubMed] [Google Scholar]
- 37.White H. A heteroskedasticity-consistent covariance matrix and a direct test for heteroskedasticity. Econometrica. 1980;48:817–38. [Google Scholar]
- 38.Zeileis A. Econometric Computing with HC and HAC Covariance Matrix Estimators. Journal of Statistical Software. 2004;11:1–17. [Google Scholar]
- 39.Wilcox RR. Introduction to Robust Estimation and Hypothesis Testing. New York: Elsevier; 2005. [Google Scholar]
- 40.R Development Core Team. R: A language and environment for statistical computing. Vienna, Austria: R Foundation for Statistical Computing; 2009. [Google Scholar]
- 41.Csardi G, Nepusz T. The igraph software package for complex network research. InterJournal, Complex Systems. 2006 [Google Scholar]
- 42.Imai K, King G, Lau O. R package version 3.4–8 ed. 2010. Zelig: Everyone’s Statistical Software. [Google Scholar]
- 43.sna: Tools for Social Network Analysis. [Accessed May 6, 2010];R package version 2.0–1. 2009 at http://erzuli.ss.uci.edu/R.stuff.
- 44.Baicker K, Chandra A. Medicare spending, the physician workforce, and beneficiaries’ quality of care. Health Aff (Millwood) 2004;(Suppl Web Exclusives):W184–97. doi: 10.1377/hlthaff.w4.184. [DOI] [PubMed] [Google Scholar]
- 45.Rosenthal MB, Zaslavsky A, Newhouse JP. The geographic distribution of physicians revisited. Health Serv Res. 2005;40:1931–52. doi: 10.1111/j.1475-6773.2005.00440.x. [DOI] [PMC free article] [PubMed] [Google Scholar]
- 46.Bach PB. A map to bad policy--hospital efficiency measures in the Dartmouth Atlas. N Engl J Med. 2010;362:569–73. doi: 10.1056/NEJMp0909947. discussion p 74. [DOI] [PMC free article] [PubMed] [Google Scholar]
- 47.Gottlieb DJ, Zhou W, Song Y, Andrews KG, Skinner JS, Sutherland JM. Prices don’t drive regional Medicare spending variations. Health Aff (Millwood) 2010;29:537–43. doi: 10.1377/hlthaff.2009.0609. [DOI] [PMC free article] [PubMed] [Google Scholar]
Associated Data
This section collects any data citations, data availability statements, or supplementary materials included in this article.