

Abstract
Background
Obesity and knee osteoarthritis are among the most frequent chronic conditions affecting Americans aged 50 to 84 years.
Objective
To estimate quality-adjusted life-years lost due to obesity and knee osteoarthritis and health benefits of reducing obesity prevalence to levels observed a decade ago.
Design
The U.S. Census and obesity data from national data sources were combined with estimated prevalence of symptomatic knee osteoarthritis to assign persons aged 50 to 84 years to 4 subpopulations: nonobese without knee osteoarthritis (reference group), nonobese with knee osteoarthritis, obese without knee osteoarthritis, and obese with knee osteoarthritis. The Osteoarthritis Policy Model, a computer simulation model of knee osteoarthritis and obesity, was used to estimate quality-adjusted life-year losses due to knee osteoarthritis and obesity in comparison with the reference group.
Setting
United States.
Participants
U.S. population aged 50 to 84 years.
Measurements
Quality-adjusted life-years lost owing to knee osteoarthritis and obesity.
Results
Estimated total losses of per-person quality-adjusted life-years ranged from 1.857 in nonobese persons with knee osteoarthritis to 3.501 for persons affected by both conditions, resulting in a total of 86.0 million quality-adjusted life-years lost due to obesity, knee osteoarthritis, or both. Quality-adjusted life-years lost due to knee osteoarthritis and/or obesity represent 10% to 25% of the remaining quality-adjusted survival of persons aged 50 to 84 years. Hispanic and black women had disproportionately high losses. Model findings suggested that reversing obesity prevalence to levels seen 10 years ago would avert 178 071 cases of coronary heart disease, 889 872 cases of diabetes, and 111 206 total knee replacements. Such a reduction in obesity would increase the quantity of life by 6 318 030 years and improve life expectancy by 7 812 120 quality-adjusted years in U.S. adults aged 50 to 84 years.
Limitations
Comorbidity incidences were derived from prevalence estimates on the basis of life expectancy of the general population, potentially resulting in conservative underestimates. Calibration analyses were conducted to ensure comparability of model-based projections and data from external sources.
Conclusion
The number of quality-adjusted life-years lost owing to knee osteoarthritis and obesity seems to be substantial, with black and Hispanic women experiencing disproportionate losses. Reducing mean body mass index to the levels observed a decade ago in this population would yield substantial health benefits.
Primary Funding Source
The National Institutes of Health and the Arthritis Foundation.
The U.S. obesity epidemic and longer life expectancy have contributed to high prevalence and incidence of knee osteoarthritis in older Americans (1-5). In fact, obesity and knee osteoarthritis are among the most frequent comorbid conditions in this age group in the United States (6-8). Obesity leads to a higher prevalence of major chronic diseases, such as diabetes mellitus, coronary heart disease, chronic obstructive pulmonary disease, and musculoskeletal conditions (9-13). In addition to indirect effects from associated comorbid conditions, obesity directly influences both quantity and quality of life (14-17).
Knee osteoarthritis is a chronic condition characterized by loss of joint function and persistent pain, both of which diminish health-related quality of life (18). Osteoarthritis is the fourth leading source of nonfatal health burden, accounting for 3% of total years lived with a disability (19). Knee osteoarthritis is among the most prevalent and disabling types of osteoarthritis (20). The epidemics of obesity and knee osteoarthritis in the United States disproportionately affect women, especially black women (21, 22).
Both osteoarthritis and obesity can be prevented through lifestyle modifications (23), yet the prevalence of both conditions is on the rise (24, 25). For health-related messages to change behavior, persons must view the problem as relevant and serious, and they must perceive behavior change as beneficial. Patients are more receptive to health information when it is framed in terms of potential gains (26) and when those gains are depicted in persons of their own race and sex (27). By equipping physicians and public health officials with estimates of quality-adjusted life-years lost owing to obesity and knee osteoarthritis, our research will enable them to convey the rationale for behavior change to patients and the public.
We assessed the longitudinal effect of obesity and knee osteoarthritis on remaining duration and quality of life in a population with the highest burden of both conditions: persons aged 50 to 84 years. We used a comprehensive modeling approach that takes the following factors into account: the race- and sex-specific prevalence of obesity and knee osteoarthritis and other obesity-related comorbid conditions, such as coronary heart disease, diabetes mellitus, cancer, chronic obstructive pulmonary disease, and musculoskeletal conditions; the effect of obesity and its associated comorbid conditions on mortality and quality of life; and tangible societal benefits (expressed as averted cases of coronary heart disease, diabetes mellitus, and total knee replacement) of implementing weight-control programs that reduce the mean population-based body mass index (BMI). To our knowledge, this study is the first to quantify the survival and quality-of-life benefits of obesity prevention for race- and sex-defined populations.
METHODS
Analytic Overview
We used the Osteoarthritis Policy (OAPol) Model to estimate quality-adjusted life-years lost in the U.S. population aged 50 to 84 years with obesity, symptomatic knee osteoarthritis, or both over the remaining lifespan. To accurately account for the population distribution and increasing prevalence of knee osteoarthritis with age, we conducted analyses within 5-year age strata and aggregated results across these strata. This approach allowed us to demonstrate the increased effect of knee osteoarthritis in older age groups. (For details, see Part III of the Supplement, available at www.annals.org).
We considered 4 cohorts: nonobese persons without symptomatic knee osteoarthritis (reference), nonobese persons with symptomatic knee osteoarthritis, obese persons without symptomatic knee osteoarthritis, and obese persons with symptomatic knee osteoarthritis. The mean per-person quality-adjusted life-years lost in the cohorts with symptomatic knee osteoarthritis, obesity, or both were estimated by subtracting the quality-adjusted life expectancy in each cohort from the quality-adjusted life expectancy in the reference group. These calculations were stratified by sex and race or ethnicity. To determine the populationbased quality-adjusted life-years lost in persons with knee osteoarthritis, obesity, or both conditions, we multiplied the average per-person losses by the size of each raceor ethnicity-, sex-, osteoarthritis-, and obesity-specific population in the United States.
OAPol Model Structure
The OAPol Model is a computer-based, state transition, Monte Carlo simulation estimating quality-adjusted life expectancy in persons with obesity, knee osteoarthritis, or both (Figure 1). State transition means that the model characterizes each person’s clinical progression as a sequence of annual transitions from one health state to another. Monte Carlo simulation refers to the procedure of simulating one hypothetical person at a time, using a set of transition probabilities to determine the health state transitions experienced by that person. To ensure stability of model output, we used a simulation size of 1 million persons. The model summarizes the 1 million unique person histories to provide stable estimates of societal burden. Further details are presented in Part I of the Supplement.
Figure 1. Transitions among health states in the OAPol Model.
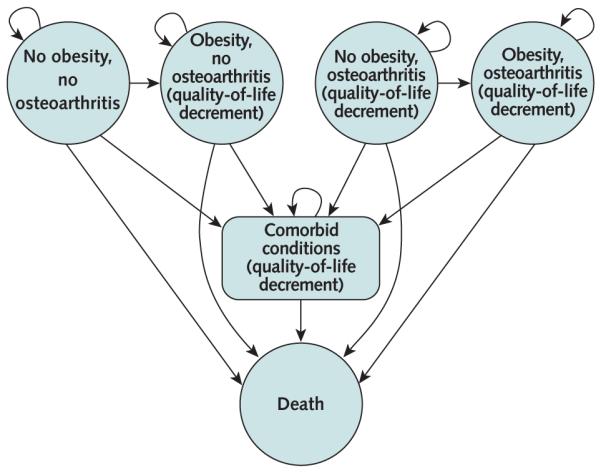
The circles represent the 4 major health states in the OAPol Model. Persons may spend several cycles in the same health state or transition to another health state. Arrows specify transitions between health states, defined by transition probabilities (the OAPol Model input parameters). Comorbid conditions may occur in each state and lead to increased mortality. Incidence of comorbid conditions increases with age and obesity. In particular, comorbid conditions are considered in combination with obesity and knee osteoarthritis. Patients may have 0 to 5 comorbid conditions, for a total of 32 combinations. Therefore, the total number of states is equal to the product of 4 knee osteoarthritis states (no osteoarthritis, Kellgren–Lawrence grade 2, Kellgren–Lawrence grade 3, and Kellgren–Lawrence grade 4), 3 obesity states (normal, obese, and morbidly obese), 32 comorbidity states, and 1 absorbing state (death), for a total of 385 states. Each health state is associated with quality-of-life utilities (i.e., coefficients applied to each cycle [year] spent in a corresponding health state). Death can occur in any health state. OAPol = Osteoarthritis Policy.
In addition to duration of life, the OAPol Model also considers quality of life. Quality-of-life estimates are often formulated in terms of preference-based measures of utility, in which perfect health is assigned a value of 1 and death is assigned a value of 0 (28). The quality-adjusted life-year is a health outcome measure that weighs years of survival by quality-of-life utilities across the lifespan of the person. Health states in the OAPol Model are defined by obesity, symptomatic knee osteoarthritis status, and several comorbid conditions. Each of these factors affects quality of life, and some also influence quantity of life (Figure 1).
Obesity
Obesity is defined in the model by a BMI of 30 kg/m2 or greater. The effect of obesity on survival and quality of life is modeled in several ways. Obesity directly increases the risk for death (3, 17, 29) and increases the prevalence and incidence of major comorbid conditions in the model (30, 31). Finally, obesity exerts an independent effect on quality of life (14, 32).
Knee Osteoarthritis
Functional limitations and persistent pain in persons with symptomatic knee osteoarthritis lead to decreased quality of life. The OAPol Model captures structural (radiographic) progression of knee osteoarthritis to establish eligibility for total knee replacement, generally done in patients with advanced radiographic disease. Total knee replacement is the most effective osteoarthritis treatment for reducing functional limitations (33), typically resulting in marked quality-of-life improvements that reach preosteoarthritis levels (34, 35).
Comorbid Conditions
The OAPol Model captures 5 prevalent, prognostically important comorbid conditions affecting quantity, quality of life, or both: diabetes mellitus, coronary heart disease, cancer, chronic obstructive pulmonary disease, and musculoskeletal disorders other than knee osteoarthritis. Each comorbid condition is described by prevalence, incidence, and effect on mortality, stratified by age, sex, and race or ethnicity. We recognize important interdependencies among specific comorbid conditions. For example, obese persons are at higher risk for diabetes and coronary heart disease (12). We account for this by assigning increased age- and sex-stratified risks for these conditions in obese persons.
Input Data
The OAPol Model data are stratified into 3 domains: demographic and clinical characteristics; natural history and management of knee osteoarthritis; and quality-of-life decrements due to obesity, knee osteoarthritis, and comorbid conditions. We derived input parameters from nationally recognized data sources, including NHANES (National Health and Nutrition Examination Survey, 2005–2008), the National Center for Health Statistics and the U.S. Census, as well as the published literature (36-39). Details on the derivation of model input parameters are presented in Part II of the Supplement.
Cohort Characteristics
Population size, stratified by sex and race or ethnicity, was derived using data from the 2009 U.S. Census projections (39). Obesity and comorbidity prevalence rates stratified by age, sex, and race or ethnicity were derived from NHANES, 2005–2008 data (36, 37). All NHANES-based analyses used appropriate weights to provide population-based estimates.
Knee Osteoarthritis Natural History and Management
Symptomatic knee osteoarthritis was stratified by age, sex, and obesity status. Using incidence rates from one study (40), coupled with the estimated effect of obesity on knee osteoarthritis incidence (41), we projected the prevalence of symptomatic knee osteoarthritis in persons aged 50 to 84 years. We then compared these estimates with published data on prevalence of symptomatic knee osteoarthritis for persons older than 45 years (42). Differences between the OAPol-based estimates and published population-based rates did not exceed 3.4% (Part II, B2, of the Supplement).
Knee osteoarthritis progression rates were derived from the Johnston County Osteoarthritis Project, a prospective study of knee osteoarthritis in North Carolina (22), and calibrated to published literature (2) (Table 1). We conducted this calibration because the Johnston County cohort may not be representative of the U.S. population.
Table 1. Cohort Characteristics and Selected Osteoarthritis Policy Model Input Values.
| Variable | Value |
|---|---|
| Mean age (SD), y | 63.4 (9.7) |
| Race or Ethnicity | |||
|---|---|---|---|
| White | Black | Hispanic | |
| Mean BMI (SD), kg/m2 | |||
| Nonobese | |||
| Women | 24.8 (3.2) | 25.2 (3.4) | 25.9 (2.8) |
| Men | 25.9 (2.8) | 24.9 (3.5) | 26.0 (2.6) |
| Obese | |||
| Women | 35.3 (4.5) | 36.8 (6.4) | 35.6 (5.0) |
| Men | 34.9 (4.8) | 35.8 (5.8) | 33.8 (3.0) |
| K–L 2–3 (95% CI) | K–L 3–4 (95% CI) | |
|---|---|---|
| Radiographic progression of knee osteoarthritis | ||
| Nonobese | ||
| Women | 4.00 (2.18–5.97) | 1.95 (0.39–5.67) |
| Men | 5.58 (3.06–8.30) | 1.29 (0.26–3.80) |
| Obese | ||
| Women | 8.95 (4.95–13.19) | 4.27 (0.87–12.16) |
| Men | 12.26 (6.83–17.90) | 2.94 (0.60–8.48) |
| Obesity | Number of Comorbid Conditions |
Functional Limitation |
Quality-of-Life Utility (95% CI) |
|
|---|---|---|---|---|
| Quality-of-life utilities, by age | ||||
| Age 50–64 y | Nonobese | 0–1 | No | 0.951 (0.941–0.960) |
| Yes | 0.824 (0.796–0.852) | |||
| 2–3 | No | 0.895 (0.869–0.921) | ||
| Yes | 0.731 (0.690–0.773) | |||
| >3 | No | 0.655 (0.644–0.665) | ||
| Yes | 0.655 (0.644–0.665) | |||
| Obese | 0–1 | No | 0.932 (0.920–0.945) | |
| Yes | 0.805 (0.777–0.834) | |||
| 2–3 | No | 0.877 (0.848–0.905) | ||
| Yes | 0.713 (0.670–0.755) | |||
| >3 | No | 0.655 (0.644–0.665) | ||
| Yes | 0.655 (0.644–0.665) | |||
| Age ≥65 y | Nonobese | 0–1 | No | 0.942 (0.932–0.952) |
| Yes | 0.882 (0.865–0.899) | |||
| 2–3 | No | 0.886 (0.860–0.913) | ||
| Yes | 0.789 (0.764–0.814) | |||
| >3 | No | 0.655 (0.644–0.665) | ||
| Yes | 0.655 (0.644–0.665) | |||
| Obese | 0–1 | No | 0.924 (0.908–0.940) | |
| Yes | 0.863 (0.846–0.881) | |||
| 2–3 | No | 0.868 (0.838–0.898) | ||
| Yes | 0.770 (0.744–0.797) | |||
| >3 | No | 0.655 (0.644–0.665) | ||
| Yes | 0.655 (0.644–0.665) |
BMI = body mass index; K–L = Kellgren–Lawrence radiographic grade.
Health-Related Quality of Life
Quality-of-life utility scores were derived from the general health status question in the NHANES 2005-2006 and 2007-2008 surveys (36, 37). Per Reichmann and colleagues (43), we estimated quality-of-life utility by converting the item responses to health status ratings (on a 0 to 100 scale) according to the algorithm of another study (44). We then transformed the rating scale to a utility, using the power transformation of Torrance and colleagues (45). Further analytic details are presented in Part II of the Supplement. These quality-of-life scores in the OAPol Model ranged from 0.951 for nonobese persons without knee osteoarthritis and with 0 to 1 comorbid conditions to 0.655 for obese persons with symptomatic knee osteoarthritis and more than 3 comorbid conditions (Table 1).
Mortality
Background age-, sex-, and race-specific mortality rates in persons without chronic conditions were derived using life-tables data published by the Centers for Disease Control and Prevention by removing cause-specific mortality due to major comorbid conditions (46) (Part II of the Supplement). In addition to background mortality, the OAPol Model incorporates increased mortality due to coronary heart disease, cancer, and obesity. The independent effect of obesity on mortality, stratified by age, sex, and race or ethnicity, was derived from published data (47). Estimated life expectancy projected by the OAPol Model was within 4% of published estimates (Part II of the Supplement).
Attributing the Quality-Adjusted Life-Years Lost Owing to Knee Osteoarthritis and Obesity
For persons affected by both knee osteoarthritis and obesity, we assigned condition-attributable quality-adjusted life-year losses for obesity and knee osteoarthritis in proportion to the losses attributable to each condition alone. We first estimated quality-adjusted life-year losses attributable to knee osteoarthritis in persons with knee osteoarthritis only. Next, we estimated losses attributable to obesity in persons with obesity only. The size of each of these 2 estimates relative to their sum served as the “weights” used to allocate the quality-adjusted life-year losses predicted by the OAPol Model for persons affected by both conditions.
Estimating the Health Benefits of “Reversing” Obesity Trends Over the Past Decade
Using published data on obesity trends over the past decade (48) combined with meta-analysis–based data on the efficacy of weight-reduction interventions (49, 50), we translated per-person health outcomes into estimated population benefits expressed as cases of coronary heart disease and diabetes mellitus averted and total knee replacements prevented. We also estimated the life-years saved and quality-adjusted life-years saved as a result of interventions that reduce obesity to levels observed 10 years ago.
Role of the Funding Source
The National Institutes of Health and the Arthritis Foundation funded this study. The funding sources had no role in developing the model, creating input parameters, interpreting results, or deciding to submit the manuscript for publication.
RESULTS
Population Description
Table 2 shows the prevalence of obesity and symptomatic knee osteoarthritis in the United States, stratified by sex and race or ethnicity. We estimated that among 85 966 369 persons aged 50 to 84 years, 33.4% (28 743 669) are obese without symptomatic knee osteoarthritis, 3.3% (2 802 710) are nonobese with symptomatic knee osteoarthritis, and 3.3% (2 871 922) are obese with concomitant symptomatic knee osteoarthritis. In contrast to men, the estimated number of women who have either symptomatic knee osteoarthritis, obesity, or both varies greatly by race or ethnicity, ranging from 38% for whites to 50% for Hispanics and 55% for blacks.
Table 2. U.S. Population Sizes for Persons Aged 50 to 84 Years, by Race or Ethnicity, Sex, Knee Osteoarthritis, and Obesity.
| Race and Sex | Total U.S. Population, n |
Osteoarthritis-Free and Nonobese, n (%)* |
Osteoarthritis-Free and Obese, n (%)* |
Knee Osteoarthritis and Nonobese, n (%)* |
Knee Osteoarthritis and Obese, n (%)* |
Total With Knee Osteoarthritis, n |
Total Obese, n |
|---|---|---|---|---|---|---|---|
| Black | |||||||
| Women | 5 223 119 | 2 359 546 (45.2) | 2 487 298 (47.6) | 131 191 (2.5) | 245 084 (4.7) | 376 275 | 2 732 382 |
| Men | 4 015 026 | 2 251 727 (56.1) | 1 528 521 (38.1) | 101 573 (2.5) | 133 205 (3.3) | 234 778 | 1 661 727 |
| Hispanic | |||||||
| Women | 4 032 464 | 2 001 909 (49.6) | 1 757 529 (43.6) | 110 790 (2.7) | 162 236 (4.0) | 273 027 | 1 919 765 |
| Men | 3 672 622 | 2 262 873 (61.6) | 1 208 958 (32.9) | 104 840 (2.9) | 95 951 (2.6) | 200 791 | 1 304 909 |
| White | |||||||
| Women | 36 280 923 | 22 602 335 (62.3) | 11 116 425 (30.6) | 1 344 426 (3.7) | 1 217 738 (3.4) | 2 562 163 | 12 334 162 |
| Men | 32 742 215 | 20 069 679 (61.3) | 10 644 938 (32.5) | 1 009 891 (3.1) | 1 017 707 (3.1) | 2 027 598 | 11 662 646 |
| Total | 85 966 369 | 51 548 068 (60.0) | 28 743 669 (33.4) | 2 802 710 (3.3) | 2 871 922 (3.3) | 5 674 632 | 31 615 591 |
Percentage of race- and sex-stratified population group.
Quality-Adjusted Life Expectancy and Per-Person Quality-Adjusted Life-Years Lost
Quality-adjusted life expectancy estimates obtained from the OAPol Model were recorded for each population group stratified by 5-year age increments (Part III of the Supplement). Absolute differences in quality-adjusted life expectancy (relative to the “osteoarthritis-free, nonobese” reference case) yielded the quality-adjusted life-year losses reported in Table 3. Detailed data are presented in the Part III of the Supplement. Table 3 also reports the attribution of quality-adjusted life-years lost to obesity and osteoarthritis for persons with both conditions. Per-person quality-adjusted life-years lost in persons aged 50 to 84 years with knee osteoarthritis in the United States ranged from an estimated 1.857 for nonobese persons to 3.501 for obese persons. Obese persons without knee osteoarthritis lost, on average, 2.461 quality-adjusted life-years over their remaining lifespan. Estimated qualityadjusted life-years lost for obese persons without knee osteoarthritis ranged from 2.316 for Hispanic men to 2.656 for Hispanic women. Among persons with both obesity and knee osteoarthritis, estimated quality-adjusted life-years lost owing to either condition ranged from 3.338 per person for white men to 3.863 for Hispanic women.
Table 3. Per-Person Quality-Adjusted Life-Years Lost Owing to Obesity and Knee Osteoarthritis in the U.S. Population Aged 50 to 84 Years.
| Race and Sex | Total Per-Person Quality-Adjusted Life-Years Lost | Attribution of a Single Condition to Total Quality-Adjusted Life-Years Lost in Persons With Both Obesity and Knee Osteoarthritis* |
|||
|---|---|---|---|---|---|
| Osteoarthritis-Free and Obese |
Knee Osteoarthritis and Nonobese |
Knee Osteoarthritis and Obese |
Quality-Adjusted Life-Years Lost Owing to Knee Osteoarthritis |
Quality-Adjusted Life-Years Lost Owing to Obesity |
|
| Black | |||||
| Women | 2.611 | 1.967 | 3.750 | 1.836 | 1.914 |
| Men | 2.540 | 1.920 | 3.348 | 1.621 | 1.728 |
| Hispanic | |||||
| Women | 2.656 | 2.012 | 3.863 | 1.917 | 1.946 |
| Men | 2.316 | 2.041 | 3.529 | 1.864 | 1.665 |
| White | |||||
| Women | 2.533 | 1.838 | 3.554 | 1.713 | 1.841 |
| Men | 2.325 | 1.824 | 3.338 | 1.639 | 1.700 |
| Population average | 2.461 | 1.857 | 3.501 | 1.710 | 1.792 |
For persons with both knee osteoarthritis and obesity, condition-attributable quality-adjusted life-year losses were assigned for obesity and knee osteoarthritis in proportion to the quality-adjusted life-year losses attributable to each condition alone. First, only quality-adjusted life-year losses attributable to knee osteoarthritis in persons with knee osteoarthritis were estimated. Next, only quality-adjusted life-year losses attributable to obesity in persons with obesity were estimated. The size of each of these 2 estimates relative to their sum served as the “weights” used to allocate the quality-adjusted life-year losses predicted by the Osteoarthritis Policy Model for persons with both conditions.
Having both conditions simultaneously decreased estimated remaining quality-adjusted life expectancy by 21% to 25%. Obesity alone decreased remaining quality-adjusted life expectancy by 10% to 15%. Knee osteoarthritis alone reduced remaining quality-adjusted life expectancy by 10% to 14%, with higher losses corresponding to earlier age of osteoarthritis onset (Part III of the Supplement).
Osteoarthritis has a greater effect on quality-adjusted life-years lost with increasing age (Figure 4 of the Supplement), reflecting increased osteoarthritis prevalence with age. Although knee osteoarthritis contributed less than 10% to quality-adjusted life-years lost for persons in their 50s, the proportion reached 15% to 25% for persons in their 70s and 80s. Among Hispanic men, knee osteoarthritis accounted for a greater estimated relative contribution to quality-adjusted life-years lost because persons in this subpopulation are less likely to be obese. In contrast, black women had a smaller contribution of knee osteoarthritis to quality-adjusted life-years lost because obesity prevalence is highest among black women.
Population-Based Quality-Adjusted Life-Years Lost
We combined the population sizes reported in Table 2 with the quality-adjusted life-year losses projected in Table 3 to estimate total quality-adjusted life-years lost for the population (Table 4). Among the 31.6 million obese persons (Table 2), we estimated total losses of 80.8 million quality-adjusted life-years. Specifically, we estimated that, overall, 5 674 632 persons with symptomatic knee osteoarthritis from age 50 to 84 years (Table 2) lost 15 259 178 quality-adjusted life-years (Table 4) over their remaining lifespan compared with persons of the same demographic characteristics who remained free of knee osteoarthritis and obesity. Of these losses, 10 113 151 quality-adjusted life-years (66%) were attributable to knee osteoarthritis. Among the 2 802 710 nonobese persons affected by knee osteoarthritis (Table 2), we estimated losses of 5 203 418 quality-adjusted life-years (Table 4), whereas among the 2 871 922 persons with both knee osteoarthritis and obesity (Table 2), we estimated 10 055 760 quality-adjusted life-years lost, with 4 909 733 (49%) attributable to knee osteoarthritis and 5 146 027 (51%) to obesity. The 3.3% of the population affected by both obesity and knee osteoarthritis contributed 11.7% of the total quality-adjusted life-years lost owing to these conditions.
Table 4. Total Quality-Adjusted Life-Years Lost Owing to Obesity and Knee Osteoarthritis in the U.S. Population Aged 50 to 84 Years.
| Race and Sex |
Quality-Adjusted Life-Years Lost Owing to Knee Osteoarthritis |
Quality-Adjusted Life-Years Lost Owing to Obesity | Total Quality-Adjusted Life-Years Lost |
|||||
|---|---|---|---|---|---|---|---|---|
| Nonobese Persons (1) |
Obese Persons (2) |
Overall Population (1 + 2) |
Osteoarthritis-Free Persons (3) |
Persons With Knee Osteo- arthritis (4) |
Overall Population (3 + 4) |
Persons With Knee Osteo- arthritis (1 + 2 + 4) |
Obese Persons (2 + 3 + 4) |
|
| Black | ||||||||
| Women | 258 114 | 449 923 | 708 036 | 6 493 886 | 469 159 | 6 963 045 | 1 177 195 | 7 412 968 |
| Men | 195 003 | 215 897 | 410 900 | 3 882 363 | 230 124 | 4 112 488 | 641 024 | 4 328 384 |
| Hispanic | ||||||||
| Women | 222 933 | 310 956 | 533 889 | 4 667 829 | 315 693 | 4 983 522 | 849 582 | 5 294 479 |
| Men | 214 007 | 178 818 | 392 825 | 2 800 024 | 159 790 | 2 959 814 | 552 615 | 3 138 632 |
| White | ||||||||
| Women | 2 471 304 | 2 086 287 | 4 557 591 | 28 154 713 | 2 241 536 | 30 396 249 | 6 799 128 | 32 482 536 |
| Men | 1 842 058 | 1 667 852 | 3 509 910 | 24 750 229 | 1 729 725 | 26 479 954 | 5 239 635 | 28 147 806 |
| Total | 5 203 418 | 4 909 733 | 10 113 151 | 70 749 045 | 5 146 027 | 75 895 072 | 15 259 178 | 80 804 805 |
Impact of Sex and Race or Ethnicity on Quality-Adjusted Life-Years Lost Owing to Obesity and Knee Osteoarthritis
Black women represented 6.1% of the population of persons 50 to 84 years of age in the United States but accounted for an estimated 8.9% of all quality-adjusted life-years lost owing to obesity and symptomatic knee osteoarthritis, resulting in a 47% excess in quality-adjusted life-year losses due to obesity and/or knee osteoarthritis relative to population size (Figure 2). Hispanic women contributed 4.7% to the overall population size but lost an estimated 6.4% of all quality-adjusted life-years, a 37% excess of quality-adjusted life-years lost.
Figure 2. Excess of quality-adjusted life-years lost owing to obesity and knee osteoarthritis, as a ratio relative to population size.
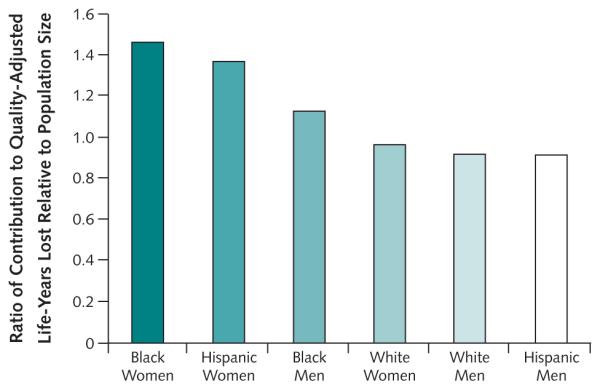
The height of each bar represents the ratio of the proportion of total quality-adjusted life-years lost attributable to each sex and race or ethnic group to each group’s size relative to the total U.S. population.
Health Benefits of Reversing Trends in the Obesity Epidemic Over the Past Decade
We examined the effects of a weight-control intervention that would reverse obesity prevalence to the levels seen 10 years ago (48), a reduction in mean BMI of 0.6 unit (1.7-kg reduction for a person about 5 feet 7 inches). We estimated that a reduction in BMI of this magnitude would avert 178 071 (0.7%) coronary heart disease cases, 889 872 (2.5%) diabetes mellitus cases, and 111 206 (1.9%) total knee replacements over the remaining lifespan of this population. These changes in BMI would also increase life expectancy by 6 318 030 years and improve quality of life by 7 812 120 quality-adjusted life-years in the population of U.S. adults aged 50 to 84 years.
DISCUSSION
We estimated that roughly 86 million quality-adjusted life-years, comprising 8.4% of remaining quality-adjusted life expectancy, were lost over the remaining lifespan of a cohort of persons aged 50 to 84 years owing to obesity, symptomatic knee osteoarthritis, or both. These conditions affect 40% of the 85 966 369 U.S. citizens in that age range. We estimated that 12% of these losses were attributed to knee osteoarthritis and 88% to obesity. Black and Hispanic women were disproportionately affected by osteoarthritis and obesity and consequently had the greatest percentage of quality-adjusted life-years lost in comparison with their population size.
Symptomatic knee osteoarthritis and obesity probably influence quality-adjusted life-year losses through different mechanisms. Obesity affects quality of life; is an independent risk factor for mortality; and is associated with higher prevalence and incidence of diabetes mellitus, coronary heart disease, and other comorbid conditions that reduce survival (9-12). Thus, obesity reduces both quality and quantity of life (13-17). Symptomatic knee osteoarthritis does not directly affect mortality but considerably reduces quality of life, thereby diminishing quality-adjusted life expectancy (18). The racial and ethnic differences in quality-adjusted life expectancy in our model stem primarily from differential rates of knee osteoarthritis, coronary heart disease, diabetes mellitus, and cancer, as well as differences in underlying age- and sex-adjusted mortality.
The effect of symptomatic knee osteoarthritis on quality of life is similar to that of metastatic breast cancer and other disabling conditions (51-53). Obesity, independent of knee osteoarthritis, reduces life expectancy considerably (5, 54). Few studies have focused on the effect of obesity on quality of life. One study established that obesity is associated with poor quality of life and that joint pain, as well as obesity-related comorbid conditions, mediates the relationship between BMI and quality of life (55). Another study found that obesity is associated with diminished quality of life, even after adjustment for age, sex, and comorbid conditions (56). These findings were limited by the cross-sectional nature of both studies.
Several studies have shown that knee osteoarthritis is more prevalent in women than in men (7, 15, 57, 58). The Framingham Osteoarthritis Study (57) showed that increased weight in women elevated their risk for knee osteoarthritis. One study found that black women had greater risk for knee osteoarthritis, even after adjustment for age and BMI (21). Another study documented a nearly 3-fold greater prevalence of radiographically defined osteoarthritis in black versus white women (59). Our estimates showing disproportionate quality-adjusted life-year losses for black women are consistent with other findings (60).
The unique nature of our study lies in its ability to account for the multidimensional nature of disease burden, expressed as quality-adjusted life-year losses. Our approach allowed us to synthesize both mortality attributable to obesity and major comorbid conditions, as well as the diminished quality of life owing to knee osteoarthritis, obesity, and other comorbid conditions. Furthermore, we estimated attribution of quality-adjusted life-years lost owing to knee osteoarthritis and obesity in persons affected by both conditions. By linking per-person losses in quality-adjusted life expectancy to population size, we were able to estimate total quality-adjusted life-years lost for the entire population.
Our estimates show that reducing the mean BMI to levels experienced a decade ago in adults aged 50 to 84 years would yield substantial health benefits. Evidence suggests such changes in BMI are achievable and sustainable (49, 50).
Our study had several limitations. In modeling studies, the validity, precision, and completeness of input data may have important consequences for study findings. The OAPol Model input parameters were derived from several sources. Regular literature searches were conducted to identify the most current data. When newer data were not available, validation and calibration analyses were conducted by comparing model-based projections against data from external sources. When confronted with a choice of model inputs, we chose inputs that would lead to more conservative estimates of quality-adjusted life-expectancy losses. In the absence of longitudinal cohort data, prevalence estimates were converted to incidence on the basis of life expectancy of the general population, potentially resulting in conservative underestimates of incidence rates. The simplified approach used to estimate increased mortality among persons with several conditions is conservative because it avoids overestimating mortality. We based our estimates of symptomatic, radiographic osteoarthritis incidence on data that used cases diagnosed by a physician, making these estimates conservative. We did not include the effect of bariatric surgery—the obesity treatment method with the most substantial effects. Because bariatric surgery is done primarily in morbidly obese persons, this omission probably did not meaningfully influence our estimates. Although Asian Americans represent a growing proportion of the overall population, they are least affected by obesity and knee osteoarthritis, and data on the prevalence of comorbid conditions in Asian Americans (stratified by age and sex) are sparse. Thus, we did not include Asian Americans in our estimates.
Our model-based estimates suggest that among the 86 million persons aged 50 to 84 years in the United States, approximately 40% have symptomatic osteoarthritis, are obese, or both. These conditions result in 86 million quality-adjusted life-years lost among U.S. adults aged 50 to 84 years. Obesity reduces the remaining quality-adjusted life expectancy in obese persons by about 12% across all age groups, whereas osteoarthritis reduces the remaining quality-adjusted life expectancy in persons with knee osteoarthritis by about 13% in persons who are in their 50s and 10% in persons in their 70s. These findings underscore the importance of incorporating measures of quality of life in estimating the burden of these conditions. The disproportionate burden these conditions impose on black and Hispanic women suggests that future studies should investigate tailoring prevention and treatment strategies to sex and racial or ethnic subpopulations. With 86 million quality-adjusted life-years at stake and the incidence of knee osteoarthritis and obesity increasing, the potential public health effect of successful interventions to prevent these conditions is very substantial and worthy of intensive investigation.
Supplementary Material
Context
Obesity and knee osteoarthritis are very common comorbid conditions.
Contribution
This modeling study, which combined data from several national sources, showed substantial losses for middle-aged and older Americans in quality-adjusted life-years owing to knee osteoarthritis and obesity. Black and Hispanic women had disproportionately high losses. The model suggested that reversing obesity prevalence to levels seen 10 years ago would avert hundreds of thousands of cases of coronary heart disease, diabetes, and knee replacements and would increase life expectancy.
Implication
The potential public health effect of successful targeted interventions that prevent obesity and knee osteoarthritis is very substantial.
—The Editors
Acknowledgment
The authors thank Sara Burbine for her expert editorial assistance.
Grant Support: By the National Institutes of Health, National Institute of Arthritis and Musculoskeletal and Skin Diseases (R01 AR053112, K24 AR057827, K23 AR054095, P60 AR47782, T32 AR 055885, and K24 AR 02123); an Arthritis Foundation Innovative Research grant (Dr. Losina); and an Arthritis Investigator Award (Dr. Suter).
Footnotes
Note: Dr. Losina had full access to all of the data in the study and takes responsibility for the integrity of the data and the accuracy of the data analysis.
Potential Conflicts of Interest: Disclosures can be viewed at www.acponline.org/authors/icmje/ConflictOfInterestForms.do?msNum=M10-2150.
Reproducible Research Statement: Study protocol, statistical code, and data set: Available from Dr. Losina (Elosina@partners.org).
Requests for Single Reprints: Elena Losina, PhD, Department of Orthopaedic Surgery, Orthopaedic and Arthritis Center for Outcomes Research, Brigham and Women’s Hospital, 75 Francis Street, BC-4, Boston, MA 02115; Elosina@partners.org.
Current author addresses and author contributions are available at www.annals.org.
Current Author Addresses: Drs. Losina and Katz: Department of Orthopaedic Surgery, Orthopaedic and Arthritis Center for Outcomes Research, Brigham and Women’s Hospital, 75 Francis Street, BC-4, Boston, MA 02115.
Dr. Walensky: Division of General Medicine, Massachusetts General Hospital, 50 Staniford Street, 9th Floor, Boston, MA 02114.
Mr. Reichmann, Ms. Holt, Ms. Gerlovin, and Mr. Weinstein: Orthopaedic and Arthritis Center for Outcomes Research, Brigham and Women’s Hospital, 75 Francis Street, BC-4, Boston, MA 02115.
Dr. Solomon: Division of Rheumatology, Brigham and Women’s Hospital, 75 Francis Street, PBB-B3, Boston, MA 02115.
Dr. Jordan: Thurston Arthritis Research Center, University of North Carolina, 3300 Doc J. Thurston Jr. Building, CB #7280, Chapel Hill, NC 27599-7280.
Dr. Hunter: Rheumatology Department, Royal North Shore Hospital and Northern Clinical School, University of Sydney, Sydney, New South Wales, Australia.
Dr. Suter: Section of Rheumatology, Department of Internal Medicine, Yale University School of Medicine, 300 Cedar Street, Room TAC S541, PO Box 208031, New Haven, CT 06520-8031.
Dr. Paltiel: Department of Epidemiology and Public Health, Yale School of Medicine, 60 College Street, New Haven, CT 06520-8034.
Author Contributions: Conception and design: E. Losina, R.P. Walensky, W.M. Reichmann, D.H. Solomon, J.M. Jordan, D.J. Hunter, J.N. Katz.
Analysis and interpretation of the data: E. Losina, R.P. Walensky, H.L. Holt, H. Gerlovin, L.G. Suter, A.M. Weinstein, J.N. Katz.
Drafting of the article: E. Losina, R.P. Walensky, H.L. Holt, H. Gerlovin, L.G. Suter, A.M. Weinstein, J.N. Katz.
Critical revision of the article for important intellectual content: E. Losina, R.P. Walensky, W.M. Reichmann, D.H. Solomon, J.M. Jordan, D.J. Hunter, L.G. Suter, A.D. Paltiel, J.N. Katz.
Final approval of the article: E. Losina, R.P. Walensky, W.M. Reichmann, H. Gerlovin, J.M. Jordan, D.J. Hunter, L.G. Suter, A.M. Weinstein, A.D. Paltiel, J.N. Katz.
Provision of study materials or patients: J.M. Jordan.
Statistical expertise: E. Losina, W.M. Reichmann.
Obtaining of funding: E. Losina.
Administrative, technical, or logistic support: H.L. Holt, H. Gerlovin, D.H. Solomon, A.M. Weinstein, J.N. Katz.
Collection and assembly of data: E. Losina, W.M. Reichmann, H.L. Holt, A.M. Weinstein, J.N. Katz.
References
- 1.Abbate LM, Stevens J, Schwartz TA, Renner JB, Helmick CG, Jordan JM. Anthropometric measures, body composition, body fat distribution, and knee osteoarthritis in women. Obesity (Silver Spring) 2006;14:1274–81. doi: 10.1038/oby.2006.145. [PMID: 16899809] [DOI] [PubMed] [Google Scholar]
- 2.Cooper C, Snow S, McAlindon TE, Kellingray S, Stuart B, Coggon D, et al. Risk factors for the incidence and progression of radiographic knee osteoarthritis. Arthritis Rheum. 2000;43:995–1000. doi: 10.1002/1529-0131(200005)43:5<995::AID-ANR6>3.0.CO;2-1. [PMID: 10817551] [DOI] [PubMed] [Google Scholar]
- 3.Adams KF, Schatzkin A, Harris TB, Kipnis V, Mouw T, Ballard-Barbash R, et al. Overweight, obesity, and mortality in a large prospective cohort of persons 50 to 71 years old. N Engl J Med. 2006;355:763–78. doi: 10.1056/NEJMoa055643. [PMID: 16926275] [DOI] [PubMed] [Google Scholar]
- 4.Felson DT, Anderson JJ, Naimark A, Walker AM, Meenan RF. Obesity and knee osteoarthritis. The Framingham Study. Ann Intern Med. 1988;109:18–24. doi: 10.7326/0003-4819-109-1-18. [PMID: 3377350] [DOI] [PubMed] [Google Scholar]
- 5.Fontaine KR, Redden DT, Wang C, Westfall AO, Allison DB. Years of life lost due to obesity. JAMA. 2003;289:187–93. doi: 10.1001/jama.289.2.187. [PMID: 12517229] [DOI] [PubMed] [Google Scholar]
- 6.Dillon CF, Rasch EK, Gu Q, Hirsch R. Prevalence of knee osteoarthritis in the United States: arthritis data from the Third National Health and Nutrition Examination Survey 1991-94. J Rheumatol. 2006;33:2271–9. [PMID: 17013996] [PubMed] [Google Scholar]
- 7.Davis MA, Ettinger WH, Neuhaus JM, Hauck WW. Sex differences in osteoarthritis of the knee. The role of obesity. Am J Epidemiol. 1988;127:1019–30. doi: 10.1093/oxfordjournals.aje.a114878. [PMID: 3358403] [DOI] [PubMed] [Google Scholar]
- 8.Boult C, Kane RL, Louis TA, Boult L, McCaffrey D. Chronic conditions that lead to functional limitation in the elderly. J Gerontol. 1994;49:M28–36. doi: 10.1093/geronj/49.1.m28. [PMID: 8282978] [DOI] [PubMed] [Google Scholar]
- 9.Todd Miller M, Lavie CJ, White CJ. Impact of obesity on the pathogenesis and prognosis of coronary heart disease. J Cardiometab Syndr. 2008;3:162–7. doi: 10.1111/j.1559-4572.2008.00004.x. [PMID: 18983333] [DOI] [PubMed] [Google Scholar]
- 10.Das UN. Obesity and its relationship to coronary heart disease [Letter] Eur Heart J. 2007;28:2953–4. doi: 10.1093/eurheartj/ehm472. [PMID: 17962397] [DOI] [PubMed] [Google Scholar]
- 11.Mann DM, Lee J, Liao Y, Natarajan S. Independent effect and population impact of obesity on fatal coronary heart disease in adults. Prev Med. 2006;42:66–72. doi: 10.1016/j.ypmed.2005.09.011. [PMID: 16297443] [DOI] [PubMed] [Google Scholar]
- 12.Shirai K. Obesity as the core of the metabolic syndrome and the management of coronary heart disease. Curr Med Res Opin. 2004;20:295–304. doi: 10.1185/030079903125003008. [PMID: 15025838] [DOI] [PubMed] [Google Scholar]
- 13.Field AE, Coakley EH, Must A, Spadano JL, Laird N, Dietz WH, et al. Impact of overweight on the risk of developing common chronic diseases during a 10-year period. Arch Intern Med. 2001;161:1581–6. doi: 10.1001/archinte.161.13.1581. [PMID: 11434789] [DOI] [PubMed] [Google Scholar]
- 14.Lean ME, Han TS, Seidell JC. Impairment of health and quality of life using new US federal guidelines for the identification of obesity. Arch Intern Med. 1999;159:837–43. doi: 10.1001/archinte.159.8.837. [PMID: 10219929] [DOI] [PubMed] [Google Scholar]
- 15.Muennig P, Lubetkin E, Jia H, Franks P. Gender and the burden of disease attributable to obesity. Am J Public Health. 2006;96:1662–8. doi: 10.2105/AJPH.2005.068874. [PMID: 16873748] [DOI] [PMC free article] [PubMed] [Google Scholar]
- 16.Must A, Spadano J, Coakley EH, Field AE, Colditz G, Dietz WH. The disease burden associated with overweight and obesity. JAMA. 1999;282:1523–9. doi: 10.1001/jama.282.16.1523. [PMID: 10546691] [DOI] [PubMed] [Google Scholar]
- 17.Walter S, Kunst A, Mackenbach J, Hofman A, Tiemeier H. Mortality and disability: the effect of overweight and obesity. Int J Obes (Lond) 2009;33:1410–8. doi: 10.1038/ijo.2009.176. [PMID: 19786964] [DOI] [PubMed] [Google Scholar]
- 18.Dominick KL, Ahern FM, Gold CH, Heller DA. Health-related quality of life among older adults with arthritis. Health Qual Life Outcomes. 2004;2:5. doi: 10.1186/1477-7525-2-5. [PMID: 14720300] [DOI] [PMC free article] [PubMed] [Google Scholar]
- 19.Mathers CD, Stein C, Fat DM, Rao C, Inoue M, Tomijima N, et al. Global Programme on Evidence for Health Policy Discussion. World Health Organization; Geneva: 2002. Global Burden of Disease 2000: Version 2 methods and results. [Google Scholar]
- 20.Parmet S, Lynm C, Glass RM. JAMA patient page. Osteoarthritis of the knee. JAMA. 2003;289:1068. doi: 10.1001/jama.289.8.1068. [PMID: 12597762] [DOI] [PubMed] [Google Scholar]
- 21.Anderson JJ, Felson DT. Factors associated with osteoarthritis of the knee in the first national Health and Nutrition Examination Survey (HANES I). Evidence for an association with overweight, race, and physical demands of work. Am J Epidemiol. 1988;128:179–89. doi: 10.1093/oxfordjournals.aje.a114939. [PMID: 3381825] [DOI] [PubMed] [Google Scholar]
- 22.Jordan JM, Helmick CG, Renner JB, Luta G, Dragomir AD, Woodard J, et al. Prevalence of knee symptoms and radiographic and symptomatic knee osteoarthritis in African Americans and Caucasians: the Johnston County Osteoarthritis Project. J Rheumatol. 2007;34:172–80. [PMID: 17216685] [PubMed] [Google Scholar]
- 23.Zhang Y, Jordan JM. Epidemiology of osteoarthritis. Clin Geriatr Med. 2010;26:355–69. doi: 10.1016/j.cger.2010.03.001. [PMID: 20699159] [DOI] [PMC free article] [PubMed] [Google Scholar]
- 24.Wang Y, Beydoun MA. The obesity epidemic in the United States—gender, age, socioeconomic, racial/ethnic, and geographic characteristics: a systematic review and meta-regression analysis. Epidemiol Rev. 2007;29:6–28. doi: 10.1093/epirev/mxm007. [PMID: 17510091] [DOI] [PubMed] [Google Scholar]
- 25.Felson DT. The epidemiology of knee osteoarthritis: results from the Framingham Osteoarthritis Study. Semin Arthritis Rheum. 1990;20:42–50. doi: 10.1016/0049-0172(90)90046-i. [PMID: 2287948] [DOI] [PubMed] [Google Scholar]
- 26.Rothman AJ, Bartels RD, Wlaschin J, Salovey P. The strategic use of gain- and loss-framed messages to promote healthy behavior: how theory can inform practice. J Commun. 2006;56:S202–20. [Google Scholar]
- 27.Kreuter MW, Lukwago SN, Bucholtz RD, Clark EM, Sanders-Thompson V. Achieving cultural appropriateness in health promotion programs: targeted and tailored approaches. Health Educ Behav. 2003;30:133–46. doi: 10.1177/1090198102251021. [PMID: 12693519] [DOI] [PubMed] [Google Scholar]
- 28.Brazier J, Usherwood T, Harper R, Thomas K. Deriving a preference-based single index from the UK SF-36 Health Survey. J Clin Epidemiol. 1998;51:1115–28. doi: 10.1016/s0895-4356(98)00103-6. [PMID: 9817129] [DOI] [PubMed] [Google Scholar]
- 29.Bender R, Jöckel KH, Trautner C, Spraul M, Berger M. Effect of age on excess mortality in obesity. JAMA. 1999;281:1498–504. doi: 10.1001/jama.281.16.1498. [PMID: 10227319] [DOI] [PubMed] [Google Scholar]
- 30.Ammar KA, Redfield MM, Mahoney DW, Johnson M, Jacobsen SJ, Rodeheffer RJ. Central obesity: association with left ventricular dysfunction and mortality in the community. Am Heart J. 2008;156:975–81. doi: 10.1016/j.ahj.2008.06.018. [PMID: 19061715] [DOI] [PMC free article] [PubMed] [Google Scholar]
- 31.Nguyen NT, Magno CP, Lane KT, Hinojosa MW, Lane JS. Association of hypertension, diabetes, dyslipidemia, and metabolic syndrome with obesity: findings from the National Health and Nutrition Examination Survey, 1999 to 2004. J Am Coll Surg. 2008;207:928–34. doi: 10.1016/j.jamcollsurg.2008.08.022. [PMID: 19183541] [DOI] [PubMed] [Google Scholar]
- 32.Mathias SD, Williamson CL, Colwell HH, Cisternas MG, Pasta DJ, Stolshek BS, et al. Assessing health-related quality-of-life and health state preference in persons with obesity: a validation study. Qual Life Res. 1997;6:311–22. doi: 10.1023/a:1018475108460. [PMID: 9248313] [DOI] [PubMed] [Google Scholar]
- 33.Zhang W, Moskowitz RW, Nuki G, Abramson S, Altman RD, Arden N, et al. OARSI recommendations for the management of hip and knee osteoarthritis, Part II: OARSI evidence-based, expert consensus guidelines. Osteoarthritis Cartilage. 2008;16:137–62. doi: 10.1016/j.joca.2007.12.013. [PMID: 18279766] [DOI] [PubMed] [Google Scholar]
- 34.Dieppe P, Basler HD, Chard J, Croft P, Dixon J, Hurley M, et al. Knee replacement surgery for osteoarthritis: effectiveness, practice variations, indications and possible determinants of utilization. Rheumatology (Oxford) 1999;38:73–83. doi: 10.1093/rheumatology/38.1.73. [PMID: 10334686] [DOI] [PubMed] [Google Scholar]
- 35.Quintana JM, Escobar A, Arostegui I, Bilbao A, Azkarate J, Goenaga JI, et al. Health-related quality of life and appropriateness of knee or hip joint replacement. Arch Intern Med. 2006;166:220–6. doi: 10.1001/archinte.166.2.220. [PMID: 16432092] [DOI] [PubMed] [Google Scholar]
- 36.Centers for Disease Control and Prevention . National Health and Nutrition Examination Survey Data, 2005-2006. Centers for Disease Control and Prevention; Hyattsville, MD: 2006. [Google Scholar]
- 37.Centers for Disease Control and Prevention . National Health and Nutrition Examination Survey Data, 2007-2008. Centers for Disease Control and Prevention; Hyattsville, MD: 2008. [Google Scholar]
- 38.Centers for Disease Control and Prevention. National Center for Health Statistics Health Data Interactive. Chronic conditions, ages 18+: US, 1997-2008. Accessed at www.cdc.gov/nchs/hdi.htm on 15 November 2010.
- 39.Annual Estimates of the Hispanic, White, and Black Resident Populations by Sex and Age for the United States: 1 April 2000 to 1 July 2009 (NC-EST2009-04-HISP/WANH/BA) June 2010 edition. U.S. Census Bureau, Population Division; Accessed at www.census.gov/popest/national/asrh/NC-EST2009-asrh.html on 15 November 2010. [Google Scholar]
- 40.Oliveria SA, Felson DT, Reed JI, Cirillo PA, Walker AM. Incidence of symptomatic hand, hip, and knee osteoarthritis among patients in a health maintenance organization. Arthritis Rheum. 1995;38:1134–41. doi: 10.1002/art.1780380817. [PMID: 7639811] [DOI] [PubMed] [Google Scholar]
- 41.Niu J, Zhang YQ, Torner J, Nevitt M, Lewis CE, Aliabadi P, et al. Is obesity a risk factor for progressive radiographic knee osteoarthritis? Arthritis Rheum. 2009;61:329–35. doi: 10.1002/art.24337. [PMID: 19248122] [DOI] [PMC free article] [PubMed] [Google Scholar]
- 42.Lawrence RC, Felson DT, Helmick CG, Arnold LM, Choi H, Deyo RA, et al. National Arthritis Data Workgroup Estimates of the prevalence of arthritis and other rheumatic conditions in the United States. Part II. Arthritis Rheum. 2008;58:26–35. doi: 10.1002/art.23176. [PMID: 18163497] [DOI] [PMC free article] [PubMed] [Google Scholar]
- 43.Reichmann WM, Katz JN, Kessler CL, Jordan JM, Losina E. Determinants of self-reported health status in a population-based sample of persons with radiographic knee osteoarthritis. Arthritis Rheum. 2009;61:1046–53. doi: 10.1002/art.24839. [PMID: 19644892] [DOI] [PMC free article] [PubMed] [Google Scholar]
- 44.Diehr P, Patrick DL, Spertus J, Kiefe CI, McDonell M, Fihn SD. Transforming self-rated health and the SF-36 scales to include death and improve interpretability. Med Care. 2001;39:670–80. doi: 10.1097/00005650-200107000-00004. [PMID: 11458132] [DOI] [PubMed] [Google Scholar]
- 45.Torrance GW, Feeny DH, Furlong WJ, Barr RD, Zhang Y, Wang Q. Multiattribute utility function for a comprehensive health status classification system. Health Utilities Index Mark 2. Med Care. 1996;34:702–22. doi: 10.1097/00005650-199607000-00004. [PMID: 8676608] [DOI] [PubMed] [Google Scholar]
- 46.Keyfitz N, Frauenthal J. An improved life table method. Biometrics. 1975;31:889–99. [PMID: 1203430] [PubMed] [Google Scholar]
- 47.Calle EE, Thun MJ, Petrelli JM, Rodriguez C, Heath CW., Jr. Body-mass index and mortality in a prospective cohort of U.S. adults. N Engl J Med. 1999;341:1097–105. doi: 10.1056/NEJM199910073411501. [PMID: 10511607] [DOI] [PubMed] [Google Scholar]
- 48.Flegal KM, Carroll MD, Ogden CL, Curtin LR. Prevalence and trends in obesity among US adults, 1999-2008. JAMA. 2010;303:235–41. doi: 10.1001/jama.2009.2014. [PMID: 20071471] [DOI] [PubMed] [Google Scholar]
- 49.Finley CE, Barlow CE, Greenway FL, Rock CL, Rolls BJ, Blair SN. Retention rates and weight loss in a commercial weight loss program. Int J Obes (Lond) 2007;31:292–8. doi: 10.1038/sj.ijo.0803395. [PMID: 16755283] [DOI] [PubMed] [Google Scholar]
- 50.Harvey EL, Glenny AM, Kirk SF, Summerbell CD. An updated systematic review of interventions to improve health professionals’ management of obesity. Obes Rev. 2002;3:45–55. doi: 10.1046/j.1467-789x.2002.00053.x. [PMID: 12119659] [DOI] [PubMed] [Google Scholar]
- 51.Lloyd A, Nafees B, Narewska J, Dewilde S, Watkins J. Health state utilities for metastatic breast cancer. Br J Cancer. 2006;95:683–90. doi: 10.1038/sj.bjc.6603326. [PMID: 16967055] [DOI] [PMC free article] [PubMed] [Google Scholar]
- 52.McLernon DJ, Dillon J, Donnan PT. Health-state utilities in liver disease: a systematic review. Med Decis Making. 2008;28:582–92. doi: 10.1177/0272989X08315240. [PMID: 18424560] [DOI] [PubMed] [Google Scholar]
- 53.Winkelmayer WC, Benner JS, Glynn RJ, Schneeweiss S, Wang PS, Brookhart MA, et al. Assessing health state utilities in elderly patients at cardio-vascular risk. Med Decis Making. 2006;26:247–54. doi: 10.1177/0272989X06288685. [PMID: 16751323] [DOI] [PubMed] [Google Scholar]
- 54.Peeters A, Barendregt JJ, Willekens F, Mackenbach JP, Al Mamun A, Bonneux L, NEDCOM, the Netherlands Epidemiology and Demography Compression of Morbidity Research Group Obesity in adulthood and its consequences for life expectancy: a life-table analysis. Ann Intern Med. 2003;138:24–32. doi: 10.7326/0003-4819-138-1-200301070-00008. [PMID: 12513041] [DOI] [PubMed] [Google Scholar]
- 55.Heo M, Allison DB, Faith MS, Zhu S, Fontaine KR. Obesity and quality of life: mediating effects of pain and comorbidities. Obes Res. 2003;11:209–16. doi: 10.1038/oby.2003.33. [PMID: 12582216] [DOI] [PubMed] [Google Scholar]
- 56.Sach TH, Barton GR, Doherty M, Muir KR, Jenkinson C, Avery AJ. The relationship between body mass index and health-related quality of life: comparing the EQ-5D, EuroQol VAS and SF-6D. Int J Obes (Lond) 2007;31:189–96. doi: 10.1038/sj.ijo.0803365. [PMID: 16682976] [DOI] [PubMed] [Google Scholar]
- 57.Felson DT, Zhang Y, Hannan MT, Naimark A, Weissman B, Aliabadi P, et al. Risk factors for incident radiographic knee osteoarthritis in the elderly: the Framingham Study. Arthritis Rheum. 1997;40:728–33. doi: 10.1002/art.1780400420. [PMID: 9125257] [DOI] [PubMed] [Google Scholar]
- 58.Woolf AD, Pfleger B. Burden of major musculoskeletal conditions. Bull World Health Organ. 2003;81:646–56. [PMID: 14710506] [PMC free article] [PubMed] [Google Scholar]
- 59.Sowers M, Lachance L, Hochberg M, Jamadar D. Radiographically defined osteoarthritis of the hand and knee in young and middle-aged African American and Caucasian women. Osteoarthritis Cartilage. 2000;8:69–77. doi: 10.1053/joca.1999.0273. [PMID: 10772235] [DOI] [PubMed] [Google Scholar]
- 60.Michaud CM, McKenna MT, Begg S, Tomijima N, Majmudar M, Bulzacchelli MT, et al. The burden of disease and injury in the United States 1996. Popul Health Metr. 2006;4:11. doi: 10.1186/1478-7954-4-11. [PMID: 17049081] [DOI] [PMC free article] [PubMed] [Google Scholar]
- 61.Arias E. National vital statistics reports. Vol. 58. National Center for Health Statistics; Hyattsville, MD: 2010. United States life tables, 2006. [PubMed] [Google Scholar]
- 62.Grotle M, Hagen KB, Natvig B, Dahl FA, Kvien TK. Obesity and osteoarthritis in knee, hip and/or hand: an epidemiological study in the general population with 10 years follow-up. BMC Musculoskelet Disord. 2008;9:132. doi: 10.1186/1471-2474-9-132. [PMID: 18831740] [DOI] [PMC free article] [PubMed] [Google Scholar]
- 63.Blagojevic M, Jinks C, Jeffery A, Jordan KP. Risk factors for onset of osteoarthritis of the knee in older adults: a systematic review and meta-analysis. Osteoarthritis Cartilage. 2010;18:24–33. doi: 10.1016/j.joca.2009.08.010. [PMID: 19751691] [DOI] [PubMed] [Google Scholar]
Associated Data
This section collects any data citations, data availability statements, or supplementary materials included in this article.