Abstract
In this study, a new method for the estimation of aeolian sand transport rate was developed; the method employs a ceramic sand flux sensor (UD-101). UD-101 detects wind-blown sand impacting on its surface. The method was devised by considering the results of wind tunnel experiments that were performed using a vertical sediment trap and the UD-101. Field measurements to evaluate the estimation accuracy during the prevalence of unsteady winds were performed on a flat backshore. The results showed that aeolian sand transport rates estimated using the developed method were of the same order as those estimated using the existing method for high transport rates, i.e., for transport rates greater than 0.01 kg m−1 s−1.
Keywords: piezoelectric sensor, impact counts, wind-blown sand transport, instantaneous sand transport, moisture content
1. Introduction
Aeolian sand transport is an important process that is studied in many fields such as physics, geosciences, agriculture, and coastal engineering. Considerable effort has been devoted to understanding sand transport mechanisms, including the aerodynamic entrainment of sand grains, acceleration of sand grains in air streams, and transport of sand by steady winds [1–16].
Aeolian sand transport mechanisms observed in the field under unsteady wind conditions differ significantly from those observed under steady wind conditions. Since the 1990s, high-frequency sampling systems such as piezoelectric mass flux sensors [17–22], high-temporal-resolution sediment traps [23–27], and microphonic flux sensors [28] have been employed for the detection of aeolian sand flux at frequencies of several hundreds of hertz and higher. Wind tunnel and field experiments performed using these systems have improved our understanding of sand transport mechanisms under unsteady wind conditions. However, further investigations are required, especially under complex field conditions.
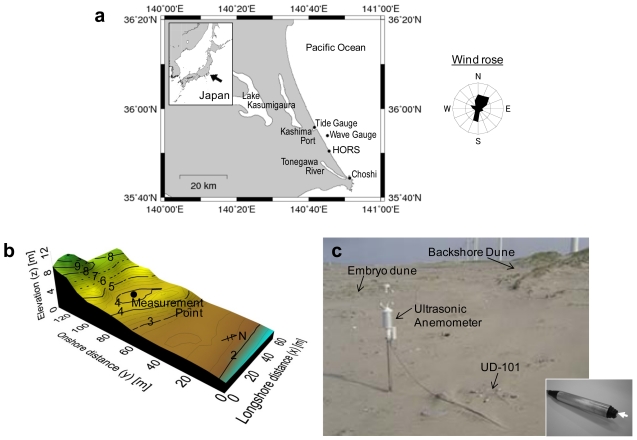
The ceramic sand flux sensor UD-101 (Chuo Kosoku), which is a piezoelectric sand flux sensor that can measure the flux of aeolian sand impacting on its surface, was developed by Kubota et al. [29,30] (see Figure 5c). The sensor detects piezoelectric signals generated by collisions between aeolian sand grains and the sensor surface using the same principle as that employed in Sensit [17] and Safires [19]. A significant difference between UD-101 and the other piezoelectric sensors is that UD-101 is unidirectional and does not self-orient toward the wind direction, while both Sensit and Safires are omnidirectional. However, UD-101 has the following advantages over the other piezoelectric sensors:
Figure 5.
(a) Location of the study site (Hasaki Oceanographical Research Station, HORS) and the wind rose for 2004. (b) Topography of the Hasaki Beach and the location of the measurement point. The cross-shore distance to the average annual shoreline is 0 m; the offshore direction was considered positive. (c) Location of the measurement point on 17 January 2005. The ultrasonic anemometer and ceramic sand flux sensors were installed as shown. The four UD-101 sensors were oriented toward the north, east, south, and west directions.
The sensor is calibrated by performing both wind tunnel and field experiments.
The sensor records an impact value of 0 or 1 at 10 kHz; it samples once per second, and theoretically, it can detect a maximum of 10,000 impact counts in the sampling interval, i.e., the sensor has high temporal resolution.
The sensor is relatively inexpensive.
Udo et al. [22] carried out short-term field observations at the Hasaki Beach in Japan using UD-101 during the period 12–16 January 2005. The following features were inferred from the UD-101 data:
During periods without rainfall and in the presence of longshore winds (conditions similar to those employed in wind tunnel experiments), the aeolian sand flux at a certain height above a flat ground surface increased significantly with the wind velocity and approximately equaled the flux estimated in wind tunnel experiments using Kawamura's [3] equation.
The flux decreased significantly with an increase in precipitation, i.e., with an increase in the moisture content of the sand surface; however, even during periods with rainfall, flux was detected during strong wind conditions.
The flux increased with a decrease in the angle between the sensor direction and wind direction.
Further, Udo [31] carried out relatively long-term observations during the period from April 2005 to January 2006 at the Hasaki Beach and showed that a large amount of sand was transported during typhoons. This result implies that UD-101 can be employed for performing long-term flux measurements even during storm events. As the next step toward making long-term flux measurements in fields possible, it is necessary to develop a measurement method for not only the aeolian sand flux at a certain height above the ground surface but also the aeolian sand transport rate (e.g., the total aeolian sand flux between the ground surface and the maximum height of the aeolian sand layer). In particular, the accurate estimation of the rate of seasonal, yearly, or decadal sediment transport due to both littoral drift and aeolian transport at beaches would be invaluable for coastal management. However, the aeolian transport rates estimated by most researchers have not been validated because of the lack of practical estimation/measurement methods; examples of such estimations are estimations made by using conventional equations along with the mean wind data [32] or by integrating areas of beach morphological changes from a boundary under the assumption that the sand transport rate at the boundary is zero [33].
The objective of this study was to develop a new method employing UD-101 for the estimation of the aeolian sand transport rate [29,30]. We applied the method to field data obtained during the period from 22 September to 6 December 2005 [31] and assessed the estimation accuracy to examine the suitability of the method for the direct estimation of long-term transport rates in the field.
2. New Estimation Method for Determining Total Aeolian Sand Flux
2.1. Characteristics of UD-101 Data
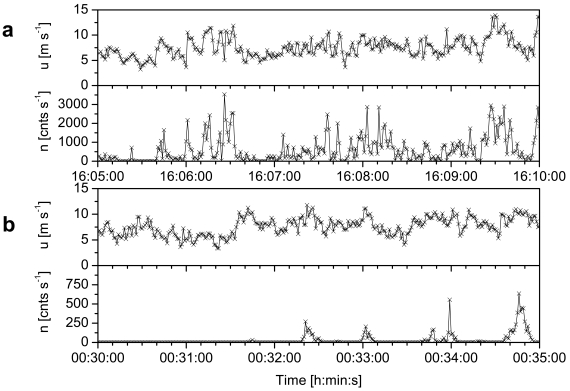
Figure 1 shows a time series of the instantaneous horizontal wind velocity u and blown-sand impact count n measured at the Hasaki Beach; the median sand grain size d50 at the beach was 0.2 × 10⁻³ m [22,31]. n shows a positive relationship with u during periods without any rainfall, but decreases significantly after a rainfall event. The sensor cannot detect the impact of blown sand if wet sand adheres to its surface after a rainfall event; however, it can detect the impact if this sand is subsequently removed by heavy rainfall. The sensor does not detect the impact of raindrops.
Figure 1.
Time series of instantaneous horizontal wind velocity u and blown-sand impact count n at the Hasaki Beach [22,31]; the data were recorded for 5 min at a frequency of 1 Hz (a) during intervals without rainfall on 12 January 2005 and (b) after a rainfall event on 25 September 2005. The wind velocity was measured using an ultrasonic anemometer at a height of 0.9 m above the flat ground surface (zu = 0.9 m). The impact count was measured using UD-101 at zs = 0.04 m. The horizontal distance between the wind and saltation sensors was 1 m. The median sand grain size d50 of the ground surface at the beach was 0.2 × 10⁻³ m.
Many studies have shown that the vertical wind velocity profile in a wind tunnel is logarithmic [34,35]. In previous studies, the threshold wind velocity ut has been estimated from both a wind profile law and Bagnold's [1] equation. The logarithmic wind profile law is expressed as:
| (1) |
Here, u∗ is the wind shear velocity, κ is the von Kármán constant (= 0.4), zu is the height at which u is measured, and z0s is the saltation roughness length. Saltation is the hopping motion of sand grains and the primary mode of aeolian sand transport in beach intertidal and supratidal zones. Aeolian sand transport leads to an increase in the aerodynamic roughness length. ut is obtained by substituting u∗ = u∗t in Equation (1). The threshold wind shear velocity u∗t is estimated from Bagnold's [1] equation:
| (2) |
where a is the numerical transport rate coefficient (= 0.1), ρ is the air density, σ is the sand density (= 2,650 kg m−3), g is the gravitational acceleration, and d is the sand grain size. z0s is estimated from the relation proposed by Charnock [36] and Chamberlain [37]:
| (3) |
where c0 is a constant (= 0.16 for saltation on beaches [38]).
2.2. Relationship between Impact Counts and Aeolian Sand Flux at a Measurement Height
Kubota et al. [30] performed experiments in a 20-m-long wind tunnel using the experimental setup that was employed by Hotta et al. [39]; the sand used in the experiments had a d50 value of 0.25 × 10⁻³ m. The authors showed that the impact counts approached a constant value asymptotically at frequencies greater than 8 kHz. They also compared the sand mass flux qs measured in the wind tunnel using an 8-kHz sensor [30] with q measured using a vertical-distribution-type sand trap [39]. qs at the measurement height zs was estimated from n using the following equation [22]:
| (4) |
where t0 is the sampling period of n (= 1 s) and ds is the diameter of the sensor (= 0.012 m). The vertical-distribution-type sand trap was developed by Hotta and Horikawa [40], and it can be used to measure the flux at 37 different heights in the range 0–0.505 m. q was corrected for trap efficiency. The wind tunnel experiments performed by Kubota et al. [30] and Hotta et al. [39] showed that qs(zs) for d50 = 0.25 × 10⁻³ m was related to q(zs) measured using the vertical-distribution-type sand trap [22], which was closely approximated as:
| (5) |
2.3. Relationship between Aeolian Sand Flux at a Measurement Height and Total Sand Flux
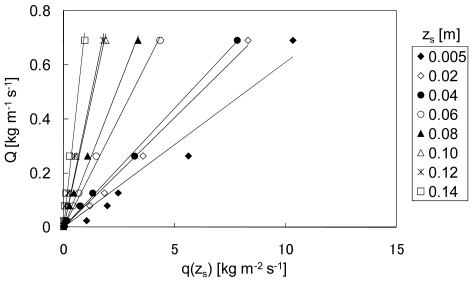
The relationship between the sand flux at zs, q(zs) [kg m−2 s−1], and the total sand flux Q [kg m−1 s−1] is shown in Figure 2. Hotta et al. [39] employed the same wind tunnel as that used by Kubota et al. [30], with 0.17 m s−1 < u∗ < 1.77 m s−1 and 0.14 × 10⁻³ m < d50 < 0.68 × 10⁻³ m. Here, only the data for d50 = 0.25 × 10⁻³ m are shown. Q was found to be approximately proportional to q(zs), as expressed by:
| (6) |
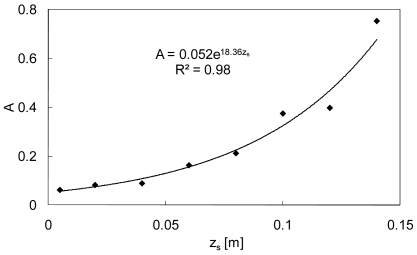
where the regression coefficient R2 of the approximation was 0.96, 0.99, 1.00, 1.00, 0.99, 0.98, 0.97, and 0.97 for zs = 0.005, 0.02, 0.04, 0.06, 0.08, 0.10, 0.12, and 0.14 m, respectively. As shown in Figure 3, the constant A shows a positive relationship with zs, and it can be expressed as:
| (7) |
Figure 2.
Relationship between the sand flux at zs, q(zs), and the total sand flux Q for d50 = 0.25 × 10⁻³ m.
Figure 3.
Relationship between zs and A for d50 = 0.25 × 10⁻³ m.
The relationships between zs and R2 and between zs and A (shown in Figures 2 and 3, respectively) indicate that zs should be set in the range 0.02–0.08.
The constants B and C show a positive relationship with d50 (Figure 4):
| (8) |
and:
| (9) |
Figure 4.
Relationship between (a) d50 and B and (b) d50 and C.
Finally, the following equation is derived from Equations (4)–(9):
| (10) |
This equation suggests that Q can be estimated only if n, d50, and zs are measured by performing field experiments, although the equation was derived from observations made during 20-m-long wind tunnel experiments performed by Hotta et al. [39] and Kubota et al. [30] on a flat ground surface under steady wind conditions with u∗ < 1.8 m s−1 and at a sensor height of 0.005 < zs < 0.14.
3. UD-101 Data Obtained at Hasaki Beach
3.1. Summary of Field Measurements
Field measurements were performed at the Hasaki Beach using UD-101. The beach faces the Pacific Ocean and is located in Ibaraki Prefecture [35°50′25″N, 140°45′42″E; Figure 5(a)] [22,31]. The beach is of the dissipative type and has a foreshore slope ranging from 0.02 to 0.05 and a width of 100 m [Figure 5(b)]. d50 is approximately 0.2 × 10⁻³ m along the backshore. Beach grasses grow around a small embryo dune at y = 50 m and around a longshore dune at y = 70 to 90 m just in front of the coastal forest area, where y is the onshore distance from the average shoreline position in 2004. The measurement point was located in a flat area between the embryo dune and backshore dune.
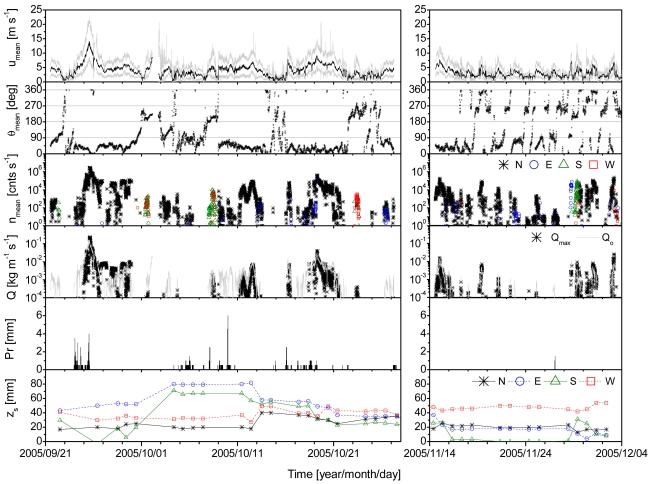
The annual wind direction is predominantly in the north-northeast direction [Figure 5(a)]. Winds are relatively weak in summer, except during typhoons, but strong in winter due to the presence of low-pressure systems. u, the wind direction θ, and n [the same data obtained by Udo [31], Figure 5(c)] were measured from 21 September to 3 December 2005. u and θ were measured at a height of 0.9 m above the measurement point (z = 0.9 m) using a three-axis ultrasonic anemometer (Delta Ohm; model: HD2003), while n was measured at z = 0.04 m using UD-101. Four UD-101 sensors were deployed, and they were directed toward the north, east, south, and west. The wind direction in the horizontal plane is expressed clockwise from north, from 0° to 360°. The data of u, θ, and n were recorded on a data logger system (FieldPoint cFP-2000, National Instruments) at a frequency of 1 Hz and were automatically downloaded on a weekly basis from the logger. The precipitation Pr was measured at 10-min intervals at the Choshi Meteorological Observatory (35°44′18″N, 140°51′24″E) by the Japan Meteorological Agency.
In addition, in this study, zs was measured manually almost every day in order to calculate Q using Equation (10). The instantaneous zs was calculated by linear interpolation. The zs value of the sensor oriented toward the wind direction tended to be large and that of the sensor directed in the opposite direction tended to be small; for example, for north winds, the zs value of the sensor directed northward tended to be large and that of the sensor directed southward tended to be small.
The measurement results are shown in Figure 6. Data could not be obtained from 28 October to 13 November 2005 because of network problems. Large amounts of sand were transported during the transport events on 24–26 September due to the impact of typhoon 0517, which resulted in a total precipitation of 39.5 mm; similar events involving the transport of a large amount of sand occurred on 11–12 October (period without rainfall); on 18–20 October (due to the impact of typhoon 0520), when the total precipitation was 6 mm; and on 14–15 November (period without rainfall) [31].
Figure 6.
Time series of 10-min averages of the horizontal wind velocity umean, horizontal wind direction θmean, blown-sand impact count nmean, estimated total aeolian sand flux Qmean, and precipitation Pr; the time series of QO estimated from Equation (13) and the daily sensor height from the ground surface zs are also shown. The solid gray lines in the top figure show the maximum and minimum instantaneous wind velocities. The wind direction is expressed clockwise from north, from 0° to 360°. Only the maximum nmean for the four directions in each of the 10-min intervals is plotted.
3.2. Evaluation of the Accuracy of the New Method by Comparing Q with QB, QK, QO, and QL
The Q value estimated from n was compared with that obtained using the conventional equations for a constant wind velocity in order to examine the accuracy of Q estimated from the UD-101 data. Here, the commonly employed equations of Bagnold [1], Kawamura [3], Owen [5], and Lettau and Lettau [6] (for QB, QK, QO, and QL, respectively) were used [13,16,41–43]:
| (11) |
| (12) |
| (13) |
| (14) |
Here, D is the reference sand grain diameter (= 0.25 × 10⁻³ m) and cB, cK, cO, and cL are constants with values of 1.8, 2.78, 0.25 + w0/3u∗ (where w0 is the fall velocity), and 4.2, respectively. The sand transport rate was estimated to be zero when u∗ < u∗t. u∗ was estimated from Equation (1) using the measured value of u; u∗t was obtained using Equation (2) and w0 was determined from Rubey's [44] equation:
| (15) |
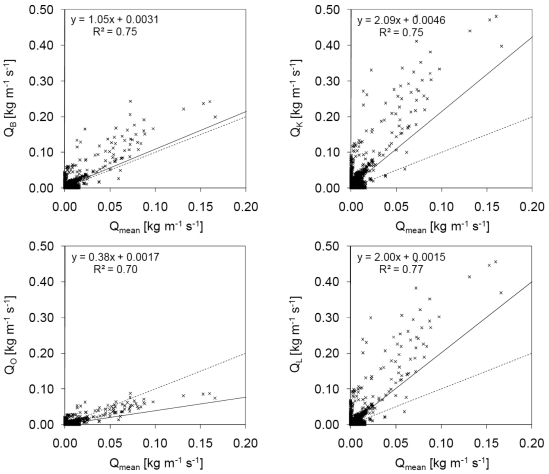
where s is the relative density of the sand (= σ/ρ) and ν is the kinematic viscosity of air. These equations were derived for a constant wind velocity, and hence, Q estimated using the UD-101 data was averaged over 10 min. The 10-min mean sand flux Qmean during periods without rainfall was compared to QB, QK, QO, and QL.
Figure 7 shows a comparison of Qmean values obtained from n with QB, QK, QO, and QL values derived from the equations given above, for periods without rainfall. Data for n = 0 and u∗ < u∗t (i.e., u < 4.05 m s−1) were excluded. Qmean showed a clear positive relationship with QB, QK, QO, and QL, and the estimated values followed the order QO < QB < QL < QK. The best agreement was observed between Qmean and QO when 0.02 < Qmean < 0.10 and between Qmean and QB when Qmean > 0.10.
Figure 7.
Comparison of Qmean estimated from n with QB, QK, QO, and QL estimated using the equations given in the text, when n ≠ 0 or u∗ > u∗t (i.e., u > 4.05 m s−1) during periods without rainfall. The solid line is the linear regression line. The dashed line is the line that would be obtained in case of perfect agreement.
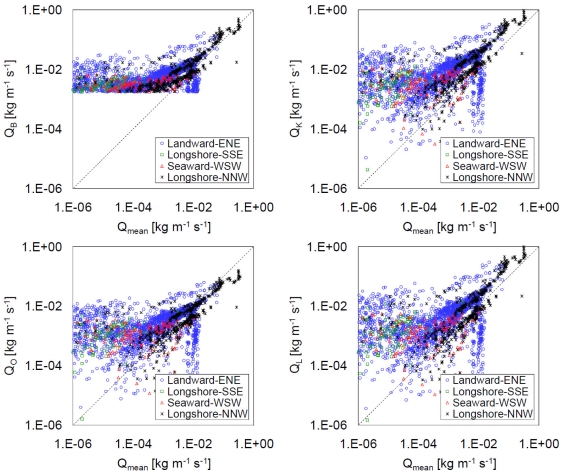
Figure 8 shows double logarithmic plots of Qmean versus QB, QK, QO, and QL for east-northeast (15° < θmean < 105°), south-southeast (105° < θmean < 195°), west-southwest (195° < θmean < 285°), and north-northwest (285° < θmean < 375°) winds. For small Qmean values, i.e., less than 0.01 kg m−1 s−1, the Qmean value was overestimated by QB, QK, QO, and QL. The probable causes for the overestimation are the low measurement accuracy of n for small Qmean, the low estimation accuracy of z0s for small u∗, variations in the wind velocity, and the high moisture content at the beach surface. Raupach [38] showed that c0 in Equation (3) depended on u∗, especially for small u∗. A decrease in the instantaneous wind velocity below the threshold velocity, even when the mean wind velocity is greater than the threshold velocity, can lead to an overestimation. The moisture content of the backshore is nonzero even during periods without rainfall because of the proximity of the backshore to the sea. Udo et al. [22] demonstrated that the sand transport flux at a height, qmean, decreased by more than one order of magnitude when the moisture content increased during rainfall periods.
Figure 8.
Comparison of Qmean estimated from n with QB, QK, QO, and QL for east-northeast (15° < θmean < 105°), south-southeast (105° < θmean < 195°), west-southwest (195° < θmean < 285°), and north-northwest (285° < θmean < 375°) winds. QB is either zero or greater than 1.76 × 10⁻³ kg m−1 s−1 because Equation (11) does not include the term (u∗ – u∗t). The dashed line denotes perfect agreement.
Table 1 lists the linear regression relationships between Qmean estimated from n and QB, QK, QO, and QL for the east-northeast, south-southeast, west-southwest, and north-northwest winds (see Figure 8). While a strong correlation was observed for the north-northwest wind (in the longshore direction), a clear correlation was not observed in the case of the other winds because only a small number of Qmean values were greater than 0.01 kg m−1 s−1. Udo [31] showed the dependency of qmean on θmean and that qmean was high when θmean was in the longshore direction (especially in winter); however, qmean was low when θmean was seaward (in late summer and winter) and was even lower when θmean was landward (in spring and autumn). The differences between Qmean and QB, QK, QO, and QL were found to be independent of θmean.
Table 1.
Linear regression expressions for the relationships between Qmean estimated from n, and QB, QK, QO, and QL for east-northeast, south-southeast, west-southwest, and north-northwest winds. R2 is the regression coefficient and N is the number of data points. See Figure 8 for related plots.
| ENE (N = 2714) | SSE (N = 198) | WSW (N = 557) | NNW (N = 706) | |
|---|---|---|---|---|
| QB | 1.231Qmean + 0.003 (R2 = 0.33) |
−0.242Qmean + 0.002 (R2 = 0.08) |
−0.180Qmean + 0.003 (R2 = 0.01) |
1.047Qmean + 0.004 (R2 = 0.82) |
| QK | 2.548Qmean + 0.004 (R2 = 0.34) |
−0.225Qmean + 0.002 (R2 = 0.03) |
−0.304Qmean + 0.005 (R2 = 0.01) |
2.075Qmean + 0.008 (R2 = 0.82) |
| QO | 0.545Qmean + 0.001 (R2 = 0.32) |
−0.076Qmean + 0.001 (R2 = 0.03) |
−0.079Qmean + 0.001 (R2 = 0.01) |
0.369Qmean + 0.002 (R2 = 0.81) |
| QL | 2.091Qmean + 0.001 (R2 = 0.34) |
−0.094Qmean + 0.001 (R2 = 0.02) |
−0.200Qmean + 0.003 (R2 = 0.01) |
1.997Qmean + 0.003 (R2 = 0.82) |
Hotta and Horikawa [40] performed field experiments at beaches by using a trench-type trap and a vertical-distribution-type trap to estimate the aeolian sand transport rate and showed that the possible ranges of cB and cK are 0.5−2.0 and 1.0–3.0, respectively. This result suggests that the actual values of QB and QK are possibly one-third of those shown in Figures 7 and 8. All the field results showed that the sand transport rate estimated using the new method together with the UD-101 data was of the same order as that estimated using the conventional equations, although several differences were observed between the aeolian sand transport rate in the wind tunnel and that in field experiments [38,40,45,46]. The new method is useful for the direct estimation of the sand transport rate in a field analysis. Further analysis using the UD-101 data can provide additional insights into aeolian sand transport mechanisms in fields.
4. Conclusions
In this study, we developed a new method for the estimation of the aeolian sand transport rate and demonstrated the usefulness of UD-101 for field measurements of the aeolian sand transport rate. The transport rates estimated from the UD-101 data were reasonable and showed a clear positive relationship with the rates estimated using the conventional equations. Further, for Qmean > 0.01 kg m−1 s−1, the transport rates estimated using the UD-101 data were of the same order as those estimated using the conventional equations. The best agreement was observed between Qmean and QO when 0.02 < Qmean < 0.10 and between Qmean and QB when Qmean > 0.10. It is necessary to develop a method for accurately determining the constant values in the conventional equations. The cause for the disagreement between Qmean and QB, QK, QO, and QL for small Qmean should be investigated in a future research. In field analyses, the estimation of large transport rates under strong winds is important and the proposed estimation method is expected to be useful in obtaining the transport rate.
Acknowledgments
The author would like to thank Shintaro Hotta and Susumu Kubota, Nihon University, Japan, for providing the sand flux sensor data used in this study. The author also appreciates the support provided by the Littoral Drift Division, Port and Airport Research Institute, Japan, during field observations. The offshore wave and tide data were provided by the Port and Airport Research Institute and the Kashima Port Construction Office of the Ministry of Land, Infrastructure and Transport (Japan), respectively. Two anonymous reviewers are acknowledged for helpful comments on the manuscript. This research was funded by the Ministry of Education, Culture, Sports, Science and Technology through a Grant-in-Aid for Young Scientists (B, #16760417).
References and Notes
- 1.Bagnold R.A. The Physics of Blown Sand and Desert Dunes. Methuen; London, UK: 1941. p. 265. [Google Scholar]
- 2.Chepil W. Dynamics of wind erosion. II: initiation of soil movement. Soil Sci. 1945;6:397–411. [Google Scholar]
- 3.Kawamura R. Study of sand movement by wind. Univ. Tokyo, Rep. Inst. Sci. Technol. 1951;5:95–112. (in Japanese) [Google Scholar]
- 4.Zingg A.W. Wind tunnel studies of the movement of sedimentary material. In: McNown J.S., Boyer M.C., editors. Proceedings of 5th Hydraulic Conference; Iowa City, IA, USA. Iowa Institute of Hydraulic Research, State University of Iowa; 1953. pp. 111–135. [Google Scholar]
- 5.Owen P.R. Saltation of uniform grains in air. J. Fluid Mech. 1964;20:225–242. [Google Scholar]
- 6.Letau K., Lettau H.H. Experimental and micrometeorological field studies of dune migration. In: Lettau H.H., Lettau K., editors. Exploring the World's Driest Climates. Institute of Environmental Science Report 101, Center for Climatic Research, University of Wisconsin; Madison, WI, USA: 1978. pp. 110–147. [Google Scholar]
- 7.White B.R. Soil transport by winds on Mars. J. Geophys. Res. 1979;84:4643–4651. [Google Scholar]
- 8.Iversen J.D., White B.R. Saltation threshold on Earth, Mars and Venus. Sedimentology. 1982;29:111–119. [Google Scholar]
- 9.Unger J.E., Haff P.K. Steady state saltation in air. Sedimentology. 1987;34:289–299. [Google Scholar]
- 10.Werner B.T. A steady-state model of wind-blown sand transport. J. Geol. 1990;98:1–17. [Google Scholar]
- 11.Anderson R.S., Haff P.K. Wind modification and bed response during saltation of sand in air. Acta Mech. 1991;1:21–51. [Google Scholar]
- 12.Shao Y., Raupach M.R. The overshoot and equilibrium of saltation. J. Geophys. Res. 1992;97:20559–20564. [Google Scholar]
- 13.Iversen J.D., Rasmussen K.R. The effect of wind speed and bed slope on sand transport. Sedimentology. 1999;46:723–731. [Google Scholar]
- 14.Shao Y., Lu H. A simple expression for wind erosion threshold friction velocity. J. Geophys. Res. 2000;105:22437–22432. [Google Scholar]
- 15.Roney J.A., White B.R. Definition and measurement of dust aeolian thresholds. J. Geophys. Res. 2004;109:F01013. [Google Scholar]
- 16.Sorensen M. On the rate of aeolian sand transport. Geomorphology. 2004;59:53–62. [Google Scholar]
- 17.Stockton P.H., Gillette D.A. Field measurement of the sheltering effect of vegetation on erodible land surfaces. Land Degrad. Rehabil. 1990;2:77–85. [Google Scholar]
- 18.Stout J.E., Zobeck T.M. Intermittent saltation. Sedimentology. 1997;44:959–970. [Google Scholar]
- 19.Baas A.C.W. Evaluation of saltation flux impact responders (Safires) for measuring instantaneous aeolian sand transport intensity. Geomorphology. 2004;59:99–118. [Google Scholar]
- 20.Gillies J.A., Berkofsky L. Eolian suspension above the saltation layer, the concentration profile. J. Sediment. Res. 2004;74:176–183. [Google Scholar]
- 21.Mikami M., Shi G.Y., Uno I., Yabuki S., Iwasaka Y., Yasui M., Aoki T., Tanaka T.Y., Kurosaki Y., Masuda K., Uchiyama A., Matsuki A., Sakai T., Takemi T., Nakawo M., Seino N., Ishizuka M., Satake S., Fujita K., Hara Y., Kai K., Kanayama S., Hayashi M., Du M., Kanai Y., Yamada Y., Zhang X.Y., Shen Z., Zhou H., Abe O., Nagai T., Tsutsumi Y., Chiba M., Suzuki J. Aeolian dust experiment on climate impact: an overview of Japan-China joint project ADEC. Global Planet. Change. 2006;52:142–172. [Google Scholar]
- 22.Udo K., Kuriyama Y., Jackson D.W.T. Observations of wind-blown sand under various meteorological conditions. J. Geophys. Res. 2008;113:F04008. [Google Scholar]
- 23.Butterfield G.R. Grain transport rates in steady and unsteady turbulent airflows. Acta Mech. 1991;1:97–122. [Google Scholar]
- 24.Butterfield G.R. Traditional behaviour of saltation: wind tunnel observations of unsteady winds. J. Arid Environ. 1998;39:377–394. [Google Scholar]
- 25.Jackson D.W.T. A new, instantaneous aeolian sand trap design for field use. Sedimentology. 1996;43:791–796. [Google Scholar]
- 26.Bauer B.O., Namikas S.L. Design and field test of a continuously weighing, tipping-bucket assembly for aeolian sand traps. Earth Surf. Process. Landforms. 1998;23:1173–1183. [Google Scholar]
- 27.Davidson-Arnott R.G.D., MacQuarrie K., Aagaard T. The effect of wind gusts, moisture content and fetch length on sand transport on a beach. Geomorphology. 2005;68:115–129. [Google Scholar]
- 28.Ellis J.T., Morrison R.F., Priest B.H. Detecting impacts of sand grains with a microphone system in field conditions. Geomorphology. 2009;105:87–94. [Google Scholar]
- 29.Kubota S., Hosaka K., Oguri Y. Development of wind blown sand measuring device used a ceramic piezo-electric sensor: Output of a ceramic piezo-electric sensor when sand grains hit. Rep. Res. Inst. Sci. Technol. Nihon Univ. 2006;114:93–103. (in Japanese) [Google Scholar]
- 30.Kubota S., Hosaka K., Tamura T. Development of wind blown sand measuring device used a ceramic piezo-electric sensor. (2) Verification by a visual analysis using a high-speed camera. Rep. Res. Inst. Sci. Technol. Nihon Univ. 2007;115:141–149. (in Japanese) [Google Scholar]
- 31.Udo K. Field measurement of seasonal wind-blown sand flux using high-frequency sampling instrumentation. J. Coast. Res. 2009;SI 56:148–152. [Google Scholar]
- 32.U.S. Army Corps of Engineers . Coastal Engineering Manual 1110-2-1100. U.S. Army Corps of Engineers; Washington, DC, USA: 2008. Chapter III-4. [Google Scholar]
- 33.Kuriyama Y., Mochizuki N., Nakashima T. Influence of vegetation on aeolian sand transport rate from a backshore to a foredune at Hasaki, Japan. Sedimentology. 2005;52:1123–1132. [Google Scholar]
- 34.Ni J.R., Li Z.S., Mendoza C. Vertical profiles of aeolian sand mass flux. Geomorphology. 2002;49:205–218. [Google Scholar]
- 35.Rasmussen K.R., Sørensen M. Vertical variation of particle speed and flux density in aeolian saltation: measurement and modeling. J. Geophys. Res. 2008;113:F02S12. [Google Scholar]
- 36.Charnock H. Wind stress on a water surface. Q. J. R. Meteorol. Soc. 1955;81:639–640. [Google Scholar]
- 37.Chamberlain A.C. Roughness length of sea, sand, and snow. Boundary Layer Meteorol. 1983;25:405–409. [Google Scholar]
- 38.Raupach M.R. Rough-wall turbulent boundary layers. Appl. Mech. Rev. 1991;44:1–25. [Google Scholar]
- 39.Hotta S., Kubota S., Nakamura N., Hosaka K. Wind tunnel study of vertical distribution of sand transport rate by wind. In: Smith J.M., editor. Coastal Engineering 2006 (Proceedings of the 30th International Conference on Coastal Engineering); Toh Tuck Link, Singapore. World Scientific Pub. Co.; 2007. pp. 2604–2616. [Google Scholar]
- 40.Hotta S., Horikawa K. Vertical distribution of sand transport rate by wind. Coast. Eng. J. 1991;36:91–110. [Google Scholar]
- 41.Sherman D.J., Jackson D.W.T., Namikas S.L., Wang J. Wind-blown sand on beaches: An evaluation of models. Geomorphology. 1998;22:113–133. [Google Scholar]
- 42.Shao Y. Physics and Modelling of Wind Erosion. Kluwer Academic Publishers; Dordrecht, The Netherlands: 2000. p. 393. [Google Scholar]
- 43.Ni J.R., Li Z.S., Mendoza C. Blown-sand transport rate. Earth Surf. Process. Landf. 2004;29:1–14. [Google Scholar]
- 44.Rubey W.W. Settling velocities of gravel, sand, and silt particles. Am. J. Sci. 1933;25:325–338. [Google Scholar]
- 45.Horikawa K., Hotta S., Kubota S., Katori S. On the sand transport rate by wind on a beach. Coast. Eng. Japan. 1983;26:101–120. [Google Scholar]
- 46.Sherman D.J., Farrell E.J. Aerodynamic roughness lengths over movable beds: Comparison of wind tunnel and field data. J. Geophys. Res. 2008;113:F02S08. [Google Scholar]


