

Abstract
Cells migrate through a crowded environment during processes such as metastasis or wound healing, and must generate and withstand substantial forces. The cellular motility responses to environmental forces are represented by their force-velocity relation, which has been measured for fish keratocytes but remains unexplained. Even pN opposing forces slow down lamellipodium motion by three orders of magnitude. At larger opposing forces, the retrograde flow of the actin network accelerates until it compensates for polymerization, and cell motion stalls. Subsequently, the lamellipodium adapts to the stalled state. We present a mechanism quantitatively explaining the cell's force-velocity relation and its changes upon application of drugs that hinder actin polymerization or actomyosin-based contractility. Elastic properties of filaments, close to the lamellipodium leading edge, and retrograde flow shape the force-velocity relation. To our knowledge, our results shed new light on how these migratory responses are regulated, and on the mechanics and structure of the lamellipodium.
Introduction
Cell motility is instrumental in virtually all aspects of life, including development, immune response, wound healing, and tumor metastasis. Many motile cells form a flat membrane protrusion, known as the lamellipodium, in the direction of movement. Lamellipodium movement is driven by the polymerization of actin filaments against its leading-edge membrane (1, 2, 3, 4). The filaments can exert force, because their barbed ends polymerize and push against the membrane, whereas their pointed ends are anchored in an actin gel formed by entanglement and cross-linking. The cell velocity is determined by polymerization forces at the lamellipodium leading edge, contraction of the actin gel by myosin motors, cell adhesion to the substrate, and the backward-directed actin gel retrograde flow (5, 6). These processes establish the force-velocity relation, which determines the cell's shape and movement (6). This relation has been measured with a scanning force microscope (SFM) for fish keratocytes (7, 8, 9) by placing a flexible cantilever in the cell's migration path. The force exerted on the cell's leading edge as well as the lamellipodium protrusion velocity can be deduced from the time course of cantilever deflection.
The force-velocity relation of lamellipodium protrusion has several unexpected properties. Upon first contact with an obstacle such as the SFM cantilever, the velocity of the lamellipodium leading edge drops substantially, even though the cantilever presents a force below the threshold of measurement at this time. Subsequently, the lamellipodium then surprisingly pushes forward with an increasing velocity against an increasing force. As the lamellipodium nears its maximum protrusion force, its velocity decreases until the cantilever force balances with protrusion force and stalls lamellipodium motion (7). This part of the force-velocity relation is clearly not convex, contrary to expectations and theoretical predictions (4, 10, 11, 12) and despite actin polymerization at the leading edge having a convex force dependency (4, 13). The organization of the actin propulsion engine, which generates a concave force-velocity relation, pauses at pN forces, yet only stalls at forces an order-of-magnitude larger, is an essential feature of the lamellipodium that is not understood.
Here, we measure the force-velocity relationship of fish keratocytes using spherical-probe-based SFM. We present a mathematical model that accurately explains all phases of the force-velocity relation, predicts the effects of drugs, and reproduces the diverse experimental results from a variety of studies (7, 8).
Materials and Methods
Force-velocity curves are measured with spherical probe-based scanning force microscopy
We measure the protrusion stall force of fish keratocytes with a recently established SFM-technique (14) (Fig. 1). It uses the vertical and lateral deflection of a SFM-cantilever modified by a spherical probe (14). A polystyrene bead is bound to an SFM cantilever tip (14) and positioned on the substrate in front of a migrating cell with a preset force to assure tight contact. Cells move unhindered until they encounter the bead, push it, and cause torsion of the cantilever (Fig. 1). Because of the high normal force of the cantilever, the cell can only push the bead within its plane of movement until the opposing load reaches the cell's stall force (Fig. 1). The torsional motion lifts the spherical probe from the substrate. Nevertheless, the bead still completely stalls the motion and the lamellipodium cannot slip through under the probe. If the vertical preset force was chosen very low (<1 nN), the cell would be able to squeeze beyond the bead and to push the cantilever upwards. High-resolution interference reflection microscopy measures the free cell velocity and monitors precisely the position of the lamellipodial edge with respect to the spherical probe to additionally assure that the lamellipodium does not slip under the probe and that the cell is fully stalled by the bead as obstacle. The validity of this technique has been recently verified by the fact that similar approaches produced the same quantitative results (7, 8). In addition, we use lamellipodium feature tracking analysis to measure the retrograde flow in some cells during unhindered motion (see Table S2 and Methods in the Supporting Material).
Figure 1.
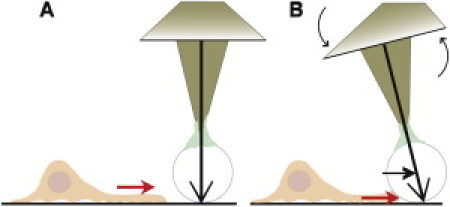
Spherical probe attached to an SFM-cantilever. (A) The probe is placed with a preset force of 10 nN in the path of the cell. (B) The probe stalls the leading edge of a forward moving cell. The torsional bending of the cantilever measures the force.
Force analysis
Vertical and rotational sensitivity sΦ (nm/V and rad/V, respectively) and normal and rotational spring constant kΦ (mN/m and Nm/rad, respectively) of the cantilever allow the conversion of the vertical signal into height and of the lateral signal into torque τ. The lateral force FL can be evaluated using the general relation FL=τ/l, where τ = sΦkΦΔVL, and l is the moment arm. It consists of the tip length plus a certain fraction of the bead diameter, depending on the height of the lamellipodium, which was derived from topographical scans.
Cell culture and cytoskeletal drug treatment
Primary goldfish epithelial keratocytes were cultured in Dulbecco's modified Eagle's medium (E15-810; PAA, Etobicoke, Ontario, Canada) supplemented with 20% fetal calf serum (Cat. No. A15-043; PAA), 10 mM HEPES (H4034; Sigma, St. Louis, MO), and 100 U/ml penicillin-streptomycin (P0781; Sigma) in a custom-built experimental dish, which consists of a commercial petri dish with a 3-cm hole in the bottom and a 4-cm round glass coverslip (631-0177; VWR International, West Chester, PA) glued to it. The cells were cultured at room temperature and 5% CO2.
Cytoskeletal drugs (ML-7, 750 nM; cytochalasin D, 80 nM) were applied to the cell medium at least 12 h before any measurement, and it was assumed that the drug concentration inside and outside the cell reached equilibrium during that time. Cells remained viable and motile, with no observed apoptosis.
Modeling the force-velocity relation
A detailed model description can be found in the Supporting Material.
Results and Discussion
Processes and interactions contributing to the force-velocity relation and entering the mathematical model
The mathematical model (15, 16, 17) (see Supporting Material) is based upon properties of individual actin filaments at the leading edge, cross-linked filaments in the more proximal regions of the lamellipodium, and examines their forces against the plasma membrane (Fig. 2). Network behavior at the leading edge is dominated by semiflexible single polymer properties, because cross-linking molecules have not bound to the newly polymerized filaments yet (17). Moreover, the branch point density (arising from filament nucleation, see below) is also very low in that region (18), such that branching does not contribute essentially to cross-linking, which further validates the dominance of single filament behavior. We call this area the semiflexible region (SR). The network is more strongly cross-linked further away from the leading edge, because molecules had time to bind to longer existing filament parts. This cross-linking gradient is also reflected by the network structure with single actin filaments present at the periphery and bundled networks filling the proximal part (5, 19, 20, 21, 22, 23). Network properties are thus more gel-like further back toward the cell body (24). The transition from SR to gel is gradual, but we approximate it by a sharp gel boundary in the mathematical model. Although these two regions are structurally distinct, they are mutually dependent and connected, as the SR drives retrograde flow and pushes the gel rearward. Vice versa, the difference between the leading-edge velocity and the gel boundary velocity determines the dynamics of the SR depth, the length of polymers in the SR, and consequently the force they transmit (17).
Figure 2.
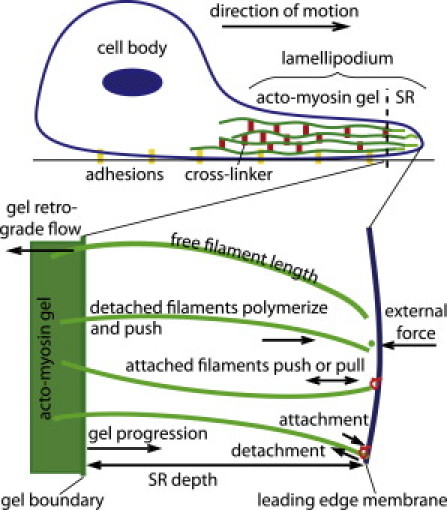
Illustration of the modeled lamellipodial structure. The lamellipodium is a flat membrane protrusion extended by motile cells in the direction of motion. The actin network inside forms a cross-linked gel (solid green) and a semiflexible region (SR) dominated by single filaments. The mathematical model describes the dynamics of gel retrograde flow, adhesion, SR depth, free filament length in the SR, filament attachment and detachment, gel boundary motion, and leading-edge membrane motion.
The leading-edge velocity of the lamellipodium is set by the balance of forces exerted by filaments on the membrane, the external cantilever force, and all viscous forces resisting membrane motion (15, 25). Filament cross-linking, entanglement, and retrograde flow determine the progression of the gel boundary (17). These processes depend on the filament lengths in the SR. If the filaments in the SR are very short, gel protrusion stops, as these filaments cannot entangle, nor can they bind cross-linkers. Conversely, gel progression increases with longer free lengths, eventually saturating at a value determined by cross-linker concentration (15, 17). The cross-linking rate increases with filament density, because denser filament packing permits cross-linkers to span the interfilament distance more frequently (17).
Retrograde flow is maintained by polymerization at the leading edge and myosin contraction of the network at the boundary between the lamellipodium and the cell body, whereas contraction by myosin in the central lamellipodium contributes little (6, 26, 27, 28). We model the retrograde flow using a gel theory that captures the viscoelastic properties of the actin network, polarization due to alignment of filaments into the direction of motion, and contraction by myosin (29). Force transmission from substrate adhesion to the actin gel is described by friction in this theory.
New filaments are nucleated close to the leading edge (3, 30). Polymerization is terminated by binding of capping proteins to the filament barbed ends (3, 30), and capped ends move into the gel region. The steady motion and shape of fish keratocytes implies that capping and nucleation maintain a constant actin filament density in the SR (6). According to the dendritic-nucleation model, new filaments grow from actin-related protein 2/3 complex (Arp2/3), which is bound to existing filaments. This branching requires activation of Arp2/3 by membrane-bound Wiskott Aldrich Syndrome protein (3, 30). Branch points are formed at the membrane and move within seconds into the gel as filaments are cross-linked. Response times of filament density to external force in an in vitro experiment (31) and the slow filament nucleation rate (18) support the assumption that the filament density remains constant during our measurements.
The binding of filaments to the plasma membrane affects their force generation, because attached filaments either push or pull the membrane depending on their free length and the SR depth. Experimental evidence suggests that filaments transiently attach to the leading-edge membrane during the nucleation process (21, 32, 33, 34, 35), but are also independent from nucleation via nucleation-promoting factors (16, 30, 34, 35, 36) and other F-actin-membrane-linking proteins (37). Therefore, we incorporate attached and detached filaments in the model (4, 15). Detached filaments polymerize and push against the leading-edge membrane, whereas attached filaments do not polymerize in our model and can exert either a pushing or a pulling force.
The mathematical model (see description and the expressions in Eq. S3 in the Supporting Material) comprises the dynamics of the number and length of attached and detached filaments in the SR, and the positions and velocities of both the gel boundary and the leading-edge membrane (Fig. 3). The leading-edge position is equal to cantilever deflection after cantilever contact. We fit the model simulations by eye to the measurements. We only change the parameters shown in Table 1 to account for cell variability and drug effects. All other parameter values are either determined by the experimental setup, taken from the literature whenever available, or fitted once and then kept fixed (see Table S1 in the Supporting Material). Simulations start with parameter values that reproduce the velocity of the individual free running cell and the population average of the retrograde flow (see Table S2). Velocity and retrograde flow fix the value of the model's maximum cross-linking rate, because it has to be equal to the sum of both during free steady motion. Gel viscosity, friction, and contractile stress determine the retrograde flow velocity. Those parameters, as well as the filament density and polymerization rate, also affect the other phases of the force-velocity relation and are determined by fitting the cantilever deflection through all three of them (Fig. 3).
Figure 3.
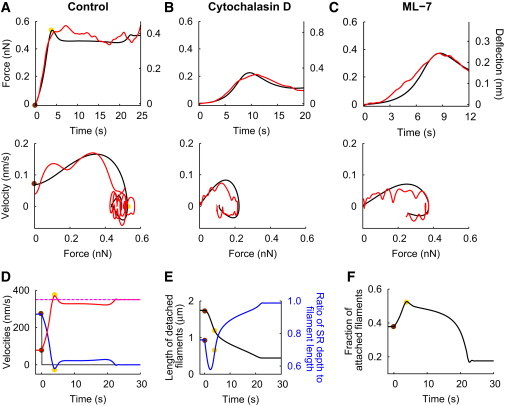
Cantilever deflections, force-velocity relations, and SR properties. (A–C) Comparison of simulations (black) and experiments (red) for (A) a control cell and cells influenced by the application of (B) cytochalasin D and (C) ML-7. (Upper row) Time course of the cantilever deflection due to the lamellipodium's leading edge pushing against the bead on the cantilever; (lower row) force-velocity relation. (D–F) Simulated development of velocities and the semiflexible region (SR) after cantilever contact for the control cell. (Brown dots) First cantilever contact; (yellow dots) time when motion stalls. (D) Development of the leading-edge velocity (black), the gel boundary velocity (blue), retrograde flow velocity (red), and the sum of the gel boundary and retrograde flow velocities (dashed magenta), which is essentially constant. (E) Time course of the ratio of SR depth to length of detached filaments (blue) and the filament length (black). The differential stiffness of the filaments is proportional to (free filament length)−4 (see Eq. S1 in the Supporting Material). (F) Time course of the fraction of filaments attached to the membrane. Parameter values for simulations are given in Table S1. See also Fig. 1 and Fig. S1 and Fig. S5.
Table 1.
Statistics of parameter values to describe control and drug applications
| Parameter | Control | Cytochalasin D | ML-7 | Surfaces (Fig. 4) | Units |
|---|---|---|---|---|---|
| Filament density | 302 ± 42 | 181 ± 32 | 300 ± 0 | Variable | μm−1 |
| Maximum value of the polymerization rate | 611 ± 205 | 588 ± 80 | 613 ± 106 | 617 | nm/s |
| Maximum value of the cross-linking rate | 306 ± 75 | 129 ± 73 | 157 ± 52 | Variable | nm/s |
| Viscosity of the actin gel | 0.91 ± 0.38 | 0.90 ± 0.37 | 1.03 ± 0.17 | 0.5, 0.833, 1.33 | nNs/μm2 |
| Friction coefficient modeling adhesion | 0.23 ± 0.12 | 0.22 ± 0.11 | 0.243 ± 0.053 | 0.1, 0.233, 0.4 | nNs/μm3 |
| Active contractile stress in the actin gel | 8.33 | 8.33 | 0 | 8.33 | pN/μm2 |
List of parameter values (mean ± SD) resulting from fitting experimentally measured deflection curves (control N = 13, cytochalasin D N = 8, ML-7 N = 7). Results of all simulations are shown in Fig. 4. Parameter values for the surfaces shown in Fig. 4 are given in the fifth column (smaller values of the gel viscosity and friction coefficient correspond to lower surface in Fig. 4B, higher values to upper surface). All other parameter values are listed in Table S1. The active contractile stress value 8.33 pN/μm2 is small compared to the other term in the constitutive equation (see Methods in the Supporting Material), which can be estimated as 1–4 nN/μm2.
Initial velocity drop
Upon first contact with the cantilever, the leading-edge velocity drops from ∼260 nm/s to <0.1 nm/s both in experiments and simulations (Fig. 3 D). The velocity drop is the difference between the free cell velocity and the first detectable cantilever deflection velocity. The ensuing slow cell motion causes the force-velocity relations shown in Fig. 3, A–C.
The boundary between the SR and gel decelerates slowly, but the initial leading-edge velocity drop appears to be instantaneous (Fig. 3 D), and simulations suggest that it occurs within a few milliseconds. The forces causing this abrupt leading-edge deceleration are in the range of the zero point fluctuations of the cantilever of ∼0.05 nN (see Fig. S1 in the Supporting Material). The model explains the sensitive response of the leading edge to these minute forces by the rather long free polymer length in the SR. Fits of the model to measurements result in a filament length of the freely running cell of ∼1.8 μm (Fig. 3 E). Such long filaments easily bend elastically (see Eqs. S1 and S2 in the Supporting Material) (11, 13).
For given maximum cross-linking and polymerization rates, the free filament length is determined by the force per filament, which in turn depends on filament density. Small force per filament entails long free length. We will see in the next section how the free filament length adapts to force changes. The free filament length also crucially affects the time course of the concave phase, in particular the time until stalling. Hence, the fitting procedure results in a filament density value (and polymerization rate), providing for a force per filament and free filament length in the freely running cell—which explains the sensitive initial response and is compatible with the time course of the concave phase.
Retrograde flow accelerates
The concave phase follows the initial velocity drop (Fig. 3 A). It lasts until the first force maximum of the deflection curve, where the stall force is reached. The leading-edge velocity increases slightly in the beginning, then it decreases and lamellipodium motion stalls. The leading-edge velocity is small initially, because filaments are long and the SR is soft. Long filaments cannot transmit the external force to the gel effectively. Thus, the gel keeps moving forward, the SR depth shrinks, and filaments bend (Fig. 3 E). Bent filaments are cross-linked into the gel more quickly as the SR depth decreases. They shorten and become stiffer, which enables them to transmit larger forces without further bending, to straighten out and to cause the slight velocity increase.
Because the external opposing force prevents forward protrusion, the ongoing polymerization pressure pushes the actin gel rearward. Retrograde flow accelerates during the entire concave phase, as the force transmitted by the filaments in the SR increases with increasing stiffness (Fig. 3 D). The external force shifts the partitioning of the polymerization velocity between forward protrusion and retrograde flow towards retrograde flow. The cell slows down as retrograde flow speeds up (Fig. 3 D). Cell motion stalls when all polymerization velocity is converted into retrograde flow, in agreement with experimental reports showing the sum of protrusion velocity and retrograde flow to be approximately constant (26).
The polymerization rate decreases exponentially with increasing force (4, 13). Nevertheless, forces per detached filament stay at <1 pN (see Fig. S2), which is the single filament polymerization stall force (11, 38). Therefore, a reduction of the polymerization rate by the load per filament is not the crucial factor in cell deceleration. It is not the force-dependence of polymerization that shapes the force-velocity curve of the lamellipodium, but the interplay between filament shortening and bending in the SR and gel retrograde flow. Because the actin filaments continue to polymerize, retrograde flow is fast in the stalled state, and the polymerization force that pushes retrograde flow balances the external force when the cell stalls.
The magnitude of the stall force is determined by the maximum polymerization rate and gel properties like viscosity and adhesion. The polymerization rate influences also the free filament length. The time to reach the stall force increases with increasing filament density because the force per filament decreases, filaments are longer, and it takes longer to shorten them.
Adaptation to the stalled state
When the first maximum of the deflection is reached, the lamellipodium has not adapted to the larger external force yet. The ensuing adaptation to the stalled state causes a third phase of the force-velocity relation, which starts with a slight leading-edge retraction followed by irregular and transient oscillations with decreasing amplitude around the stall force (Fig. 3 A). The durations and time courses of the transients are not generalizable and vary between cells, comprising anything between several undulations of force and velocity and a single incomplete one. However, the existence of an adaptation phase is a universal feature of the force-velocity curve, and has been observed in all simulations and experiments. Adaptation demonstrates that the force-velocity relation is a dynamic phenomenon. It does not describe the stationary velocity of the lamellipodium for a given force.
During the adaptation phase, the depth of the SR shrinks and filaments in the SR straighten further (Fig. 3 E). The detachment rate of bound filaments increases exponentially with the pulling force (see Eq. S4 in the Supporting Material) (4, 39). Therefore, whereas the fraction of attached filaments increases during the second phase due to the increasing external pushing force, during the third phase it decreases to the value in the stalled state (Fig. 3 F).
Applications of cytochalasin D and ML-7
The mechanism is confirmed by the predictions of the model for the keratocytes' force-velocity relation, when the behavior of cytoskeletal proteins is modulated by drugs (Fig. 4). We compare model predictions with experiments in two steps: First, we fit the model to the individual measurements as described above. Second, we assess whether significant changes of parameter values of drug-treated cells with respect to control cells are in line with the generally established knowledge about the action of the drug. We find that only the values of those parameters change significantly, which reflect the action of the drugs (Table 1). All the other model parameters vary within a reasonable range, but are not significantly different between control and drug applications.
Figure 4.
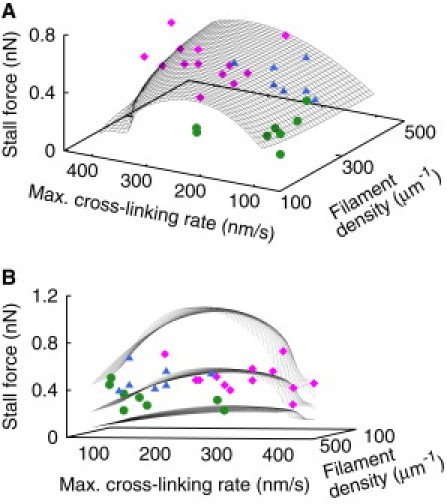
Dependence of the stall force on maximum cross-linking rate and filament density. (A) (Black surface) Prediction of the mathematical model for the control parameter values from Table S1. (Dots) Results for cross-linking rate and filament density from fits of the model to measurements like those shown in Fig. 3 (magenta rectangles, control; green circles, cytochalasin D; blue triangles, ML-7). (B) The same data from a different angle of view showing the scatter of experimental data more clearly. The two additional surfaces demonstrate that all measured stall forces can be explained by the model within a realistic parameter value range for such parameters as cross-linking rate, filament density, the friction coefficient modeling adhesion, and viscosity of the actin gel (see Table 1 and Table S1 for parameter values).
Cytochalasin D caps barbed filament ends, thus terminating their polymerization (40). Consequently, it reduces the density of filaments, and also the cross-linking rate. Fits of the model to eight cells demonstrate that only the parameter values of filament density (Student's t-test p = 7 10−7) and cross-linking rate (p = 8 10−5) decrease significantly relative to control samples upon cytochalasin D application (Table 1). As a consequence, cytochalasin D reduces the velocity of an unhindered cell (see Table S2) and delays stalling by the cantilever (Fig. 3 B). Additionally, the stall force is approximately one-third of the control value. All these properties are found in experiments and simulations.
Myosin can contract the actin gel; however, myosin contraction does not contribute significantly to centripetal actin network flow in the central lamellipodium of fish keratocytes (6, 26, 27, 28). Accordingly, fits of the model to control experiments resulted in a small value of the contractility parameter. Myosin motors act also as cross-linkers. Fitting the model to seven cells shows that the effect of inhibiting myosin by ML-7 (41) can be well described by a reduction of the cross-linking rate (p = 7 10−5) and vanishing gel contraction (Fig. 3 C, Table 1). ML-7 also delays stalling by the cantilever, but the average stall force does not change with respect to controls. The quantitative agreement between experiments and simulations suggests that the protrusion mechanisms are accurately reproduced by our model.
Softer cantilevers
The velocity dropped less in experiments by the Radmacher lab (to ∼20 nm/s) (7, 8) than in our experiments (to ∼0.1 nm/s, Fig. 3). Accordingly, velocities in the concave phase were also larger in their experiments than in ours. The major difference between the experiments was the force constant of the cantilevers; Prass et al. (7) used a much softer cantilever (force constant 1.4 nN μm−2) than we did (290 nN μm−2). Simulations showed that the velocities in the concave phase are inversely proportional to the force constant (Fig. 5), which explains the different measured velocities. The good agreement of the simulations with both sets of experimental results (7, 8) (Fig. 5) shows that the force-velocity curve and the magnitude of the velocity drop depend on the stiffness of the cantilever, and that simply the different values of the cantilever force constants explain the differences between studies. The stall force, however, does not depend on cantilever stiffness, which confirms that it is an intrinsic lamellipodium property.
Figure 5.
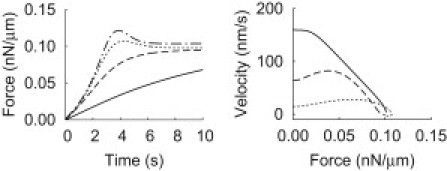
Simulated force-velocity curves for different force constants k of the SFM cantilever. Cantilever force time courses and the corresponding force-velocity relations are shown. Smaller cantilever force constants result in larger deflections for a given force, and larger velocities in the force-velocity relation. (Dashed-dotted curve) k = 290 nN μm−2 (force constant used in our study, see also Fig. 3); (dotted curve) k = 1.4 nN μm−2 (force constant used in the study by Prass et al. (7)); (dashed curve) k = 0.28 nN μm−2; (solid curve) k = 0.056 nN μm−2. Simulations also show that the velocities in the concave phase are approximately proportional to 1/k, aside from the softest cantilever. All other parameter values as for control in Fig. 3.
Conclusion
We have considered for the first time all phases of the force-velocity relation: the initial velocity drop upon cantilever contact, the concave relation up to the stall force, and the adaptation to the stalled state. They are explained by the interaction of a semiflexible actin network region near the leading edge with a gel-like actin network further back in the bulk of the lamellipodium (Fig. 6). A small force of the order of the resulting filament forces of the freely running cell suffices to almost stop the lamellipodium leading edge, whereas the actin gel further back keeps moving. Consequently, the width of the SR shrinks and the filaments bend. Bent filaments transmit a higher force between the membrane and the gel, which leads to a slight increase of the leading-edge velocity before stalling. As filaments in the SR shorten, stronger external force is transmitted to the gel and retrograde flow increases. Retrograde flow compensates for polymerization in the stalled state. The force-velocity curve is a dynamic phenomenon. It does not reflect the velocity of the cell after long stationary application of an external force.
Figure 6.
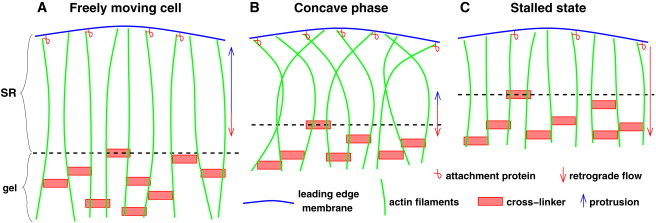
Summary of the mechanism. (A) Protrusion velocity is much faster than retrograde flow in the freely running cell. The depth of the SR and the free filament length are determined by the force per filament required for protrusion. (B) Filaments bend and shorten upon contact with the spherical probe. Protrusion velocity is very small and retrograde flow is increasing. (C) Free filament length is sufficiently short for transmission of the stall force to the gel. Filaments are stiffer, because they are shorter than in the freely running cell. Retrograde flow in the stalled state is approximately equal to the sum of retrograde flow and protrusion in the freely running cell, and also equal to the polymerization velocity. The force required to drive retrograde flow with the velocity of ongoing polymerization is the stall force, because contractile forces contribute little to retrograde flow in the central fish keratocyte lamellipodium.
The mechanism reconciles the ideas on force generation by actin polymerization (2, 3, 6, 42) at the leading edge with the shape of the force-velocity relation. The exponential decrease of the polymerization rate with increasing force does not appear in the force-velocity relation, because retrograde flow responds more sensitively than the polymerization rate.
Our mechanism reproduces measured force-velocity relations in a range of parameter values accounting for cell variability (Fig. 4, Table 1, and see Table S2) and uncertain parameter values like the persistence length (see Fig. S3). We also examined the possibility of catch bonds in focal adhesions shaping the force-velocity relation within our model by introducing a positive feedback from the force exerted on the leading edge to the friction coefficient that describes adhesion and found that they are not necessary to describe our experimental results (see Fig. S4).
We and others (7, 8, 43) found the leading-edge motion of the freely running cell to respond sensitively to very small forces. The SR is very compliant due to the rather long free filament length in the free cell. Thus, our results contribute to an ongoing discussion about the structure of the lamellipodium actin network, in which the length of filaments is a central topic. Long filaments imply small capping rates and consequently also small nucleation rates for steadily moving cells, whereas short filaments imply large rates (44, 45). The discussion (45, 46, 47, 48) is mainly based on electron microscopy studies resulting in either long filaments (∼1 μm) (18, 44) or short ones (∼0.2 μm) (3, 28). A recent evaluation of the branch point density in the same sample from 3T3 fibroblasts by two independent groups produced values of 277 μm−2 (49) and 140 μm−2 (48). Taking filament line density of ∼200 μm−1 (18) into account, we obtain an average free filament length between branch points of ∼0.72 μm and 1.4 μm, respectively. Whether filaments with these free lengths bend at the forces per filament occurring during the measurement can be estimated by the Euler buckling force. Gholami et al. (13) showed that semiflexible filaments are severely bent at this force. We obtain 0.2 pN with the smaller value of free length and 0.07 pN with the larger one using a persistence length of 10 μm. Clearly, actin filaments bend with both values of free length at the forces per filament occurring during the force-velocity measurements (see Fig. S2), which confirms our explanation for the SR elasticity.
Our approach is independent from electron microscopy studies and supports free filament lengths in the range of 1 μm. The model result of ∼1.8 μm for control is a little longer than the above values and the 1.3 μm previously reported (44); however, the absolute values of free filament length resulting from the simulations depend on the parameter value of the persistence length. We use the in vitro value 15 μm (50, 51), because we are not aware of any in vivo measurements. Other in vitro measurements report values between 9 μm and 13.5 μm depending on the specific conditions (52). The in vivo persistence length is most likely shorter, because cofilin can reduce it down to 2.2 μm (53, 54). If we use a persistence length of 7.5 μm, simulations yield a free polymer length of ∼1.2 μm (see Fig. S3), which is in the range of the measured values. It also suggests a scaling of free polymer length with approximately the square root of the persistence length in agreement with the force extension relations (13, 55). A low branch point and cross-linker density in the SR is required for the validity of our results, but not a branch point and cross-link free region. This model assumption is supported by the calculated differential SR stiffness of ∼60 Pa, which is in good agreement with values of weakly cross-linked F-actin networks (56, 57).
Our results imply that filaments do not behave like stiff rods in the free cell at low forces, but only at larger forces in the later parts of the force-velocity relation, when free filament length has shortened: The lamellipodium stiffness adapts to the external force. This scenario corresponds to the explanation for the initial drop and ensuing increase of the velocity by Heinemann et al. (8) to result from the elastic response of a spring with increasing stiffness. Our model exhibits this adaptation of stiffness to force because free filament length is considered as a dynamic variable (not as a fixed parameter), and because force not only determines length dynamics but also length the force that can be exerted (see Eqs. S1 and S2 in the Supporting Material). Due to the sensitive dependence of stiffness on free length, it can adapt over two orders of magnitude and reach values comparable to the elastic modulus of cells (14). The mechanism guarantees stiffness adaptation as fast as the cell moves, because the adaptation rate is set by the cross-linking rate that is similar to the free cell velocity.
The insight into actin-based force generation obtained here will improve our understanding of how cells force their way through tissue by dynamically adjusting their stiffness and load resistance. Cell motility is a critical process during metastasis of cancer cells (58), when neuronal growth cones find their way during development, or when wounds heal.
Editor: Charles Wolgemuth.
Footnotes
Supporting Material
References
- 1.Theriot J.A., Mitchison T.J. Actin microfilament dynamics in locomoting cells. Nature. 1991;352:126–131. doi: 10.1038/352126a0. [DOI] [PubMed] [Google Scholar]
- 2.Carlier M.-F., Wiesner S., et al. Pantaloni D. Actin-based motility as a self-organized system: mechanism and reconstitution in vitro. C. R. Biol. 2003;326:161–170. doi: 10.1016/s1631-0691(03)00067-2. [DOI] [PubMed] [Google Scholar]
- 3.Pollard T.D., Borisy G.G. Cellular motility driven by assembly and disassembly of actin filaments. Cell. 2003;112:453–465. doi: 10.1016/s0092-8674(03)00120-x. [DOI] [PubMed] [Google Scholar]
- 4.Mogilner A., Oster G. Force generation by actin polymerization II: the elastic ratchet and tethered filaments. Biophys. J. 2003;84:1591–1605. doi: 10.1016/S0006-3495(03)74969-8. [DOI] [PMC free article] [PubMed] [Google Scholar]
- 5.Ji L., Lim J., Danuser G. Fluctuations of intracellular forces during cell protrusion. Nat. Cell Biol. 2008;10:1393–1400. doi: 10.1038/ncb1797. [DOI] [PMC free article] [PubMed] [Google Scholar]
- 6.Keren K., Pincus Z., et al. Theriot J.A. Mechanism of shape determination in motile cells. Nature. 2008;453:475–480. doi: 10.1038/nature06952. [DOI] [PMC free article] [PubMed] [Google Scholar]
- 7.Prass M., Jacobson K., et al. Radmacher M. Direct measurement of the lamellipodial protrusive force in a migrating cell. J. Cell Biol. 2006;174:767–772. doi: 10.1083/jcb.200601159. [DOI] [PMC free article] [PubMed] [Google Scholar]
- 8.Heinemann F., Doschke H., Radmacher M. Keratocyte lamellipodial protrusion is characterized by a concave force-velocity relation. Biophys. J. 2011;100:1420–1427. doi: 10.1016/j.bpj.2011.01.063. [DOI] [PMC free article] [PubMed] [Google Scholar]
- 9.Brunner C., Niendorf A., Käs J. Passive and active single-cell biomechanics: a new perspective in cancer diagnosis. Soft Matter. 2009;5:2171–2178. [Google Scholar]
- 10.Mogilner A. On the edge: modeling protrusion. Curr. Opin. Cell Biol. 2006;18:32–39. doi: 10.1016/j.ceb.2005.11.001. [DOI] [PubMed] [Google Scholar]
- 11.Mogilner A., Oster G. Cell motility driven by actin polymerization. Biophys. J. 1996;71:3030–3045. doi: 10.1016/S0006-3495(96)79496-1. [DOI] [PMC free article] [PubMed] [Google Scholar]
- 12.Carlsson A.E. Growth of branched actin networks against obstacles. Biophys. J. 2001;81:1907–1923. doi: 10.1016/S0006-3495(01)75842-0. [DOI] [PMC free article] [PubMed] [Google Scholar]
- 13.Gholami A., Wilhelm J., Frey E. Entropic forces generated by grafted semiflexible polymers. Phys. Rev. E. 2006;74:041803. doi: 10.1103/PhysRevE.74.041803. [DOI] [PubMed] [Google Scholar]
- 14.Brunner C.A., Ehrlicher A., et al. Goegler M. Cell migration through small gaps. Eur. Biophys. J. 2006;35:713–719. doi: 10.1007/s00249-006-0079-1. [DOI] [PubMed] [Google Scholar]
- 15.Enculescu M., Gholami A., Falcke M. Dynamic regimes and bifurcations in a model of actin-based motility. Phys. Rev. E. 2008;78:031915. doi: 10.1103/PhysRevE.78.031915. [DOI] [PubMed] [Google Scholar]
- 16.Enculescu M., Sabouri-Ghomi M., et al. Falcke M. Modeling of protrusion phenotypes driven by the actin-membrane interaction. Biophys. J. 2010;98:1571–1581. doi: 10.1016/j.bpj.2009.12.4311. [DOI] [PMC free article] [PubMed] [Google Scholar]
- 17.Zimmermann J., Enculescu M., Falcke M. Leading-edge-gel coupling in lamellipodium motion. Phys. Rev. E. 2010;82:051925. doi: 10.1103/PhysRevE.82.051925. [DOI] [PubMed] [Google Scholar]
- 18.Urban E., Jacob S., et al. Small J.V. Electron tomography reveals unbranched networks of actin filaments in lamellipodia. Nat. Cell Biol. 2010;12:429–435. doi: 10.1038/ncb2044. [DOI] [PubMed] [Google Scholar]
- 19.Bugyi B., Le Clainche C., et al. Carlier M.F. How do in vitro reconstituted actin-based motility assays provide insight into in vivo behavior? FEBS Lett. 2008;582:2086–2092. doi: 10.1016/j.febslet.2008.02.065. [DOI] [PubMed] [Google Scholar]
- 20.Ponti A., Machacek M., et al. Danuser G. Two distinct actin networks drive the protrusion of migrating cells. Science. 2004;305:1782–1786. doi: 10.1126/science.1100533. [DOI] [PubMed] [Google Scholar]
- 21.Koestler S.A., Auinger S., et al. Small J.V. Differentially oriented populations of actin filaments generated in lamellipodia collaborate in pushing and pausing at the cell front. Nat. Cell Biol. 2008;10:306–313. doi: 10.1038/ncb1692. [DOI] [PubMed] [Google Scholar]
- 22.Giannone G., Dubin-Thaler B.J., et al. Sheetz M.P. Lamellipodial actin mechanically links myosin activity with adhesion-site formation. Cell. 2007;128:561–575. doi: 10.1016/j.cell.2006.12.039. [DOI] [PMC free article] [PubMed] [Google Scholar]
- 23.Shemesh T., Verkhovsky A.B., et al. Kozlov M.M. Role of focal adhesions and mechanical stresses in the formation and progression of the lamellum interface [corrected] Biophys. J. 2009;97:1254–1264. doi: 10.1016/j.bpj.2009.05.065. [DOI] [PMC free article] [PubMed] [Google Scholar]
- 24.Laurent V.M., Kasas S., et al. Meister J.J. Gradient of rigidity in the lamellipodia of migrating cells revealed by atomic force microscopy. Biophys. J. 2005;89:667–675. doi: 10.1529/biophysj.104.052316. [DOI] [PMC free article] [PubMed] [Google Scholar]
- 25.Gholami A., Falcke M., Frey E. Velocity oscillations in actin-based motility. New J. Phys. 2008;10:033022. [Google Scholar]
- 26.Vallotton P., Danuser G., et al. Verkhovsky A.B. Tracking retrograde flow in keratocytes: news from the front. Mol. Biol. Cell. 2005;16:1223–1231. doi: 10.1091/mbc.E04-07-0615. [DOI] [PMC free article] [PubMed] [Google Scholar]
- 27.Rubinstein B., Fournier M.F., et al. Mogilner A. Actin-myosin viscoelastic flow in the keratocyte lamellipod. Biophys. J. 2009;97:1853–1863. doi: 10.1016/j.bpj.2009.07.020. [DOI] [PMC free article] [PubMed] [Google Scholar]
- 28.Svitkina T.M., Verkhovsky A.B., et al. Borisy G.G. Analysis of the actin-myosin II system in fish epidermal keratocytes: mechanism of cell body translocation. J. Cell Biol. 1997;139:397–415. doi: 10.1083/jcb.139.2.397. [DOI] [PMC free article] [PubMed] [Google Scholar]
- 29.Kruse K., Joanny J.F., et al. Prost J. Contractility and retrograde flow in lamellipodium motion. Phys. Biol. 2006;3:130–137. doi: 10.1088/1478-3975/3/2/005. [DOI] [PubMed] [Google Scholar]
- 30.Carlier M.-F., Pantaloni D. Control of actin assembly dynamics in cell motility. J. Biol. Chem. 2007;282:23005–23009. doi: 10.1074/jbc.R700020200. [DOI] [PubMed] [Google Scholar]
- 31.Parekh S.H., Chaudhuri O., et al. Fletcher D.A. Loading history determines the velocity of actin-network growth. Nat. Cell Biol. 2005;7:1219–1223. doi: 10.1038/ncb1336. [DOI] [PubMed] [Google Scholar]
- 32.Svitkina T. N-WASP generates a buzz at membranes on the move. Cell. 2007;128:828–830. doi: 10.1016/j.cell.2007.02.028. [DOI] [PubMed] [Google Scholar]
- 33.Upadhyaya A., van Oudenaarden A. Biomimetic systems for studying actin-based motility. Curr. Biol. 2003;13:R734–R744. doi: 10.1016/j.cub.2003.08.051. [DOI] [PubMed] [Google Scholar]
- 34.Weisswange I., Newsome T.P., et al. Way M. The rate of N-WASP exchange limits the extent of ARP2/3-complex-dependent actin-based motility. Nature. 2009;458:87–91. doi: 10.1038/nature07773. [DOI] [PubMed] [Google Scholar]
- 35.Akin O., Mullins R.D. Capping protein increases the rate of actin-based motility by promoting filament nucleation by the Arp2/3 complex. Cell. 2008;133:841–851. doi: 10.1016/j.cell.2008.04.011. [DOI] [PMC free article] [PubMed] [Google Scholar]
- 36.Co C., Wong D.T., et al. Taunton J. Mechanism of actin network attachment to moving membranes: barbed end capture by N-WASP WH2 domains. Cell. 2007;128:901–913. doi: 10.1016/j.cell.2006.12.049. [DOI] [PMC free article] [PubMed] [Google Scholar]
- 37.Enculescu M., Falcke M. In: Advances in Systems Biology, Vol. 736 of Advances in Experimental Medicine and Biology. Goryanin I.I., Goryachev A.B., editors. Springer; New York: 2011. Modeling morphodynamic phenotypes and dynamic regimes of cell motion; pp. 337–358. [DOI] [PubMed] [Google Scholar]
- 38.Footer M.J., Kerssemakers J.W.J., et al. Dogterom M. Direct measurement of force generation by actin filament polymerization using an optical trap. Proc. Natl. Acad. Sci. USA. 2007;104:2181–2186. doi: 10.1073/pnas.0607052104. [DOI] [PMC free article] [PubMed] [Google Scholar]
- 39.Evans E. Probing the relation between force—lifetime—and chemistry in single molecular bonds. Annu. Rev. Biophys. Biomol. Struct. 2001;30:105–128. doi: 10.1146/annurev.biophys.30.1.105. [DOI] [PubMed] [Google Scholar]
- 40.May J.A., Ratan H., et al. Heptinstall S. GPIIb-IIIa antagonists cause rapid disaggregation of platelets pre-treated with cytochalasin D. Evidence that the stability of platelet aggregates depends on normal cytoskeletal assembly. Platelets. 1998;9:227–232. doi: 10.1080/09537109876744. [DOI] [PubMed] [Google Scholar]
- 41.Bain J., McLauchlan H., et al. Cohen P. The specificities of protein kinase inhibitors: an update. Biochem. J. 2003;371:199–204. doi: 10.1042/BJ20021535. [DOI] [PMC free article] [PubMed] [Google Scholar]
- 42.Pollard T.D. The cytoskeleton, cellular motility and the reductionist agenda. Nature. 2003;422:741–745. doi: 10.1038/nature01598. [DOI] [PubMed] [Google Scholar]
- 43.Bohnet S., Ananthakrishnan R., et al. Verkhovsky A.B. Weak force stalls protrusion at the leading edge of the lamellipodium. Biophys. J. 2006;90:1810–1820. doi: 10.1529/biophysj.105.064600. [DOI] [PMC free article] [PubMed] [Google Scholar]
- 44.Schaub S., Meister J.-J., Verkhovsky A.B. Analysis of actin filament network organization in lamellipodia by comparing experimental and simulated images. J. Cell Sci. 2007;120:1491–1500. doi: 10.1242/jcs.03379. [DOI] [PubMed] [Google Scholar]
- 45.Insall R.H. Dogma bites back—the evidence for branched actin. Trends Cell Biol. 2011;21:2. doi: 10.1016/j.tcb.2010.11.002. author reply 4–5. [DOI] [PubMed] [Google Scholar]
- 46.Higgs H.N. Discussing the morphology of actin filaments in lamellipodia. Trends Cell Biol. 2011;21:2–4. doi: 10.1016/j.tcb.2010.09.010. author reply 4–5. [DOI] [PMC free article] [PubMed] [Google Scholar]
- 47.Small J.V. Actin networking in lamellipodia and beyond. Trends Cell Biol. 2011;21:4–5. [Google Scholar]
- 48.Small J.V., Winkler C., et al. Schmeiser C. Reply: Visualizing branched actin filaments in lamellipodia by electron tomography. Nat. Cell Biol. 2011;13:1013–1014. doi: 10.1038/ncb2321. [DOI] [PMC free article] [PubMed] [Google Scholar]
- 49.Yang C., Svitkina T. Visualizing branched actin filaments in lamellipodia by electron tomography. Nat. Cell Biol. 2011;13:1012–1013. doi: 10.1038/ncb2321. author reply 1013–1014. [DOI] [PMC free article] [PubMed] [Google Scholar]
- 50.Le Goff L., Hallatschek O., et al. Amblard F. Tracer studies on f-actin fluctuations. Phys. Rev. Lett. 2002;89:258101. doi: 10.1103/PhysRevLett.89.258101. [DOI] [PubMed] [Google Scholar]
- 51.Gardel M.L., Shin J.H., et al. Weitz D.A. Elastic behavior of cross-linked and bundled actin networks. Science. 2004;304:1301–1305. doi: 10.1126/science.1095087. [DOI] [PubMed] [Google Scholar]
- 52.Isambert H., Venier P., et al. Carlier M.F. Flexibility of actin filaments derived from thermal fluctuations. Effect of bound nucleotide, phalloidin, and muscle regulatory proteins. J. Biol. Chem. 1995;270:11437–11444. doi: 10.1074/jbc.270.19.11437. [DOI] [PubMed] [Google Scholar]
- 53.McCullough B.R., Blanchoin L., et al. De la Cruz E.M. Cofilin increases the bending flexibility of actin filaments: implications for severing and cell mechanics. J. Mol. Biol. 2008;381:550–558. doi: 10.1016/j.jmb.2008.05.055. [DOI] [PMC free article] [PubMed] [Google Scholar]
- 54.Pfaendtner J., De La Cruz E.M., Voth G.A. Actin filament remodeling by actin depolymerization factor/cofilin. Proc. Natl. Acad. Sci. USA. 2010;107:7299–7304. doi: 10.1073/pnas.0911675107. [DOI] [PMC free article] [PubMed] [Google Scholar]
- 55.Kroy K., Frey E. Force-extension relation and plateau modulus for wormlike chains. Phys. Rev. Lett. 1996;77:306–309. doi: 10.1103/PhysRevLett.77.306. [DOI] [PubMed] [Google Scholar]
- 56.Gardel M.L., Nakamura F., et al. Weitz D.A. Prestressed F-actin networks cross-linked by hinged filamins replicate mechanical properties of cells. Proc. Natl. Acad. Sci. USA. 2006;103:1762–1767. doi: 10.1073/pnas.0504777103. [DOI] [PMC free article] [PubMed] [Google Scholar]
- 57.Lieleg O., Claessens M.M.A.E., Bausch A.R. Structure and dynamics of cross-linked actin networks. Soft Matter. 2010;6:218–225. [Google Scholar]
- 58.Wirtz D., Konstantopoulos K., Searson P.C. The physics of cancer: the role of physical interactions and mechanical forces in metastasis. Nat. Rev. Cancer. 2011;11:512–522. doi: 10.1038/nrc3080. [DOI] [PMC free article] [PubMed] [Google Scholar]
- 59.Abraham V.C., Krishnamurthi V., et al. Lanni F. The actin-based nanomachine at the leading edge of migrating cells. Biophys. J. 1999;77:1721–1732. doi: 10.1016/S0006-3495(99)77018-9. [DOI] [PMC free article] [PubMed] [Google Scholar]
- 60.Shaevitz J.W., Fletcher D.A. Load fluctuations drive actin network growth. Proc. Natl. Acad. Sci. USA. 2007;104:15688–15692. doi: 10.1073/pnas.0702601104. [DOI] [PMC free article] [PubMed] [Google Scholar]
- 61.Berg H. Princeton University Press; Ithaca, NY: 1983. Random Walks in Biology. [Google Scholar]
- 62.Mogilner A. Mathematics of cell motility: have we got its number? J. Math. Biol. 2009;58:105–134. doi: 10.1007/s00285-008-0182-2. [DOI] [PMC free article] [PubMed] [Google Scholar]
- 63.Bausch A.R., Ziemann F., et al. Sackmann E. Local measurements of viscoelastic parameters of adherent cell surfaces by magnetic bead microrheometry. Biophys. J. 1998;75:2038–2049. doi: 10.1016/S0006-3495(98)77646-5. [DOI] [PMC free article] [PubMed] [Google Scholar]
- 64.Yanai M., Butler J.P., et al. Higuchi H. Regional rheological differences in locomoting neutrophils. Am. J. Physiol. Cell Physiol. 2004;287:C603–C611. doi: 10.1152/ajpcell.00347.2003. [DOI] [PubMed] [Google Scholar]
- 65.Doyle A., Marganski W., Lee J. Calcium transients induce spatially coordinated increases in traction force during the movement of fish keratocytes. J. Cell Sci. 2004;117:2203–2214. doi: 10.1242/jcs.01087. [DOI] [PubMed] [Google Scholar]
- 66.Anderson K.I., Wang Y.L., Small J.V. Coordination of protrusion and translocation of the keratocyte involves rolling of the cell body. J. Cell Biol. 1996;134:1209–1218. doi: 10.1083/jcb.134.5.1209. [DOI] [PMC free article] [PubMed] [Google Scholar]
- 67.Izzard C.S., Lochner L.R. Cell-to-substrate contacts in living fibroblasts: an interference reflexion study with an evaluation of the technique. J. Cell Sci. 1976;21:129–159. doi: 10.1242/jcs.21.1.129. [DOI] [PubMed] [Google Scholar]
- 68.Jurado C., Haserick J.R., Lee J. Slipping or gripping? Fluorescent speckle microscopy in fish keratocytes reveals two different mechanisms for generating a retrograde flow of actin. Mol. Biol. Cell. 2005;16:507–518. doi: 10.1091/mbc.E04-10-0860. [DOI] [PMC free article] [PubMed] [Google Scholar]
- 69.Betz T., Lim D., Käs J.A. Neuronal growth: a bistable stochastic process. Phys. Rev. Lett. 2006;96:098103. doi: 10.1103/PhysRevLett.96.098103. [DOI] [PubMed] [Google Scholar]
- 70.Betz T., Koch D., et al. Käs J. Statistical analysis of neuronal growth: edge dynamics and the effect of a focused laser on growth cone motility. New J. Phys. 2007;9:426. [Google Scholar]
- 71.Verkhovsky A.B., Chaga O.Y., et al. Borisy G.G. Orientational order of the lamellipodial actin network as demonstrated in living motile cells. Mol. Biol. Cell. 2003;14:4667–4675. doi: 10.1091/mbc.E02-10-0630. [DOI] [PMC free article] [PubMed] [Google Scholar]
- 72.Frey E., Kroy K., et al. Sackmann E. Springer-Verlag; Berlin, Germany: 1998. Dynamical Networks in Physics and Biology. [Google Scholar]
- 73.Kroy K. Hieronymus; Munich, Germany: 1998. Viscoelasticity of Solutions of Semiflexible Polymers. [Google Scholar]
- 74.MacKintosh F.C., Käs J., Janmey P.A. Elasticity of semiflexible biopolymer networks. Phys. Rev. Lett. 1995;75:4425–4428. doi: 10.1103/PhysRevLett.75.4425. [DOI] [PubMed] [Google Scholar]
- 75.Gholami, A. 2007. Actin-Based Motility. Department of Physics, Ludwig Maximilians Universität, Munich, Germany.
- 76.Kruse K., Joanny J.F., et al. Sekimoto K. Generic theory of active polar gels: a paradigm for cytoskeletal dynamics. Eur Phys J E Soft Matter. 2005;16:5–16. doi: 10.1140/epje/e2005-00002-5. [DOI] [PubMed] [Google Scholar]
- 77.Lin C.H., Espreafico E.M., et al. Forscher P. Myosin drives retrograde F-actin flow in neuronal growth cones. Neuron. 1996;16:769–782. doi: 10.1016/s0896-6273(00)80097-5. [DOI] [PubMed] [Google Scholar]
- 78.Lin C.-H., Forscher P. Growth cone advance is inversely proportional to retrograde F-actin flow. Neuron. 1995;14:763–771. doi: 10.1016/0896-6273(95)90220-1. [DOI] [PubMed] [Google Scholar]
- 79.Zhu J., Carlsson A.E. Effects of molecular-scale processes on observable growth properties of actin networks. Phys. Rev. E s. 2010;81:031914. doi: 10.1103/PhysRevE.81.031914. [DOI] [PMC free article] [PubMed] [Google Scholar]
- 80.Schreiber C.H., Stewart M., Duke T. Simulation of cell motility that reproduces the force-velocity relationship. Proc. Natl. Acad. Sci. USA. 2010;107:9141–9146. doi: 10.1073/pnas.1002538107. [DOI] [PMC free article] [PubMed] [Google Scholar]
- 81.Lee K.-C., Liu A.J. Force-velocity relation for actin-polymerization-driven motility from Brownian dynamics simulations. Biophys. J. 2009;97:1295–1304. doi: 10.1016/j.bpj.2009.06.014. [DOI] [PMC free article] [PubMed] [Google Scholar]
- 82.Weichsel J., Schwarz U.S. Two competing orientation patterns explain experimentally observed anomalies in growing actin networks. Proc. Natl. Acad. Sci. USA. 2010;107:6304–6309. doi: 10.1073/pnas.0913730107. [DOI] [PMC free article] [PubMed] [Google Scholar]
Associated Data
This section collects any data citations, data availability statements, or supplementary materials included in this article.