

Abstract
Sarco(endo)plasmic reticulum Ca2+-ATPase (SERCA) transports two Ca2+ ions across the membrane of the sarco(endo)plasmic reticulum against the concentration gradient, harvesting the required energy by hydrolyzing one ATP molecule during each transport cycle. Although SERCA is one of the best structurally characterized membrane transporters, it is still largely unknown how the transported Ca2+ ions reach their transmembrane binding sites in SERCA from the cytoplasmic side. Here, we performed extended all-atom molecular dynamics simulations of SERCA. The calculated electrostatic potential of the protein reveals a putative mechanism by which cations may be attracted to and bind to the Ca2+-free state of the transporter. Additional molecular dynamics simulations performed on a Ca2+-bound state of SERCA reveal a water-filled pathway that may be used by the Ca2+ ions to reach their buried binding sites from the cytoplasm. Finally, several residues that are involved in attracting and guiding the cations toward the possible entry channel are identified. The results point to a single Ca2+ entry site close to the kinked part of the first transmembrane helix, in a region loaded with negatively charged residues. From this point, a water pathway outlines a putative Ca2+ translocation pathway toward the transmembrane ion-binding sites.
Introduction
Sarco(endo)plasmic reticulum Ca2+-ATPase (SERCA) transports Ca2+ ions from the cytoplasm to the lumen of the sarco(endo)plasmic reticulum (SR), e.g., to terminate muscle contraction (1). SERCA is a primary active transporter that drives Ca2+ translocation against its concentration gradient by hydrolyzing one ATP molecule per two Ca2+ ions translocated in each cycle (2). In addition, two to three protons are countertransported from the SR lumen to the cytoplasm during the full functional cycle (3). SERCA belongs to the family of P-type ATPases, which includes other physiologically important transporters such as the Na+/K+-ATPase and the H+/K+-ATPase (4). As implied by the family name, the protein becomes phosphorylated by the terminal γ-phosphate of ATP during the functional cycle (5).
SERCA is one of the best structurally characterized membrane transporters. The first structure was determined in 2000 (6) and since then, numerous high-resolution structures have become available for several different functional states (7, 8, 9), revealing key details about the transport mechanism of the protein, as recently reviewed by Møller et al. (10). The protein is composed of three cytoplasmic domains and a transmembrane (TM) domain consisting of 10 helices, here referred to as TM1–10 (Fig. 1 A). Two Ca2+ ions bind in a cooperative manner (2) to binding sites located in the middle of the TM domain. These sites are referred to as the Ca-I site (the deepest site, closer to the luminal side) and the Ca-II site, respectively. The Ca-I site is composed of residues from TM5 (Asn-768 and Glu-771), TM6 (Thr-799 and Asp-800), and TM8 (Glu-908), whereas the Ca-II site is composed of residues from TM4 (Val-304, Ala-305, Ile-307, and Glu-309) and TM6 (Asn-796 and Asp-800), as illustrated in Fig. 1 B. The cytoplasmic domains are termed the actuator (A), phosphorylation (P), and nucleotide-binding (N) domains. Binding of ATP to the N domain in the catalytic mode facilitates the bridging of the N and P domains, and the subsequent phosphorylation of the latter domain by the γ-phosphate (8). The A domain is believed to be involved in the coupling of the cytoplasmic phosphorylation and the TM domain dynamics, as the Ca2+ binding sites are positioned ∼50 Å from the site of phosphorylation.
Figure 1.
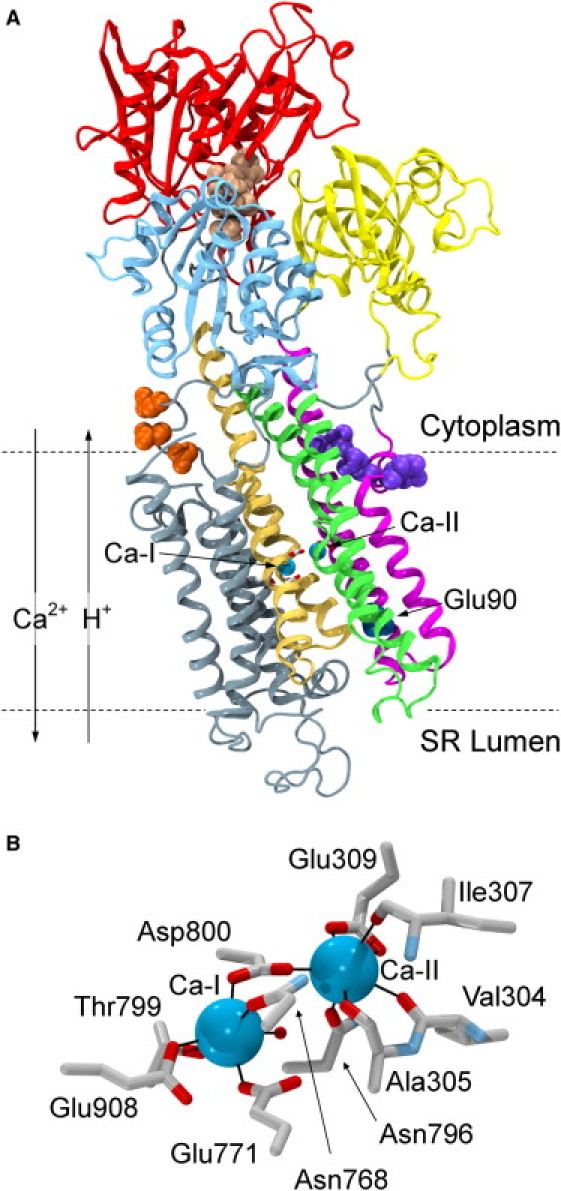
Structure of SERCA in the Ca2+/ATP bound state (PDB 1T5S (8)). (A) The N domain is shown in red, the A domain is yellow, the P domain is blue, TM1-TM2 is magenta, TM3-TM4 is green, TM5-TM6 is ochre, and TM7-TM10 and the loop regions are gray. ATP, shown in beige vdW representation, is bridging the N and P domains. Ca2+ ions (cyan) are bound in the middle of the TM domain, with the coordinating acidic residues shown in licorice, colored by atom type. Residues suggested to affect Ca2+ binding are shown in vdW representation, with Glu-55, Gln-56, Glu-59, and Glu-109 in violet; Glu-90 in dark blue (behind TM4); and Asp-813, Asp-815, and Asp-818 in orange. The approximate position of the membrane is indicated by the dotted lines, and the directions of transport of Ca2+ ions and protons are noted. (B) Close-up of the Ca2+ binding sites with the surrounding coordinating residues.
The various crystal structures of SERCA have clearly established the involvement of large protein conformational changes during the transport of the Ca2+ ions. Unfortunately, SERCA (or any other P-type ATPase) has not yet been crystallized in a cytoplasmic-open conformation that would reveal the ion translocation pathway that leads to the two Ca2+-binding sites within the TM domain. A luminal-open structure published in 2007 (9) indicates that Ca2+ ions may leave the binding sites using a pathway that runs along TM4 and passes the loop between TM5 and TM6. However, none of the solved structures to date show a clear entry pathway for the ions from the cytoplasm. Nevertheless, on the basis of structural analyses, mutagenesis experiments, and modeling studies, different Ca2+ entry points have been proposed. Early mutagenesis studies suggested that three aspartate residues in the cytoplasmic loop between TM6 and TM7 (L6-7) could form an access site for Ca2+ (11, 12) (the location is indicated in Fig. 1 A). An alternative access site was suggested by Lee and East (13) based on a structural analysis of the first published structure of SERCA (6). The access pathway suggested by Lee and East follows TM1 and is guided by Glu-55, Glu-58, and Glu-109 toward the Ca-II site. The two sites can be described as a C-terminal and an N-terminal access site, respectively. In a recently published structure of SERCA with a bound cyclopiazonic acid inhibitor, Gln-56, located in the entry region suggested by Lee and East, was shown to coordinate a Mn2+ ion together with cyclopiazonic acid (14). Based on this observation, Gln-56 has also been speculated to be involved in initial Ca2+ binding. However, mutagenesis experiments show that among the acidic residues Glu-51, Glu-55, Glu-58, and Asp-59, only the single-point mutation of Asp-59 can affect Ca2+ binding and dissociation (15). On the other hand, if the stretch of amino acids from Glu-55 to Asp-59 (excluding Phe-57; EQFED) are all mutated simultaneously to AAFAA, the relative Ca2+ transport activity is decreased (16). Although these results support the notion of an N-terminal ion access point, they are not conclusive. Glu-90 has been shown to be crucial for Ca2+ binding from both sides of the membrane (17), but this residue is located in the luminal end of TM2 (Fig. 1 A) and therefore does not provide any clues about the location of the cytoplasmic Ca2+ entry point(s).
Several modeling studies focusing on the unresolved question of Ca2+ access points have been reported (18, 19, 20). Costa and Carloni (18) used short molecular dynamics (MD) simulations (≤2 ns) of the first Ca2+-bound structure (6), as well as models of the Ca2+-free and intermediate states that were based on the Ca2+-bound state, and speculated that the ions may use both of the suggested entry points (one for each ion). Also based on short MD simulations (≤3.2 ns) of three different functional states, Fonseca et al. (20) suggested that at least the Ca-II ion enters from the TM1 side (N-terminal access site). On the contrary, Huang et al. (19) proposed that both ions first bind in the region around L6-7 and the cytoplasmic loop between TM8 and TM9, and then enter through a C-terminal pathway. In their study, MD simulations of ≤6 ns were performed on structures in which Ca2+ ions were initially manually placed inside the TM domain, approximately halfway to the binding sites. When the ions were placed closer to the cytoplasmic side, they diffused away from the TM domain (19). In addition to the disagreement among these modeling studies, none of them demonstrate the ability of these different protein regions to attract positive ions from the cytoplasm.
In this study, we performed MD simulations of both Ca2+-free and Ca2+-bound states of SERCA in a membrane, in which we focused on tracing potential Ca2+ access sites on the cytoplasmic side. The two studied structures correspond to the functional state just before the Ca2+ access channel is opened (Ca2+-free state (21)) and the state just after the access channel has been closed (Ca2+-bound state (8)), respectively (9). Because the TM5-TM10 part of the TM domain is similar in the two structures, the main structural changes that lead to Ca2+ access are expected to be within the TM1-TM4 region (the root mean-square deviation (RMSD) between the Ca2+-free and Ca2+-bound states is 6.0 Å for TM1-TM4 and 2.5 Å for TM5-TM10). In contrast to previous studies, we relied on completely unbiased and comparatively much longer (50 ns) simulations to characterize putative entry points. Our main conclusions are based on an analysis of the unbiased dynamics and residence time of cations in the simulations, the hydration patterns revealed during the simulations, and a calculation of the electrostatic potential. Because we studied the Ca2+ access sites for the Ca2+-free state and the ion access pathway for the Ca2+-bound state, the combined results are expected to form a more complete description of how the Ca2+ ions might enter the pump.
The results of the analyses for both structures (i.e., before and after Ca2+ ion binding) converge to suggest a single Ca2+ access point. The suggested access point is located in the region close to the kinked part of TM1, the N-terminal access point, where several negatively charged residues are indeed present. The simulations do not provide any other comparable Ca2+ access points; therefore, on the basis of our data, we suggest that both of the Ca2+ ions enter the transporter through a shared access point from the cytoplasm. The simulations furthermore reveal a likely path from the identified access point to the central ion-binding sites.
Methods
As starting structures for the simulations, we used two different functional states of SERCA: a Ca2+-free state and a Ca2+-bound state. For the Ca2+-free form, we used the structure of the so-called E2 state with a bound 8-O-(dodecanoyl-8-O-debutanoyltrilobolide) inhibitor, solved to a resolution of 2.65 Å (PDB 3NAL) (21). This structure corresponds to a state in which the binding sites are still occluded, and represents the functional state just before the Ca2+ ion access channel opens. The inhibitor and an Mg2+ ion were deleted, and a K+ ion, bound in a functionally important ion-binding site (22), and the crystallographically resolved water molecules were retained and included in the simulation system. For the Ca2+-bound state, we used a SERCA structure in which the protein binds two Ca2+ ions and an ATP analog (adenosine-5′-β,γ-methylene triphosphate (AMPPCP); PBD 1T5S, resolution 2.60 Å) (8). This structure corresponds to the functional state that occurs just after binding of the Ca2+ ions, in which the protein has not yet been phosphorylated (8). The ATP analog was manually converted to ATP (i.e., a carbon atom was changed to an oxygen atom) and used for further system setup together with the coordinated Mg2+ ion, the structurally bound K+ ion, the crystallographic water molecules, and the protein structure. Protonation states of ionizable residues were assessed with the use of PROPKA 2.0 (23, 24) followed by visual structural inspection. For the Ca2+-free state, Glu-309, Glu-771, and Glu-908 in the empty Ca2+-binding sites were protonated based on extensive comparative MD simulations (25). These residues were modeled as charged in the Ca2+-bound state. A disulphide bond was incorporated between Cys-876 and Cys-888 (26) for both functional states.
For each of the two functional states (Ca2+-free and Ca2+-bound), the protein was embedded in a 1-palmitoyl-2-oleoyl-sn-glycero-3-phosphocholine (POPC) bilayer of 125×130 Å2 generated using the Membrane Builder plug-in of VMD (27). POPC was previously found to be a reasonable model of the SR membrane (28). We determined the initial orientation of the protein in the membrane using the Orientations of Proteins in Membranes (OPM) database (29), and further solvated each system to a box size of 125×130×170 Å3 using the TIP3P water model (30). We added KCl using the VMD Autoionize plug-in to neutralize the systems at an ionic concentration of 0.2 M. The final systems consisted of ∼242,000 atoms.
We performed MD simulations using the NAMD2.7 program (31) with the CHARMM22 force field (32), including CMAP corrections (33), for the protein, and the CHARMM36 force field for lipids (34). Electrostatic interactions and forces were treated with the particle mesh Ewald method (35), and periodic boundary conditions were used in all of the simulations. A temperature of 310 K was retained using Langevin dynamics with a damping coefficient of 0.1 ps−1 for the equilibration of lipid tails and 0.5 ps−1 for all other stages. The Langevin piston Nosé-Hoover method (36, 37) with a piston period of 100 fs and a damping timescale of 50 fs was applied to maintain the pressure at 1 atm. The simulation time for each system was 50 ns. We evaluated the bonded interactions every 1 fs; the short-range, nonbonded interactions every 2 fs; and the full electrostatic forces every 4 fs. Snapshots were collected every 1 ps. A cutoff of 12 Å with a switching function starting at 10 Å was used for short-range, nonbonded interactions. The neighbor list, with a cutoff of 14 Å, was updated every 20 steps. Bond lengths in water molecules were kept rigid.
Before the production run, the systems were equilibrated as follows: For the Ca2+-free system, the lipid tails were first equilibrated while restraining the rest of the system by means of harmonic potentials (k = 7 kcal/mol/Å2) applied to all heavy atoms. In this stage, after 2000 steps of energy minimization, the system was subjected to 0.5 ns MD in the NVT ensemble at 310 K. In the next stage, only the protein backbone was kept harmonically restrained (k = 7 kcal/mol/Å2) and the rest of the system was free to move, first during 2000 steps of energy minimization and then during 1.5 ns of MD in the NPT ensemble. Lastly, the whole system was unrestrained and 2000 steps of energy minimization and 1.0 ns of equilibration MD in the NPT ensemble were performed. For the Ca2+-bound state, the same equilibration procedure was followed with the additional local relaxation (2000 steps of energy minimization and 10 ps of MD) around the converted ATP molecule and the nonoptimal disulphide bridge before the overall equilibration was performed.
The electrostatic potential map was calculated with the use of the PME Electrostatics plug-in (38) of VMD and averaged over 1000 snapshots evenly spaced during the 50 ns trajectory. Particle densities for K+ ions and water molecules were calculated with the VolMap Tool in VMD (27). The densities were averaged over 500 snapshots evenly spaced along the 50 ns trajectory, and to produce a smoother map, the radius scaling in VolMap was increased to 2. The residence times for water molecules in the potential entry path were calculated for 8000 snapshots evenly distributed over the 10–50 ns time span of the trajectory. The first 10 ns of the trajectory were excluded from this analysis to allow for the water pathway to stabilize before the data were collected. K+ residence percentages were defined as the fraction of the simulation time during which at least one K+ ion was within 3.5 Å of the side chain (excluding hydrogen atoms) of the residue. The employed 3.5 Å cutoff value was determined based on the calculated radial distribution functions (see examples in Fig. S1 of the Supporting Material). Residence times for K+ ions were calculated following the same definition of contact. A contact analysis between the protein and the K+ ions was performed for 10,000 snapshots spread over the 50 ns simulation.
Results
We analyzed the two 50 ns MD simulations of the Ca2+-free and Ca2+-bound states of SERCA to explore the distribution and attraction of cations, and the potential formation of hydrated pathways from the cytoplasm to the central Ca2+-binding sites. Initially, the stability of the proteins in the simulations was assessed. RMSD plots for the two simulations (one for the Ca2+-free state and one for the Ca2+-bound state) are shown in Fig. S2. The RMSD curves plateau quickly, and the TM domain, in which the Ca2+-binding sites reside, is very stable in both simulations, with RMSDs measuring ∼1 Å. The RMSD curves for the individual domains show that they are virtually unchanged during the simulation, whereas the larger overall RMSD is mainly caused by interdomain motions as described in the Results section of the Supporting Material. Overall, these measurements reflect stable proteins. Next, we explored the potential involvement of a protein-generated negative potential in the attraction of cations. We then examined the degree of occlusion of the bound Ca2+ ions to investigate whether it is possible to observe water pathways to one or both of the ion-binding sites. Finally, we turned our attention to those regions of the protein surface where cations accumulate, and to residues that are involved in direct interaction with the attracted cations. It can be speculated that these residues are of importance for Ca2+ attraction and association.
Electrostatic probing of Ca2+ attraction sites
With the aim of identifying putative Ca2+ attraction sites or entry points on the surface of SERCA, we first calculated the electrostatic potential of the protein in the Ca2+-free state. We computed the potential using snapshots taken from the entire 50 ns trajectory of the simulated system. A cross section of the electrostatic potential map that includes the strongest negative region in an ion/water-accessible region on the surface of the cytoplasm/SR membrane interface is depicted in Fig. 2. The potential clearly characterizes the most negative area as a region close to the kinked part of TM1. The calculation of the potential included everything in the system, also a close-to-physiological K+ ion presence, and thus provides the best description of the electrostatic potential experienced by Ca2+ ions in the cytoplasm. Because the strength of the observed potential is approximately three times the membrane resting potential, the resulting local electrostatic gradient is expected to have a considerable effect on the positive ions in the solution. The Ca2+ ions that approach the protein from the cytoplasm have to pass through the cross section shown in Fig. 2 to enter the TM domain and access their binding sites; therefore, it is most likely that they are attracted to the identified negative region around TM1 and enter a binding pathway from there.
Figure 2.
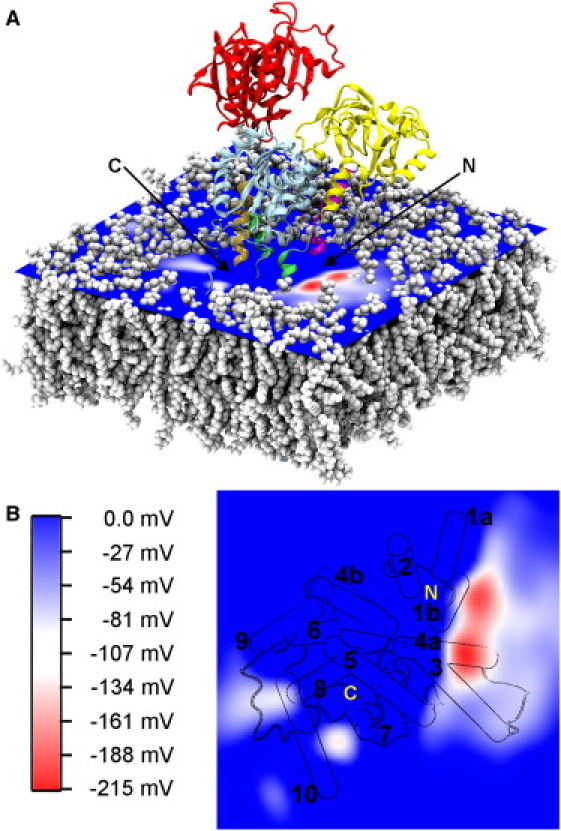
Electrostatic potential at the cytoplasmic/SR membrane interface. (A) The electrostatic potential in the membrane-cytoplasm interface region averaged for 50 ns of the simulation of the Ca2+-free state. The potential is calculated using the PME Electrostatics plug-in (38) of VMD and illustrated with a color gradient running from −215 mV to 0 mV. The most negative region is found close to the kinked part of TM1, on the TM1/TM2/TM3 side of the protein. The POPC lipid molecules are depicted in white spheres, and the protein is shown in cartoon representation with the same color code as in Fig. 1. (B) The same potential as in panel A but viewed from the cytoplasm and down on the membrane. The protein structure below the potential surface is projected onto the 2D contour plot. The TM helices are numbered on their cytoplasmic ends. The putative N- and C-terminal access regions are indicated on the figure.
Water accessibility of the Ca2+-binding sites
In the search for potential Ca2+ access points or entry pathways, we performed an MD simulation of the Ca2+-bound state of SERCA to study the dynamics of the Ca2+ ions and determine whether it was possible to identify hydrated pathways to one or both of the ion-binding sites during the simulation. The Ca2+ ions remained stably bound to their binding sites in the middle of the TM domain throughout this 50-ns simulation and did not show any sign of unbinding. Compared to the crystal structure, the only coordination lost during the simulation was between Ca-I and Thr-799(Oγ) (see Fig. S3 and Fig. S4). We examined the positions sampled by water molecules during the trajectories to characterize pathways connecting the Ca2+ binding sites to Ca2+ access point(s) and entry site(s) on the surface of the protein. Relatively early in the simulation of the Ca2+-bound state, water molecules find a pathway that extends from the cytoplasmic surface and almost to the Ca-II site, as illustrated in Fig. 3 A and Fig. S5.
Figure 3.
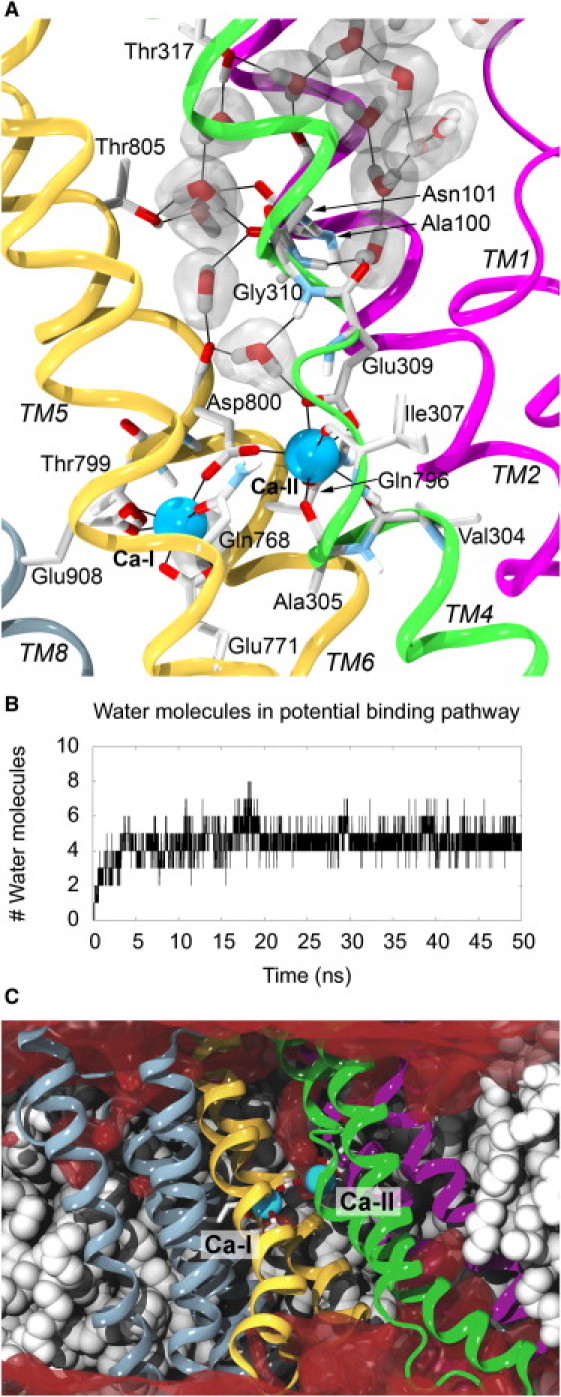
Putative Ca2+ permeation pathway. (A) Water pathway to the Ca-II site that formed during the simulation of the Ca2+-bound state. The water pathway starts at the region between TM2 and the kinked part of TM1, extends through a region between TM2 and TM4, and reaches the region just outside the Ca-II binding site with the Glu-309 and Asp-800 acidic side chains shielding the Ca2+ ion from the water molecules. The snapshot was taken at t = 6.63 ns. Hydrogen bonds as well as Ca2+ coordinations are indicated with black lines. (B) The number of water molecules in the putative Ca2+ permeation pathway stretching from the reservoir between TM2 and the kinked region of TM1 and to the Ca-II site as a function of time. (C) The water density, shown in dark red, averaged over 50 ns of the simulation of the Ca2+-bound state. The putative permeation pathway from the cytoplasm to the Ca-II site is clearly visible, whereas no other water pathways to the Ca2+ binding sites are found. POPC molecules, protein, and ions in panels A and C are represented as in Figure 1, Figure 2.
The identified hydrated pathway that connects the cytoplasm to the Ca-II site starts at the region between the kinked part of TM1 and the cytoplasmic end of TM2 (Fig. 3 A and Fig. S5). The pathway extends between TM2 and TM4, also making contacts with residues in TM6, before it reaches Glu-309, which coordinates the ion in the Ca-II site. The incoming water molecules mainly interact with main-chain amide groups and with hydrophilic side chains (Fig. 3 A). The region close to Asn-101 (TM2) and Thr-317 (TM4) opens up and allows water to penetrate the interface between these two helices. This movement of the two helices is small and therefore is not reflected in the RMSD calculations discussed above. It is also known that even though the crystal structures of SERCA in complex with Ca2+ and either AMPPCP (ATP analog) or ADP:AlF4– (transition state analog) are very similar, only the transition state analog ensures Ca2+ occlusion (8). One could therefore speculate that the structural differences between the occluded state and a more open state are relatively small, as suggested by our results, which illustrate that the seemingly occluded crystal structure opens slightly when studied in a more dynamic state. Sugita et al. (39) observed a similar water pathway to Glu-309, but did not otherwise comment on it, using a different Ca2+-bound SERCA structure without ATP bound, and focusing on luminal pathways and the effect of mutations of Glu-771 and Glu-908. Thus, the observed lack of complete occlusion is probably a general property of the Ca2+-bound and unphosphorylated functional state.
The water pathway is formed within the first 5 ns of the simulation (see Fig. 3 B), and remains open throughout the simulation. The average number of water molecules that reside in the pathway stretching from the reservoir between TM2 and the kinked region of TM1 and to the Ca-II site for the 10–50 ns time span is 4.7 (±0.7). The residence times for water molecules in the pathway (Fig. S6) show that the water molecules very often reside in the pathway for only a short time (<25 ps). However, a few water molecules are also observed to stay in the path for a more extended time (>975 ps in the histogram in Fig. S6). The longest residence time for a water molecule is close to 30 ns. Overall, the number of water molecules in the pathway is stable even though the rate of exchange of these water molecules is high.
We did not observe any water pathways to the Ca-I site, or water pathways connecting the luminal side to either of the Ca2+-binding sites. This is illustrated in Fig. 3 C, where the water density averaged over the 50 ns of the simulation is shown. The only water density reaching the Ca2+-binding sites in the Ca2+-bound state originates from the density discussed above; found to originate from the TM1 kink region, and extending between TM2 and TM4 to the Ca-II binding site. In the Ca2+-free form, water molecules are also seen to penetrate down a similar pathway, and furthermore, water molecules find a cavity between TM5, TM7, and TM8 toward the Ca-I site. The potential role of this cavity, which overlaps with the so-called C-terminal cavity identified by Karjalainen et al. (40), is discussed below.
Interactions with positive ions
As a third approach to gain information about Ca2+ access points, we studied the dynamics and distribution of cations around the protein during the MD simulations. For both Ca2+-free and Ca2+-bound simulations, the dynamics and residence time of K+ ions around the protein were used to probe surface areas of the protein that were capable of attracting positive ions. As shown in Fig. 4, K+ ions accumulate close to a crystallographically determined K+-binding site (22) in the bottom of the P domain, as expected. Additionally, high K+ densities are observed on the luminal side, e.g., in the luminal end of the putative Ca2+ exit path (9) along TM4 and close to the loop between TM5 and TM6. K+ accumulation is also observed on the cytoplasmic side of the TM domain, which may indicate the region to which Ca2+ ions will be attracted. The site of attraction on the cytoplasmic side is the region between the kinked part of TM1 and the cytoplasmic end of TM2, where K+ accumulation is observed for both the Ca2+-free and Ca2+-bound states. This is in full accordance with our conclusions based on the calculation of the electrostatic potential for the Ca2+-free state, as discussed above, and fits with the identified hydrated permeation pathway leading to the Ca2+ ions in the Ca2+-bound simulation.
Figure 4.
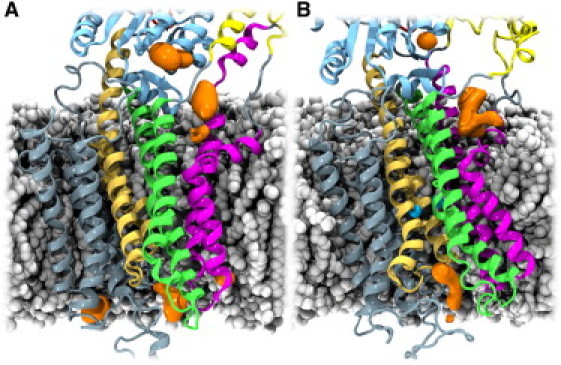
Cation-attracting regions of SERCA. The POPC molecules, protein, and ions are illustrated as in Figure 1, Figure 2. K+ ion densities, calculated with the VolMap plug-in of VMD (27), are shown in orange. For both the Ca2+-free (A) and Ca2+-bound (B) states, K+ ions accumulate in the region between the kinked part of TM1 and TM2 (density in the cytoplasmic membrane-water interface), around the crystallographically determined K+-binding site (22) in the P domain (topmost density in the figures), and along the putative luminal exit path for Ca2+ ions (9).
To pinpoint the regions of attraction, the side chains that interact directly with K+ ions for >10% of the simulation time are mapped in Fig. 5, A and B. Examples of K+ coordination are shown in Fig. 5 C. Fig. S7 illustrates the percentage of interaction time for the individual residues that were used to generate the coloring in Fig. 5 A (only percentages > 10% are included). On the luminal side, the residues that frequently interact with K+ ions are quite spread over the entire surface of the protein, but many are located close to the potential Ca2+ exit path (9). Not surprisingly, these are mainly acidic residues that interact with the positive ions. We did not perform a deeper analysis of ion interaction sites on the luminal side, because our focus is on the access sites/entry paths from the cytoplasmic side. However, it should be noted that K+ ions actually protrude relatively deep into the protein from the luminal side, reaching as far as Glu-785 for both simulated states (Fig. 5, A and B).
Figure 5.
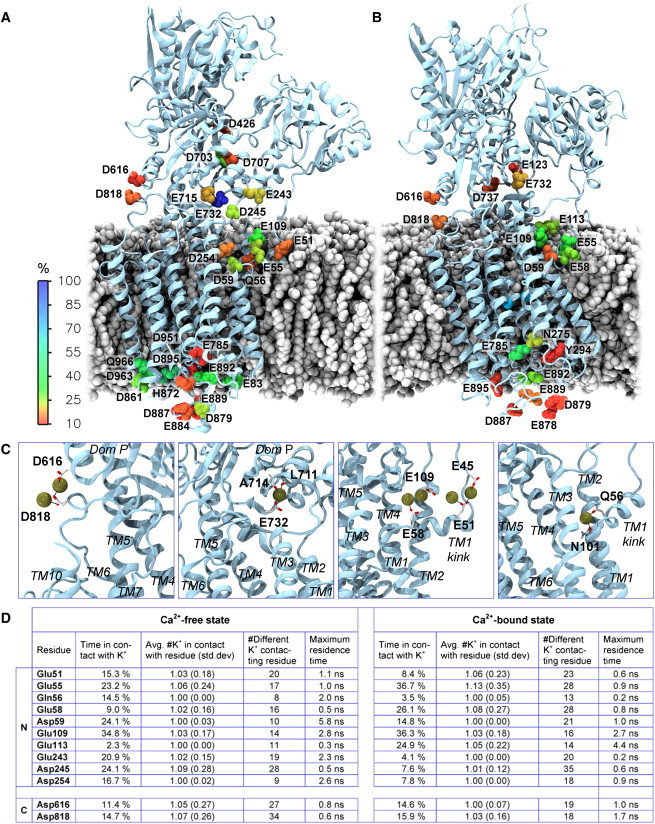
Residues that are most frequently involved in direct contact with cations. (A and B) Residues in the Ca2+-free (A) and Ca2+-bound (B) states for which at least one K+ ion is within 3.5 Å of the side chain during at least 10% of the 50 ns simulation time are shown. The residues are colored according to the percentage of time with direct interaction. The protein secondary structure is shown in light blue cartoon representation, and POPC molecules are shown as white spheres. Hydrogen atoms are not shown. (C) Examples of K+ binding to the Ca2+-free state. K+ ions are shown in brown. Distances shorter than 3 Å are marked. The K+ ion in the rightmost panel is located deep in the suggested entry region, interacting with Gln-56 and Asn-101. (D) Statistics on the interaction between protein residues and K+ ions. Residues in the putative N- and C-terminal access regions that interact with K+ for at least 10% of the simulation time are included in the analysis. Data were extracted from 10,000 snapshots distributed evenly over the 50 ns simulation time. For the calculation of the average number of K+ ions in contact with a given residue, only snapshots with K+ ion contact were used.
On the cytoplasmic side, four distinct major regions of interaction can be identified from the data. The first spot is the region close to the kinked region of TM1, where several residues contribute to the attraction of ions (Glu-51, Glu-55, Gln-56, Asp-59, Glu-109, Asp-254, and partly Glu-243 and Asp-245 for the Ca2+-free form; and Glu-55, Glu-58, Asp-59, Glu-109, and Glu-113 for the Ca2+-bound form). The fraction of time in which there is direct K+ contact for the included residues in this putative access area ranges from ∼15% to ∼35% for both states. Illustrative examples of K+ coordination by residues in this region are seen in the two rightmost snapshots of Fig. 5 C. K+ ions in contact with these residues display residence times between 0.2 ns and 5.8 ns (Fig. 5 D). Note that this region as a whole can easily interact with four K+ ions simultaneously, and that the ions can reach as deep as Asn-101, ∼10 Å from the Ca-II binding site in the crystal structure. The K+ ion with the longest residence time is found to interact directly with Asp-59, one of the residues closest to the Ca-II site.
The second site of cation attraction is close to the crystallographically determined K+-binding site. Glu-732 is the only acidic residue that is directly involved in this binding site according to the crystal structures and as illustrated in the second snapshot of Fig. 5 C, but Glu-715 and partly Glu-243 and Asp-245 are located in the same region for the Ca2+-free form. Asp-703 and Asp-707 constitute a third cation attraction site for the Ca2+-free form; however, this site is not observed in the Ca2+-bound form. This is because Asp-703 is involved in coordinating an Mg2+ ion together with the bound ATP molecule in the Ca2+-bound form. This result supports the effectiveness of our approach in using more-mobile monovalent ions to probe putative divalent ion-binding sites, because it correctly predicts the site for the Mg2+ ion. The fourth and least-occupied site (evident from the color coding, with this region being the least green) is framed by Asp-616 and Asp-818 (Fig. 5 C, leftmost snapshot) and is found in both simulated states. The fraction of time in which each of these residues makes direct contact with K+ ions is 11–16% for both residues in both states. The residence times for K+ ions in this region range from 0.6 ns to 1.7 ns (Fig. 5 D). Surprisingly, Asp-813 and Asp-815 do not show up in this analysis at all. These two residues, along with Asp-818, have been suggested to contribute to the initial attraction of Ca2+ ions based on mutational studies (11, 12).
The identified regions of interaction with K+ ions are not expected to have been affected by the initial placement of ions. All of the 123 K+ ions in the simulations were initially placed randomly in solution at least 5 Å away from the protein (except for the crystallographic K+ ion in the P-domain). Fig. 5 D includes the overall number of different K+ ions that interact with the residues in the N- and C-terminal access regions throughout the simulation. These values range between nine different K+ ions for Asp-254 in the Ca2+-free state and 35 for Asp-245 in the Ca2+-bound state. The specific interactions with the K+ ions are thus regarded as an equilibrium property of the protein and are not biased by the starting position of the K+ ions.
Discussion
All of the analyses performed here support the existence of a single Ca2+ entry point close to the kinked part of TM1. The strongest negative electrostatic potential in the interface between the membrane and cytoplasm is observed close to this region even after K+ ions accumulate in the same area, which dampens the negative potential created by the protein itself. The observed accumulation of K+ ions indicates that cations are attracted to this specific place on the cytoplasmic surface of the protein and accumulate to a much greater extent than at other cytoplasmic areas of the protein. We thus envision that Ca2+ ions in the cytoplasm are attracted by the negative potential. After being attracted by this potential, the hydrated Ca2+ ions are dynamically exchanged with the K+ ions in the access region between the TM1 kink and TM2, because the divalent Ca2+ ions will be more favorably bound in this negative region. Furthermore, the water pathway to the Ca-II site identified from the simulation of the Ca2+-bound state actually has its entrance site in this putative prebinding region. The fact that the entrance sites observed for both simulated functional states (i.e., the state before the first ion has entered and the state after the last ion has entered) coincide further supports the notion that both Ca2+ ions enter the protein from this site, and that they share both the entrance site and the binding pathway.
The Ca2+-free form shows a similar water path leading toward site II, but also a C-terminal water cavity leading toward site I. Because no cations are attracted to the mouth of the C-terminal water cavity, there is no support in our study for this region to be a Ca2+ entry pathway. However, it is possible that this water cavity could participate in forming a proton release pathway that removes excess protons from the acidic residues of the Ca2+-binding sites upon entrance of the Ca2+ ions from the N-terminal pathway, which is further supported by more-recent structural data (41).
The ability to attract cations seems to be inherent in the structure regardless of the functional state, because cation accumulation in the same region is observed for both the Ca2+-free and Ca2+-bound states. The observation of only one clear site of cation attraction is also a strong indication that both of the Ca2+ ions use the same entry point, as was previously proposed by Lee and East (13) based on a static structural analysis of the first SERCA protein structure. The binding of both Ca2+ ions from a single pathway fits with the fact that binding of Ca-II retards the exchange of Ca-I, as shown by Inesi et al. (42), who also suggested that the access to the binding sites from the putative shared pathway was gated by Glu-309. The pathway identified from the simulations in this study indeed leads to Glu-309, and thus rationalizes the above proposed mechanism.
After the first SERCA structure was solved in 2000, Toyoshima et al. (6) proposed the area between the cytoplasmic ends of helices TM2, TM4, and TM6 as a putative Ca2+ entry site. The side chains of Gln-108 and Asn-111 in the upper part of this region together with the exposed backbone oxygen atoms of Pro-309–Glu-312 and Gly-801, and the side chain of Asp-800, were proposed to form a hydrophilic pathway to the Ca2+-binding sites. The lower part of this pathway, closest to the Ca-II site, overlaps with the entry pathway identified in our study. In the entry region, however, our simulations show that cations gravitate more to the other side of TM2 (e.g., Glu-109 and Glu-113), pointing toward the kinked part of TM1. Moreover, in agreement with our results, Lee and East (13) proposed an entry pathway that differed from the one suggested by Toyoshima et al. (6) but was based on a structural analysis of the same structure. This pathway runs along TM1 and is guided by Glu-55, Glu-58, and Glu-109 to the Ca-II site. The acidic residues in positions 55, 58, and 59 are conserved in the ER/SR Ca2+-ATPase family, signifying their functional importance (13). Furthermore, Gln-56 has been speculated to be involved in constructing a pre-entry site for Ca2+ ions (14). Most of the above residues, which have been proposed to be involved in the initial Ca2+ binding, match perfectly with the residues identified here as being involved in attracting cations (i.e., Glu-51, Glu-55, Gln-56, Glu-58, Asp-59, Glu-109, Glu-113, Asp-254, and partly Glu-243 and Asp-245).
Experimental support for this Ca2+ access point is provided by mutagenesis studies of some of the residues that have been proposed to be involved in attracting the ions (15, 16). Among the residues Glu-51, Glu-55, Glu-58, and Asp-59, only the mutation of Asp-59 affects Ca2+ binding and dissociation (15). In contrast, simultaneously mutating the stretch of amino acids from Glu-55 to Asp-59 (excluding Phe-57; EQFED) to AAFAA decreases the relative Ca2+ transport activity even though single mutants of individual residues in this region do not show a markedly impaired Ca2+ transport (16). A possible interpretation of these results is that the attraction of Ca2+ ions to this entry region is a collective effect of several residues, and thus is relatively unaffected by single mutations. As noted by Lee and East (13), as long as the mutations do not physically block the putative entry pathway, it is difficult to predict the size of the effect of a single mutation. Our simulation results suggest that several amino acids in the TM1-kink/TM2 region contribute to the attraction of cations. To confirm this proposal, we would need to use a mutant with all of these negatively charged side chains removed, and we would expect the ability of such a mutant to attract and bind Ca2+ to be heavily impaired.
Some mutagenesis studies have suggested that Asp-813, Asp-815, and Asp-818 (all located in the L6-7 loop) interact with Ca2+ ions during the initial steps of Ca2+ binding (11, 12), and this does not appear to be explained by the entry point and pathway proposed in our study. However, it has been argued that even though a reduced Ca2+ binding was observed after the mutation of these residues, as well as for the double mutant D813A/D818A and the more conservative D813N/D818N mutant, the involvement of these residues in direct interaction with the Ca2+ ions is not likely, due to their large spatial separation of >20 Å from the Ca2+-binding sites (43). Additionally, because mutations in the L6-7 loop interfere with both Ca2+ binding and protein phosphorylation, these Asp residues have been proposed to be primarily important for maintaining the structural integrity of the loop (44) and thereby securing the link between the cytoplasmic domains and the TM domain, rather than being directly involved in Ca2+ binding. This interpretation of the data agrees with the results presented here, because no possible access points from the L6-7 side of the protein can be identified based on our simulations. Despite the spatial proximity of these three acidic residues in L6-7, only Asp-818, and notably not Asp-813 or Asp-815, was identified by our cation interaction analysis to have interacted with K+ ions for >10% of the simulation time. When comparing these results with the mutational data, one should also keep in mind that mutating residues that do not interact directly with the Ca2+ ions might still affect Ca2+ binding, as observed, e.g., for Glu-90, which has been shown to be crucial for Ca2+ binding from both sides of the membrane despite its location in the luminal end of TM2 (17). Thus, the mutagenesis data on Asp-813, Asp-815, and Asp-818, which cannot be directly explained by the present study, are not challenging the overall conclusions.
Concluding Remarks
The simulations of SERCA presented here characterize both a region of localized negative electrostatic potential and several acidic residues that are involved in attracting cations from the cytoplasm to the region close to the kinked part of TM1. Furthermore, water molecules are observed to form a hydrated pathway that connects this putative entry point to the Ca-II site located in the middle of the TM domain of the protein. The results support the presence of a common entry point for the two Ca2+ ions between the kinked part of TM1 and the cytoplasmic end of TM2. From this point, the ions will follow a shared pathway to their respective binding sites, probably passing between TM2 and TM4 along the way. The proposed site of cation attraction and the ion permeation pathway are supported by mutagenesis data showing that mutating a stretch of residues on the kinked part of TM1 diminishes Ca2+ transport (16). Single-point mutations of these residues do not reduce Ca2+ transport, suggesting the cation attraction to be a collective effect.
Acknowledgments
This work was supported by grants from the Aarhus Graduate School of Science, the Danish Council for Independent Research | Natural Sciences, the Danish Research Foundation, and the National Institutes of Health (grants R01-GM086749, P41-RR05969, and U54-GM087519 to E.T.). Computations were made possible through grants from the Lundbeck Foundation, the Novo Nordisk Foundation, the Carlsberg Foundation, and the Danish Center for Scientific Computing. MD simulations were performed using supercomputing resources provided through TeraGrid grant MCA06N060. M.M.'s stay at UIUC was made possible by an Eliteforsk stipend from the Danish Council for Independent Research.
Editor: Scott Feller.
Footnotes
Supporting results and seven figures are available at http://www.biophysj.org/biophysj/supplemental/S0006-3495(11)05406-3.
Contributor Information
Birgit Schiøtt, Email: birgit@chem.au.dk.
Emad Tajkhorshid, Email: emad@life.illinois.edu.
Supporting Material
References
- 1.Ebashi S., Lipmann F. Adenosine triphosphate-linked concentration of calcium ions in a particulate fraction of rabbit muscle. J. Cell Biol. 1962;14:389–400. doi: 10.1083/jcb.14.3.389. [DOI] [PMC free article] [PubMed] [Google Scholar]
- 2.Inesi G., Kurzmack M., et al. Lewis D.E. Cooperative calcium binding and ATPase activation in sarcoplasmic reticulum vesicles. J. Biol. Chem. 1980;255:3025–3031. [PubMed] [Google Scholar]
- 3.Levy D., Seigneuret M., et al. Rigaud J.L. Evidence for proton countertransport by the sarcoplasmic reticulum Ca2+-ATPase during calcium transport in reconstituted proteoliposomes with low ionic permeability. J. Biol. Chem. 1990;265:19524–19534. [PubMed] [Google Scholar]
- 4.Axelsen K.B., Palmgren M.G. Evolution of substrate specificities in the P-type ATPase superfamily. J. Mol. Evol. 1998;46:84–101. doi: 10.1007/pl00006286. [DOI] [PubMed] [Google Scholar]
- 5.Pedersen P.L., Carafoli E. Ion motive ATPases. I. ubiquity, properties, and significance to cell function. Trends Biochem. Sci. 1987;12:146–150. [Google Scholar]
- 6.Toyoshima C., Nakasako M., et al. Ogawa H. Crystal structure of the calcium pump of sarcoplasmic reticulum at 2.6 Å resolution. Nature. 2000;405:647–655. doi: 10.1038/35015017. [DOI] [PubMed] [Google Scholar]
- 7.Toyoshima C., Nomura H. Structural changes in the calcium pump accompanying the dissociation of calcium. Nature. 2002;418:605–611. doi: 10.1038/nature00944. [DOI] [PubMed] [Google Scholar]
- 8.Sørensen T.L., Møller J.V., Nissen P. Phosphoryl transfer and calcium ion occlusion in the calcium pump. Science. 2004;304:1672–1675. doi: 10.1126/science.1099366. [DOI] [PubMed] [Google Scholar]
- 9.Olesen C., Picard M., et al. Nissen P. The structural basis of calcium transport by the calcium pump. Nature. 2007;450:1036–1042. doi: 10.1038/nature06418. [DOI] [PubMed] [Google Scholar]
- 10.Møller J.V., Olesen C., et al. Nissen P. In: Lacapère J., editor. Vol. 654. Humana Press; Totowa, NJ: 2010. What can be learned about the function of a single protein from its various X-ray structures: the example of the sarcoplasmic calcium pump; pp. 119–140. (Membrane Protein Structure Determination: Methods and Protocols). [DOI] [PubMed] [Google Scholar]
- 11.Falson P., Menguy T., et al. le Maire M. The cytoplasmic loop between putative transmembrane segments 6 and 7 in sarcoplasmic reticulum Ca2+-ATPase binds Ca2+ and is functionally important. J. Biol. Chem. 1997;272:17258–17262. doi: 10.1074/jbc.272.28.17258. [DOI] [PubMed] [Google Scholar]
- 12.Menguy T., Corre F., et al. Falson P. The cytoplasmic loop located between transmembrane segments 6 and 7 controls activation by Ca2+ of sarcoplasmic reticulum Ca2+-ATPase. J. Biol. Chem. 1998;273:20134–20143. doi: 10.1074/jbc.273.32.20134. [DOI] [PubMed] [Google Scholar]
- 13.Lee A.G., East J.M. What the structure of a calcium pump tells us about its mechanism. Biochem. J. 2001;356:665–683. doi: 10.1042/0264-6021:3560665. [DOI] [PMC free article] [PubMed] [Google Scholar]
- 14.Laursen M., Bublitz M., et al. Morth J.P. Cyclopiazonic acid is complexed to a divalent metal ion when bound to the sarcoplasmic reticulum Ca2+-ATPase. J. Biol. Chem. 2009;284:13513–13518. doi: 10.1074/jbc.C900031200. [DOI] [PMC free article] [PubMed] [Google Scholar]
- 15.Einholm A.P., Vilsen B., Andersen J.P. Importance of transmembrane segment M1 of the sarcoplasmic reticulum Ca2+-ATPase in Ca2+ occlusion and phosphoenzyme processing. J. Biol. Chem. 2004;279:15888–15896. doi: 10.1074/jbc.M400158200. [DOI] [PubMed] [Google Scholar]
- 16.Clarke D.M., Maruyama K., et al. MacLennan D.H. Functional consequences of glutamate, aspartate, glutamine, and asparagine mutations in the stalk sector of the Ca2+-ATPase of sarcoplasmic reticulum. J. Biol. Chem. 1989;264:11246–11251. [PubMed] [Google Scholar]
- 17.Clausen J.D., Andersen J.P. Glutamate 90 at the luminal ion gate of sarcoplasmic reticulum Ca2+-ATPase is critical for Ca2+ binding on both sides of the membrane. J. Biol. Chem. 2010;285:20780–20792. doi: 10.1074/jbc.M110.116459. [DOI] [PMC free article] [PubMed] [Google Scholar]
- 18.Costa V., Carloni P. Calcium binding to the transmembrane domain of the sarcoplasmic reticulum Ca2+-ATPase: insights from molecular modeling. Proteins. 2003;50:104–113. doi: 10.1002/prot.10219. [DOI] [PubMed] [Google Scholar]
- 19.Huang Y., Li H., Bu Y. Molecular dynamics simulation exploration of cooperative migration mechanism of calcium ions in sarcoplasmic reticulum Ca2+-ATPase. J. Comput. Chem. 2009;30:2136–2145. doi: 10.1002/jcc.21219. [DOI] [PubMed] [Google Scholar]
- 20.Fonseca J.E., Kaya S., Rakowski R.F. Temporal and steric analysis of ionic permeation and binding in SERCA via molecular dynamic simulations. Nanotechnology. 2007;18:424022. doi: 10.1088/0957-4484/18/42/424022. [DOI] [PubMed] [Google Scholar]
- 21.Winther A.M., Liu H., et al. Møller J.V. Critical roles of hydrophobicity and orientation of side chains for inactivation of sarcoplasmic reticulum Ca2+-ATPase with thapsigargin and thapsigargin analogs. J. Biol. Chem. 2010;285:28883–28892. doi: 10.1074/jbc.M110.136242. [DOI] [PMC free article] [PubMed] [Google Scholar]
- 22.Sørensen T.L., Clausen J.D., et al. Nissen P. Localization of a K+ -binding site involved in dephosphorylation of the sarcoplasmic reticulum Ca2+ -ATPase. J. Biol. Chem. 2004;279:46355–46358. doi: 10.1074/jbc.C400414200. [DOI] [PubMed] [Google Scholar]
- 23.Li H., Robertson A.D., Jensen J.H. Very fast empirical prediction and rationalization of protein pKa values. Proteins. 2005;61:704–721. doi: 10.1002/prot.20660. [DOI] [PubMed] [Google Scholar]
- 24.Bas D.C., Rogers D.M., Jensen J.H. Very fast prediction and rationalization of pKa values for protein-ligand complexes. Proteins. 2008;73:765–783. doi: 10.1002/prot.22102. [DOI] [PubMed] [Google Scholar]
- 25.Musgaard M., Thøgersen L., Schiøtt B. Protonation states of important acidic residues in the central Ca2+-ion binding sites of the Ca2+-ATPase — a molecular modeling study. Biochemistry. 2011;50:11109–11120. doi: 10.1021/bi201164b. [DOI] [PubMed] [Google Scholar]
- 26.Daiho T., Yamasaki K., et al. Suzuki H. Mutations of either or both Cys876 and Cys888 residues of sarcoplasmic reticulum Ca2+-ATPase result in a complete loss of Ca2+ transport activity without a loss of Ca2+-dependent ATPase activity. J. Biol. Chem. 2001;276:32771–32778. doi: 10.1074/jbc.M101229200. [DOI] [PubMed] [Google Scholar]
- 27.Humphrey W., Dalke A., Schulten K. VMD: visual molecular dynamics. J. Mol. Graph. 1996;14:33–38. doi: 10.1016/0263-7855(96)00018-5. [DOI] [PubMed] [Google Scholar]
- 28.Sonntag Y., Musgaard M., et al. Thøgersen L. Mutual adaptation of a membrane protein and its lipid bilayer during conformational changes. Nat. Commun. 2011;2:304. doi: 10.1038/ncomms1307. [DOI] [PubMed] [Google Scholar]
- 29.Lomize M.A., Lomize A.L., et al. Mosberg H.I. OPM: orientations of proteins in membranes database. Bioinformatics. 2006;22:623–625. doi: 10.1093/bioinformatics/btk023. [DOI] [PubMed] [Google Scholar]
- 30.Jorgensen W.L., Chandrasekhar J., et al. Klein M.L. Comparison of simple potential functions for simulating liquid water. J. Chem. Phys. 1983;79:926–935. [Google Scholar]
- 31.Phillips J.C., Braun R., et al. Schulten K. Scalable molecular dynamics with NAMD. J. Comput. Chem. 2005;26:1781–1802. doi: 10.1002/jcc.20289. [DOI] [PMC free article] [PubMed] [Google Scholar]
- 32.MacKerell A.D., Jr., Bashford D., et al. Karplus M. All-atom empirical potential for molecular modeling and dynamics studies of proteins. J. Phys. Chem. B. 1998;102:3586–3616. doi: 10.1021/jp973084f. [DOI] [PubMed] [Google Scholar]
- 33.Mackerell A.D., Jr., Feig M., Brooks C.L., 3rd Extending the treatment of backbone energetics in protein force fields: limitations of gas-phase quantum mechanics in reproducing protein conformational distributions in molecular dynamics simulations. J. Comput. Chem. 2004;25:1400–1415. doi: 10.1002/jcc.20065. [DOI] [PubMed] [Google Scholar]
- 34.Klauda J.B., Venable R.M., et al. Pastor R.W. Update of the CHARMM all-atom additive force field for lipids: validation on six lipid types. J. Phys. Chem. B. 2010;114:7830–7843. doi: 10.1021/jp101759q. [DOI] [PMC free article] [PubMed] [Google Scholar]
- 35.Darden T., York D., Pedersen L. Particle mesh Ewald: an N·log(N) method for Ewald sums in large systems. J. Chem. Phys. 1993;98:10089–10092. [Google Scholar]
- 36.Feller S.E., Zhang Y., et al. Brooks B.R. Constant pressure molecular dynamics simulation: the Langevin piston method. J. Chem. Phys. 1995;103:4613–4621. [Google Scholar]
- 37.Martyna G.J., Tobias D.J., Klein M.L. Constant pressure molecular dynamics algorithms. J. Chem. Phys. 1994;101:4177–4189. [Google Scholar]
- 38.Aksimentiev A., Schulten K. Imaging α-hemolysin with molecular dynamics: ionic conductance, osmotic permeability, and the electrostatic potential map. Biophys. J. 2005;88:3745–3761. doi: 10.1529/biophysj.104.058727. [DOI] [PMC free article] [PubMed] [Google Scholar]
- 39.Sugita Y., Ikeguchi M., Toyoshima C. Relationship between Ca2+-affinity and shielding of bulk water in the Ca2+-pump from molecular dynamics simulations. Proc. Natl. Acad. Sci. USA. 2010;107:21465–21469. doi: 10.1073/pnas.1015819107. [DOI] [PMC free article] [PubMed] [Google Scholar]
- 40.Karjalainen E.L., Hauser K., Barth A. Proton paths in the sarcoplasmic reticulum Ca2+-ATPase. Biochim. Biophys. Acta. 2007;1767:1310–1318. doi: 10.1016/j.bbabio.2007.07.010. [DOI] [PubMed] [Google Scholar]
- 41.Bublitz M., Musgaard M., et al. Nissen P. A C-terminal pathway in the calcium pump. XXII Congress and General Assembly of the International Union of Crystallography. Acta Crystallogr. A. 2011;67:C743. (Abstr.) [Google Scholar]
- 42.Inesi G., Ma H., et al. Xu C. Ca2+ occlusion and gating function of Glu309 in the ADP-fluoroaluminate analog of the Ca2+-ATPase phosphoenzyme intermediate. J. Biol. Chem. 2004;279:31629–31637. doi: 10.1074/jbc.M403211200. [DOI] [PubMed] [Google Scholar]
- 43.Zhang Z., Lewis D., et al. Toyoshima C. Detailed characterization of the cooperative mechanism of Ca2+ binding and catalytic activation in the Ca2+ transport (SERCA) ATPase. Biochemistry. 2000;39:8758–8767. doi: 10.1021/bi000185m. [DOI] [PubMed] [Google Scholar]
- 44.Zhang Z., Lewis D., et al. Toyoshima C. The role of the M6-M7 loop (L67) in stabilization of the phosphorylation and Ca2+ binding domains of the sarcoplasmic reticulum Ca2+-ATPase (SERCA) J. Biol. Chem. 2001;276:15232–15239. doi: 10.1074/jbc.M010813200. [DOI] [PubMed] [Google Scholar]
Associated Data
This section collects any data citations, data availability statements, or supplementary materials included in this article.