

Abstract
Visualizing the three-dimensional structures of a protein during its biological activity is key to understanding its mechanism. In general, protein structure and function are pH-dependent. Changing the pH provides new insights into the mechanisms that are involved in protein activity. Photoactive yellow protein (PYP) is a signaling protein that serves as an ideal model for time-dependent studies on light-activated proteins. Its photocycle is studied extensively under different pH conditions. However, the structures of the intermediates remain unknown until time-resolved crystallography is employed. With the newest beamline developments, a comprehensive time series of Laue data can now be collected from a single protein crystal. This allows us to vary the pH. Here we present the first structure, to our knowledge, of a short-lived protein-inhibitor complex formed in the pB state of the PYP photocycle at pH 4. A water molecule that is transiently stabilized in the chromophore active site prevents the relaxation of the chromophore back to the trans configuration. As a result, the dark-state recovery is slowed down dramatically. At pH 9, PYP stops cycling through the pB state altogether. The electrostatic environment in the chromophore-binding site is the likely reason for this altered kinetics at different pH values.
Introduction
The water-soluble photoreceptor photoactive yellow protein (PYP) from Halorhodospira (formerly Ectothiorhodospira) halophila shares a common structural motif with the PAS domain family, which is used by various organisms to receive and transduce various kinds of signals (1, 2, 3). The p-coumaric acid chromophore in PYP is responsible for its yellow color and is covalently attached to the cysteine at position 69 (4). PYP enters a reversible photocycle after its chromophore absorbs a blue light photon. The activated protein in this photocycle initiates the signaling machinery, which may help the bacterium to move away from sunlight (5, 6, 7). The PYP photocycle has been studied extensively with a variety of time-resolved techniques, such as UV-VIS absorption spectroscopy, Fourier transform infrared spectroscopy, NMR, and Laue crystallography (8, 9, 10, 11, 12, 13, 14, 15, 16, 17). In the dark state (pG), the phenolate oxygen of the chromophore is deprotonated and hydrogen-bonded to the active-site side chains of Tyr-42 and Glu-46 (18, 19). A simplified scheme of the PYP photocycle is presented in Fig. 1.
Figure 1.
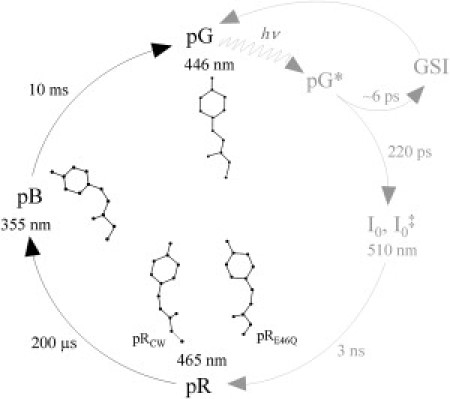
Simplified PYP photocycle at room temperature and neutral pH. Intermediates GSI, I0, and I0‡ are populated on the picosecond timescale. The pR intermediate is populated within a few nanoseconds and has a red-shifted (465 nm) absorption maximum compared with the dark state (446 nm). The pR state consists of two conformations: pRE46Q and pRCW. Further rotation of the phenolate moiety forms the pB intermediate, with blue-shifted absorption (355 nm). The pB state relaxes back to the dark-state pG on the millisecond timescale.
The PYP photocycle starts with early, short-lived intermediates on the picosecond timescale (20, 21) (Fig. 1). These early intermediates feature a trans to cis isomerization of the chromophore. They decay in a few nanoseconds to form the first long-lived intermediate pR, with red-shifted absorption (465 nm compared with 446 nm for the dark state). In ∼200 μs pR converts to the second long-lived intermediate pB, with blue-shifted absorption (355 nm). The pB state finally reverts to the initial, dark pG state on the millisecond timescale. Studies of the PYP photocycle under various pH conditions are based on spectroscopic methods. By altering the pH, investigators can gain key insights into the mechanism of transition of intermediates (10, 11, 22). However, how the pH affects the structures of the intermediates and, as a result, their kinetics remains elusive and speculative. Time-resolved crystallography (23) provides direct structural information on the atomic length scale and with a time resolution as high as ∼100 ps. Laue diffraction studies of the PYP photocycle have shown that the pR state consists of two different structural species (pRE46Q and pRCW) that form in parallel after the decay of the early intermediates (12, 24). In pRCW, the hydrogen bonds of the chromophore phenolate oxygen with Glu-46 and Tyr-42 are retained (12). In pRE46Q, the hydrogen bond of the chromophore phenolate oxygen with Glu-46 is broken, and that with Tyr-42 is retained (12). Both pRCW and pRE46Q convert after several 100 μs to the long-lived, blue-shifted intermediate pB (also denoted I2 or PYPm) (12). The hydrogen bonds with Tyr-42 and Glu-46 are broken in this intermediate, and the chromophore ring moiety is rotated. The phenolate oxygen is exposed to the solvent, and Arg-52 is ejected into the solvent. The chromophore protonation in the pB state seems to be the reason for its blue-shifted absorption and has been proposed to occur from the carboxyl side chain of Glu-46 (7, 18). However, studies of the E46Q mutant show that the chromophore protonation and Glu-46 deprotonation are independent events (25), which suggests that the chromophore proton in pB is obtained from the solvent. At the end of the photocycle, with the dark-state pG formation, the chromophore reestablishes the initial hydrogen-bond configuration with Tyr-42 and Glu-46 and reisomerizes to the trans configuration. The protein structure relaxes back to the dark-state conformation. The protonation and deprotonation of the chromophore and carboxyl side chain of Glu-46, respectively, cause the photocycle and subsequently the protein activity to be pH- and salt-dependent (10, 11, 22). Low-pH conditions have been suggested to accelerate the first half of the photocycle (i.e., the pR to pB transition) and decelerate the second half of the photocycle (i.e., the pB to pG transition) (10, 26). On the other hand, high-pH conditions decelerate both the first half (i.e., the pR to pB transition) and the second half of the photocycle (i.e., the pB to pG transition) (10, 26).
Here, we employ time-resolved crystallography to elucidate the structural basis for the pH dependence. Recent advances in the beamline design, automation, and performance of the BioCARS 14-ID beamline at Argonne National Laboratory (27) allowed us to collect a comprehensive time series from only one crystal (28). We are now able to systematically vary another parameter (in this case, the pH). The structures of photocycle intermediates at acidic and basic pH values are reported here in concert with their kinetics. We base our analysis on a singular value decomposition (SVD) of the time-resolved x-ray data (29, 30, 31), from which we extract the lifetimes and structures of the intermediates at pH 4, pH 7, and pH 9.
Materials and Methods
A detailed description of the materials and methods used in this study can be found in the Supporting Material. In brief, PYP crystals were soaked in stabilization buffer at pH 4, 7, and 9, and mounted in capillaries for diffraction experiments at 25°C. Time-resolved Laue data were collected at the Advanced Photon Source at the BioCARS 14-IDB beamline (27) using an Opolette HEII (Opotek) nanosecond laser to initiate the photocycle. A time series spanning the slower part of the photocycle (Fig. 1) plus the dark state as a reference, each at a different pH value, was collected on one crystal. The time-resolved Laue data were processed by Precognition/Epinorm (RenzResearch). Weighted difference electron density maps Δρt were calculated on the absolute scale. The difference maps were analyzed by SVD (15, 29, 30, 32, 33, 34), and the relaxation times τi of the kinetics were determined. The maps in the respective pR and pB regions were averaged. The average was Fourier-inverted to yield time-independent difference structure factors ΔFtind for pR and pB. From these results, extrapolated structure factors were calculated. The pR and pB structures were modeled into the extrapolated conventional maps, and the atomic models were refined against the extrapolated structure factor amplitudes using the program-suite termed Crystallography & NMR System (CNS) (35). By combining model phases with the time-independent difference amplitudes | ΔFtind|, we were able to calculate new extrapolated structure factors and extrapolated maps, and obtain better models from the refinement.
In time-resolved diffraction experiments, each time-dependent difference electron density map Δρt in a time series may consist of a mixture of two or more intermediates. The extent of this mixture depends on the underlying chemical kinetic mechanism. Once the structures of the intermediates are known, one can fit the observed time-dependent Δρt by calculated time-dependent difference electron densities using posterior analysis (15, 29). This procedure is also outlined in the Supporting Material. For the fit, we assumed a simplified kinetic mechanism consisting of two intermediates (pR and pB) and three rate coefficients kj (Fig. 2 A). The pR state consists of two alternate conformations of the chromophore pocket residues corresponding to the pRCW and pRE46Q structures (12). From the refined rate coefficients of the mechanism, we calculated the concentration profiles of the intermediates.
Figure 2.
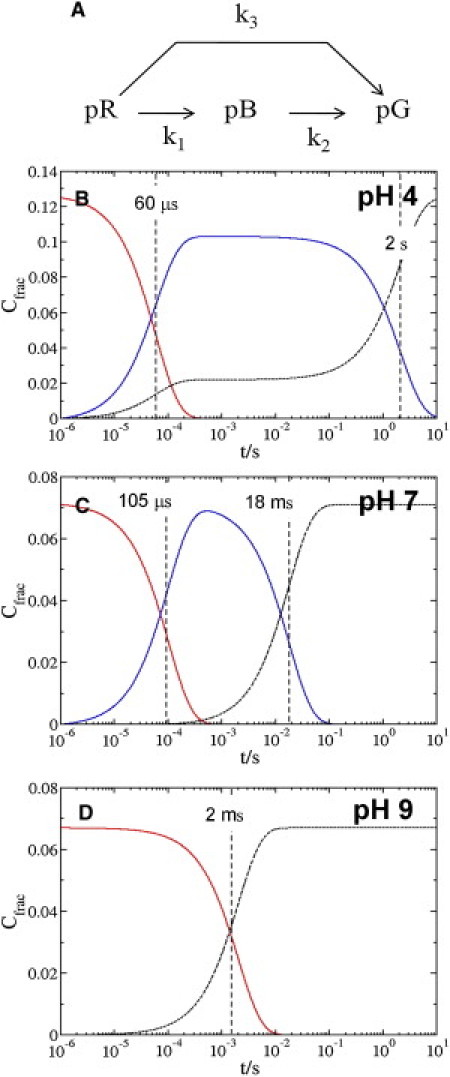
Chemical kinetic mechanism and concentration profiles at pH 4, pH 7, and pH 9. (A) The kinetic mechanism used for the posterior analysis. (B–D) Relative concentrations of the intermediates pR (red), pB (blue), and pG (black) after posterior analysis at pH 4 (B), pH 7 (C), and pH 9 (D). Relaxation times τP (dashed vertical lines) were calculated from rate coefficients.
The atomic coordinates and time-resolved structure factor amplitudes have been deposited in the Protein Data Bank with accession numbers 3UMD and 3UME for the pB intermediate at pH 4 and pH 7, respectively.
Results
Data collection statistics for the three crystals at pH 4, pH 7, and pH 9 are shown in Table S1, A–C. Completeness of the data for all crystals was considered acceptable at 1.6 Å and excellent at 1.8 Å. We limited our analysis to 1.8 Å. Rmerge on |F|2 is ∼4.5% for pH 7, <6% for pH 4, and ∼5% for pH 9, demonstrating the excellent quality of the Laue data. Because the data for the dark state and all of the time points were collected from a single crystal at each pH, they are homogeneous in completeness and Rmerge. After SVD of the time-dependent difference maps, the right singular vectors (RSVs) show two relaxation processes at pH 4, pH 7, and pH 9 (Fig. 3). Note that at pH 7, there might be a small third phase (Fig. 3 B), and at pH 9 the second relaxation process is barely present (Fig. 3 C). The RSVs were fit globally by a sum of two exponentials (Fig. 3), except at pH 7, where an attempt was made to fit three exponentials. The relaxation times τ1 and τ2 obtained from this fit correspond to pR and pB, respectively (12).
Figure 3.
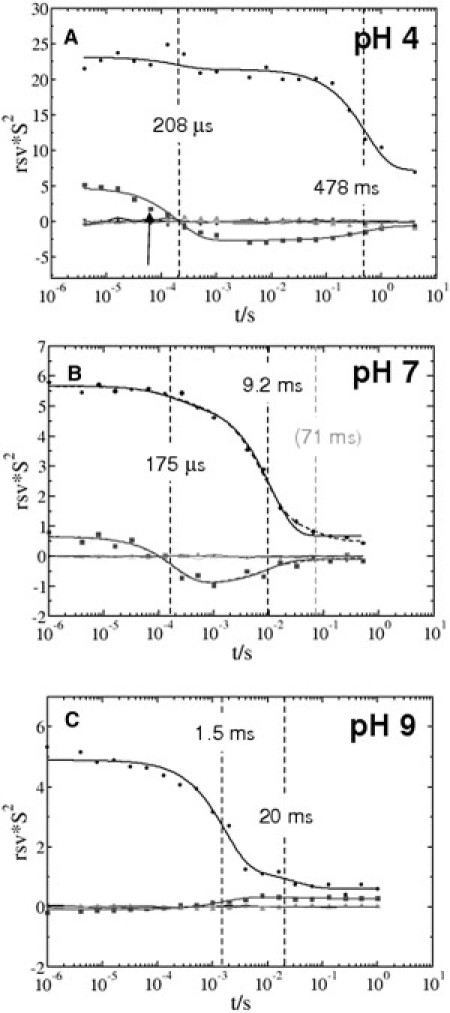
RSVs resulting from SVD of time-dependent difference density maps plotted against the pump-probe time delays. Two significant vectors were fitted using two exponentials (corresponding to the relaxations of two intermediates) at pH 4 (A), pH 7 (B), and pH 9 (C). The first RSV is represented by circles, and the second is represented by squares. The relaxation times of the pR (τ1) and pB (τ2) states determined by the fit are marked by vertical dashed lines. Dashed line in panel A: At pH 7, the two RSVs were fitted by a sum of three exponentials, indicating a third intermediate (pB2) at very low occupation with τ1 = 71 ms (gray dashed vertical line).
Averaged difference maps and extrapolated electron density maps of intermediates
We confined our analysis of the difference electron density maps to the chromophore region. The SVD analysis (30) performed on the difference maps of pH 4, pH 7, and pH 9 gives two significant singular values for each pH (Fig. 3, A–C). The two RSVs corresponding to these significant values give the temporal variations of the two corresponding LSVs. The fit of the exponential function to these RSVs is plotted against the time points for each pH (Fig. 3). We calculated the average difference maps of the pR and pB states using the difference maps that correspond to structurally homogeneous time points for pH 4 and pH 7, as described in Materials and Methods. From Fig. 3, one can identify the time points at which the signal remains temporally and locally constant, and corresponds to pure pR and pB states. Identical difference maps (not shown) can also be obtained by fitting a kinetic model to the RSVs and projecting the LSVs to the intermediate states (30). However, averaging the maps directly from the time courses has the advantage of preserving the absolute scale.
Extrapolated electron density maps representing pR and pB intermediates are shown in Figure 4, Figure 5 for pH 7 and pH 4, respectively. These maps were obtained by adding a multiple Nc of difference structure factors (ΔFtind) to the calculated dark-state structure factors (Fdcalc; see Fig. S1). To determine Nc, we plotted the integrated negative electron density below the −0.5σ level against N. At pH 7, for example, the negative electron density appears to increase excessively after N∼15 in the case of pR, and N∼25 in the case of pB. Therefore, we used 15 × ΔFtind for pR, and 25 × ΔFtind for pB. After modeling and refinement were completed, we recalculated new difference maps and extrapolated maps for pR and pB using improved phases φnew. The final pR and pB models were obtained after an additional round of refinement as described above. The refined pR and pB models are also shown in Figs. 4 (pH 7) and 5 (pH 4).
Figure 4.
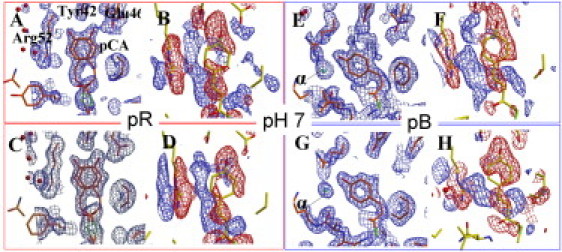
Extrapolated and difference electron density maps at pH 7. (A–D, left panels) pR. (E–H, right panels) pB. Extrapolated electron density maps (blue contour lines in A, C, E, and G) are contoured at the 1σ level. Atomic models of intermediate states are depicted in orange. Difference electron density maps (blue contour lines for positive, and red contour lines for negative difference electron density in B, D, F, and H) are contoured at ±4σ. The dark-state (pG) model is shown in yellow. (A and E) Extrapolated maps before phase improvement. (C and G) Phase-improved extrapolated maps calculated with φnew. (B and F) Difference maps before phase improvement. (D and H) Phase-improved difference maps calculated with φnew. The (difference) electron density feature α is indicated by the arrow in E and G.
Figure 5.
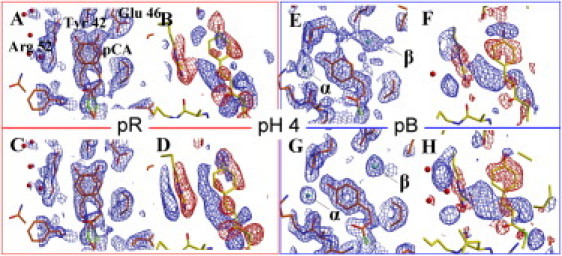
Extrapolated and difference electron density maps at pH 4. (A–D, left panels) pR. (E–H, right panels) pB. Extrapolated electron density maps (shown in blue in A, C, E, and G) are contoured at the 1σ level. Atomic models of intermediate states are shown in orange. Difference electron density maps (with positive density shown in blue, and negative shown in red in B, D, F, and H) are contoured at ±4σ. The dark-state (pG) model is shown in yellow. (A and E) Extrapolated maps before phase improvement. (C and G) Phase-improved extrapolated maps calculated with φnew. (B and F) Difference maps before phase improvement. (D and H) Phase-improved difference maps calculated with φnew. The (difference) electron density features α and β are indicated by the arrows.
At pH 9, the amplitude of the second RSV is very small. Only one process is clearly identified with a τ of 1.5 ms (Fig. 3 C). The second process as observed at pH 4 and pH 7 (Fig. 3, A and B) is barely visible. Nevertheless, we attempted to extract the time-independent difference electron density maps of both pR and pB at pH 9 directly from the SVD analysis (30) using a simple sequential model with two rate coefficients. The results are shown in Fig. S2. For pR, an extrapolated electron density map was calculated from the SVD-extracted difference map, and the atomic model of pR was determined and refined as described for the other pHs. For pB, the signal/noise ratio in the difference map was too low to obtain a meaningful extrapolated map. There is some signal on the chromophore foot and also on Arg-52 that may indicate the presence of some pB at very low occupancy. At this level, the refinement of a pB structure from the pH 9 data is not feasible. Therefore, for a subsequent kinetic analysis at pH 9, we used the pB structure refined at pH 7 together with the pR structure determined from the pH 9 data.
Structural analysis of intermediates at pH 4, pH 7, and pH 9
The data collection and refinement statistics are very similar for all pH values, and are shown in Table S2 for the pR and pB states at pH 4. Our pR intermediate consists of two previously reported distinct conformations (pRCW and pRE46Q) (12) (Figure 4, Figure 5). Differences in the relative occupancy of pRCW and pRE46Q are observed in the pR state (Table S2). In pRCW, the hydrogen bond of the phenolate oxygen of the chromophore with Tyr-42 and Glu-46 is preserved with distances of 2.9 Å and 2.7 Å, respectively, at the neutral pH; 2.8 Å for both at pH 4; and 2.9 Å for both at pH 9. In pRE46Q, the hydrogen bond with Glu-46 is broken, whereas it is preserved with Tyr-42 with a distance of 2.8 Å at all pH values. In the pB state, the hydrogen bonds to both Tyr-42 and Glu-46 are broken. The chromophore head is exposed to the solvent, and Arg-52 is ejected into the solvent.
On inspection of the extrapolated and difference density maps of the pB state, a previously unobserved feature is detected close to the chromophore phenolic oxygen (feature α in Figure 4, Figure 5). This feature is observed in the pB state at both the neutral and low pH. We interpret this feature as a water molecule that is hydrogen-bonded to the phenolate oxygen of the chromophore. The hydrogen-bond distances are 2.6 Å at pH 7 and 2.8 Å at pH 4. Most notably, and unexpectedly, another large electron density feature appears in the chromophore pocket of pB near Glu-46 and Tyr-42 at pH 4 only (feature β in Fig. 5, E and G). We interpret this feature as an additional water molecule. This water molecule is hydrogen-bonded to Tyr-Oη (2.7 Å), and weakly hydrogen-bonded to Glu-46 Oε1 (3.3 Å).
Kinetic mechanism
The relaxation times obtained from the RSV fit of the SVD analysis are shown in Table 1. No significant differences are observed for the relaxation times of the pR state at pH 4 (208 μs) and pH 7 (175 μs). However, this relaxation time is significantly slower at pH 9 (1.5 ms). The relaxation time for the pB to dark-state transition is >52-fold longer at pH 4 (478 ms) than at the neutral pH (9.2 ms).
Table 1.
Relaxation times and rate coefficients
| Relaxation times | pH = 4 | pH = 7 | pH = 9∗ |
|---|---|---|---|
| τ1 | 208 (±12) μs | 175 (±8) μs | 1.5 (±0.1) ms |
| τ2 | 478 (±0.2) ms | 9.2 (±0.2) ms | 20 (±0.1) ms |
| Rate coefficients | |||
| k1 | 13800 (±3.12) s−1 | 9730 (± 9.58) s−1 | 0.0 |
| k2 | 0.475 (±0.002) s−1 | 55.8 (±1.02) s−1 | 0.0 |
| k3 | 2940 (±5.62) s−1 | 0 | 494 (±51.5) s−1 |
| τP (from rate coefficients) | |||
Relaxation times τ1 and τ2 for pR and pB states, respectively, for the three different pH conditions as derived from the fit to the RSVs of the SVD analysis (see also Fig. 3, vertical lines). The rate coefficients are obtained from the posterior analysis for pH 4, pH 7, and pH 9. The relaxation times τP are calculated from the rate coefficients as indicated (see also Fig. 2).
At this level of pB occupation, refinement of k1 and k2 is not possible.
We performed a posterior analysis (15) using the experimental difference electron density maps, the calculated time-independent difference electron density of the intermediates, and a candidate chemical mechanism (see Material and Methods, and Fig. 2 A). The kinetic model used in this case is a simple three-state model (a dark state and two intermediates) that employs three rate coefficients, one of which provides a direct route from pR to pG. At all pH values, we obtained a consistent fit using this mechanism. At pH 7, the rate coefficient k3 is much smaller than k1 (Table 1). Consequently, the path from pR directly to pG is irrelevant at pH 7 (Fig. 2 C). In contrast, at pH 4, the rate coefficient k3 is >20% of k1. A fraction of the molecules relaxes directly from pR to pG (Fig. 2 B). At pH 9, the low occupation of pB did not allow refinement of k1 and k2. The rate coefficient k3 is 494 s−1 (Table 1). Consequently, pR decays mainly directly to pG, and pB is essentially absent at pH 9 (Fig. 2 D).
We checked the multiplication factor Nc (used to generate the extrapolated structure factors) for consistency with our kinetic analysis. The time points used to obtain the averaged pB difference map at pH 7 are 1 ms and 4 ms, where the concentration of pB decreases with time (Fig. 3 B). The time points used to obtain the averaged pR difference map at this pH are 1 μs, 4 μs, and 8 μs, where the pR concentration is constant. As a consequence, Nc is larger for pB than for pR at pH 7. At pH 4, the time points used to obtain the averaged pB difference map are 1 ms, 4 ms, and 8 ms, where the concentrations are constant with time (Fig. 3 A). However, because a significant fraction of molecules revert directly from pR to pG at this pH, the peak concentration of molecules is lower in the pB state than in the pR state. As a result, Nc is also larger for pB than for pR at pH 4. This is consistent with the concentration profile of pR and pB states calculated from our kinetic analysis at both pH 4 and pH 7 (Fig. 2, A and B).
Discussion
A significant 52-fold increase in the second relaxation time (τ2) at pH 4 compared with the neutral pH agrees with studies that suggested that the pB relaxation slows down with acidification (8, 10, 22). The pB state persists for a much longer time at low pH compared with neutral pH. The relaxation time τ2 for the pB to pG transition at neutral pH (9.2 ms) is in agreement with previous crystallographic studies (12, 28), but it is comparatively faster than that observed in solution (9, 36). These differences were also reported previously (37, 38) and attributed to intermolecular contacts in the crystal lattice. Earlier time-resolved studies on PYP at pH 7 (12) revealed a second pB phase, denoted pB2, that was occupied to a lesser extent than pB1. The structures of pB1 and pB2 are identical in the chromophore region, and differ only with regard to the N-terminus. Here, only the chromophore region is subject to the SVD where pB1 and pB2 are identical, and consequently we only observe two significant singular values and vectors. The phase at 71 ms may be an indication of pB2.
The appearance of the electron density features α and β (Figure 4, Figure 5), which are attributed to water molecules, is an important result of our experiment. Feature α outside the chromophore pocket (Figure 4, Figure 5, E and G), was observed previously but was interpreted as double conformation of Arg-52 (12, 15). Because of the superior quality of the data collected at the recently upgraded Laue beamline at BioCARS (27), we were able to change this interpretation. However, of most importance, the solvent molecule corresponding to the feature β in Fig. 5, E and G, is only observed in pB at pH 4. This water is hydrogen-bonded to Tyr-42 and Glu-46. This observation is in agreement with the previous Fourier transform infrared studies at neutral pH (Fig. 4 of Brudler et al. (9)) and pH 5 (Fig. 4 a of Shimizu et al. (39)). The 1759 cm−1 and 1747 cm−1 peaks for pH 7 and pH 5, respectively, belong to the carboxyl group of Glu-46. The peak at 1759 cm−1 shifts to 1747 cm−1 once the pH is lowered. This can be explained by the appearance of the water molecule we observe here. The presence of water increases the hydrophilic environment near Glu-46 at low pH. A hydrogen bond from a solvent molecule to Glu-46 residue was previously proposed for the intermediate spectral form of PYP (40); however, this was attributed to the effects of temperature and the chaotrope-dependent partial denaturation of PYP.
The water molecule corresponding to the other electron density feature, α, in Figure 4, Figure 5 is present outside the pocket. It is hydrogen-bonded to the phenolate oxygen of the chromophore in the pB state. This water is observed at both pH 7 and pH 4. The previously reported absorption maximum of the pB state in the denatured form (340 nm) is blue-shifted by 15 nm compared with the native form (355 nm) (7, 41). Studies on the pCT− analog of the cinnamoyl chromophore without a protein environment have shown that a blue shift of ∼60 nm occurs when the solvent is changed from dimethylformamide (aprotic) to water (protic) (42). This change was proposed to be due to the formation of two hydrogen bonds to the phenolate oxygen, affecting the electronic transitions in the chromophore. Thus, the blue shift of the pB state indicates the presence of a hydrogen bond to the chromophore phenolate oxygen. Indeed, the water observed in feature α is responsible for this hydrogen bond. Once PYP denatures further, the pB may become even more solvated by forming hydrogen bonds to additional waters, resulting in the reported additional 15 nm blue shift.
Consistent fits of time-dependent concentrations at pH 7 and pH 4 obtained from the posterior analysis for the proposed simple mechanism are shown in Fig. 2, C and B, respectively. A more comprehensive mechanism was previously elucidated (12). Here, we focused our analysis on the chromophore region and therefore on two pR states and only one of the pB states observed previously, namely, pB1 (12). The other pB state, pB2, is characterized by the same chromophore conformation as pB1. The third relaxation time at pH 7 may be an indication of pB2. The pB2 peak occupation is much smaller than that of pB1, but pB2 shows structural changes in the N-terminal cap region that persist for a longer time and are absent in the pB1 state (12). At pH 4, a fraction of molecules (20%) in the pR state revert directly back to the dark state, and the rest (80%) form the pB state. In contrast, at neutral pH, the number of activated molecules in the photocycle remains constant until the dark state repopulates. It seems that formation of pB is most likely at pH 7. The observed relaxation time τ1 for the pR to pB transition at neutral pH is in agreement with previous studies that obtained similar values in crystal and solution (9, 12, 13). Both pRE46Q and pRCW constitute the structure of the pR state at pH 7. At pH 4 the sum of the refined rate coefficients, k1 + k3, is 16,740 1/s. Its inverse, 1/(k1 + k3) = 60 μs, should match the relaxation time τ1 from the SVD analysis. However, τ1 = 207 μs, which is longer by a factor of ∼3 (Table 1). However, there is potential evidence for this behavior in the second RSV at pH 4. There is a small dip at just ∼60 μs (arrow in Fig. 3 A). Although this dip may be just a systematic error, it may also indicate different timescales for the pRCW and pRE46Q relaxations. At pH 4, it could be that pRE46Q, which is occupied to ∼20%, also corresponds to the 20% of molecules that relax on a different pathway than pRCW, directly to pG (see above). However, we are unable to determine this from our data alone. A mechanism can only be determined unambiguously if multiple time series are collected under various conditions, such as at different temperatures (28). However, different timescales for the pRCW and pRE46Q relaxations at pH 7 were also observed previously (12). When five-dimensional crystallographic data (28) become available, the simple three-state model we used for posterior analysis and SVD will have to be modified to properly account for the relaxations in this time range. The abovementioned 60 μs for the pR relaxation at pH 4 is faster than 1/k1∼100 μs at pH 7, and hence the pR to pB transition accelerates. Genick et al. (10) also observed such an acceleration at low pH, which was structurally more complex than anticipated.
The deceleration of the dark-state recovery from the pB state at pH 4 is due to the presence of water in the chromophore active site. For the chromophore to relax back to the dark state, the interactions of this water molecule with Tyr-42, Glu-46, and possibly Thr-50 must be broken and the chromophore head interactions with these residues must be reestablished. Consequently, the water molecule can be understood as a transient inhibitor. The water enters the chromophore pocket in concert with pB formation after ∼200 μs, filling the void left by the chromophore. Because the pB formation and water appearance are so intimately linked, the rate of water binding must be greater than that of pB formation, such that the water appears at the instant pB is formed. The water stays in the pocket and exits again after ∼1 s. We propose that at pH 4, Glu-46 is protonated in the pB state. Consequently, the water molecule that we identify in the pocket may be a hydronium ion (H3O+) that neutralizes the negative charge on the Glu-46. This putative neutral electrostatics in the chromophore pocket may be one of the reasons why a larger fraction of molecules (compared with pH 7) relax directly from pR to pG at pH 4.
At pH 9, PYP essentially stops cycling through the pB state. The pB occupation is very low. A meaningful kinetic analysis which includes the pB intermediate is not possible at this pH. Hence, at pH 9, essentially all pR directly reverts to pG on the fast millisecond timescale. The photocycle speeds up by bypassing the signaling state pB. However, compared with pH 7 and pH 4, pR persists much longer at pH 9, in agreement with other studies (10). The τ1 of 1.5 ms agrees well with 1/k3 = 2 ms at pH 9 (Table 1). This timescale is approximately an order of magnitude longer than at lower pH values. Obviously, the high pH prevents the detachment of the chromophore head from the hydrogen-bonding network. If pR is prevented from relaxing to another state, the relevant timescale for reisomerization of the chromophore is τ1, hence it is ∼1.5 ms. To stabilize the cis configuration further into the longer milliseconds to seconds range, another state has to be populated. At pH 4 and 7, the pR state decays much faster at 200 μs to pB. Hence, pB can be considered as a special intermediate that is occupied quickly to stabilize the chromophore in the cis configuration for an extended period of time. This is simply achieved by exposing the chromophore to the solvent, allowing the chromophore head to be hydrated, as evidenced by feature α in our maps.
We believe that at high pH, the chromophore will never acquire a proton when detaching from the Tyr-42 and Glu-46 hydrogen-bonding network, and hence will remain negatively charged. It seems that this negatively charged phenolate cannot form a stable pB structure. A potentially unstable pB conformation would offer an intriguing alternative for a kinetic mechanism. At pH 9, the pB state could relax with a faster rate than it forms (k2 > k1). pB would not accumulate, and consequently would not be observable. However, when the coupled differential equations of this sequential mechanism are solved with rates that correspond to the extended lifetime of pR and to the lifetime τ2 of the small second phase (Fig. 3 C), we cannot reproduce small concentrations of pB (not shown). However, there is evidence of some minor remnant of a pB phase in the RSVs. This fact and the very noisy maps in this time regime may indicate the presence of a strongly disordered pB state. Although a structure cannot be determined from our data, evidence for pB is found in spectroscopy by a blue shift to 420 nm on a timescale of several hundred milliseconds (43). This blue shift, however, is distinct from the one observed at pH 7 (355 nm) and may not necessarily be associated with ordered structure. In any case, the 12 s waiting time between pulses is sufficient for even this anticipated, disordered structure to return to pG, because the 1 s time point is free of even a faint signal. The absence of pB at high pH and the prolongation of the lifetime of pB at low pH suggest that PYP may act as a pH-sensing device in bacteria. This hypothesis, however, awaits in vivo verification.
Acknowledgments
We thank Jane Kuk for providing the PYP crystals at pH 4, and Tim Graber for beamline support.
M.S. was supported by CAREER grant 0952643 from the National Science Foundation. Use of the BioCARS Sector 14 was supported by the National Center for Research Resources, National Institutes of Health, under grant number RR007707. The time-resolved setup at Sector 14 was funded in part through collaboration with Philip Anfinrud (NIH/NIDDK). Use of the Advanced Photon Source, an Office of Science User Facility operated for the U.S. Department of Energy (DOE) Office of Science by Argonne National Laboratory, was supported by the U.S. DOE under Contract No. DE-AC02-06CH11357.
Editor: Patrick Loria.
Footnotes
This is an Open Access article distributed under the terms of the Creative Commons-Attribution Noncommercial License (http://creativecommons.org/licenses/by-nc/2.0/), which permits unrestricted noncommercial use, distribution, and reproduction in any medium, provided the original work is properly cited.
A detailed description of the materials and methods, a figure, two tables, and references are available at http://www.biophysj.org/biophysj/supplemental/S0006-3495(11)05411-7.
Supporting Material
References
- 1.Meyer T.E. Isolation and characterization of soluble cytochromes, ferredoxins and other chromophoric proteins from the halophilic phototrophic bacterium Ectothiorhodospira halophila. Biochim. Biophys. Acta. 1985;806:175–183. doi: 10.1016/0005-2728(85)90094-5. [DOI] [PubMed] [Google Scholar]
- 2.Pellequer J.L., Wager-Smith K.A., et al. Getzoff E.D. Photoactive yellow protein: a structural prototype for the three-dimensional fold of the PAS domain superfamily. Proc. Natl. Acad. Sci. USA. 1998;95:5884–5890. doi: 10.1073/pnas.95.11.5884. [DOI] [PMC free article] [PubMed] [Google Scholar]
- 3.Taylor B.L., Zhulin I.B. PAS domains: internal sensors of oxygen, redox potential, and light. Microbiol. Mol. Biol. Rev. 1999;63:479–506. doi: 10.1128/mmbr.63.2.479-506.1999. [DOI] [PMC free article] [PubMed] [Google Scholar]
- 4.Van Beeumen J.J., Devreese B.V., et al. Cusanovich M.A. Primary structure of a photoactive yellow protein from the phototrophic bacterium Ectothiorhodospira halophila, with evidence for the mass and the binding site of the chromophore. Protein Sci. 1993;2:1114–1125. doi: 10.1002/pro.5560020706. [DOI] [PMC free article] [PubMed] [Google Scholar]
- 5.Hoff W.D., Xie A., et al. Hellingwerf K.J. Global conformational changes upon receptor stimulation in photoactive yellow protein. Biochemistry. 1999;38:1009–1017. doi: 10.1021/bi980504y. [DOI] [PubMed] [Google Scholar]
- 6.Sprenger W.W., Hoff W.D., et al. Hellingwerf K.J. The eubacterium Ectothiorhodospira halophila is negatively phototactic, with a wavelength dependence that fits the absorption spectrum of the photoactive yellow protein. J. Bacteriol. 1993;175:3096–3104. doi: 10.1128/jb.175.10.3096-3104.1993. [DOI] [PMC free article] [PubMed] [Google Scholar]
- 7.Xie A.H., Kelemen L., et al. Hoff W.D. Formation of a new buried charge drives a large-amplitude protein quake in photoreceptor activation. Biochemistry. 2001;40:1510–1517. doi: 10.1021/bi002449a. [DOI] [PubMed] [Google Scholar]
- 8.Borucki B., Joshi C.P., et al. Heyn M.P. The transient accumulation of the signaling state of photoactive yellow protein is controlled by the external pH. Biophys. J. 2006;91:2991–3001. doi: 10.1529/biophysj.106.086645. [DOI] [PMC free article] [PubMed] [Google Scholar]
- 9.Brudler R., Rammelsberg R., et al. Gerwert K. Structure of the I1 early intermediate of photoactive yellow protein by FTIR spectroscopy. Nat. Struct. Biol. 2001;8:265–270. doi: 10.1038/85021. [DOI] [PubMed] [Google Scholar]
- 10.Genick U.K., Devanathan S., et al. Getzoff E.D. Active site mutants implicate key residues for control of color and light cycle kinetics of photoactive yellow protein. Biochemistry. 1997;36:8–14. doi: 10.1021/bi9622884. [DOI] [PubMed] [Google Scholar]
- 11.Harigai M., Imamoto Y., et al. Kataoka M. Role of an N-terminal loop in the secondary structural change of photoactive yellow protein. Biochemistry. 2003;42:13893–13900. doi: 10.1021/bi034814e. [DOI] [PubMed] [Google Scholar]
- 12.Ihee H., Rajagopal S., et al. Moffat K. Visualizing reaction pathways in photoactive yellow protein from nanoseconds to seconds. Proc. Natl. Acad. Sci. USA. 2005;102:7145–7150. doi: 10.1073/pnas.0409035102. [DOI] [PMC free article] [PubMed] [Google Scholar]
- 13.Ren Z., Perman B., et al. Moffat K. A molecular movie at 1.8 A resolution displays the photocycle of photoactive yellow protein, a eubacterial blue-light receptor, from nanoseconds to seconds. Biochemistry. 2001;40:13788–13801. doi: 10.1021/bi0107142. [DOI] [PubMed] [Google Scholar]
- 14.Rubinstenn G., Vuister G.W., et al. Kaptein R. Structural and dynamic changes of photoactive yellow protein during its photocycle in solution. Nat. Struct. Biol. 1998;5:568–570. doi: 10.1038/823. [DOI] [PubMed] [Google Scholar]
- 15.Schmidt M., Pahl R., et al. Moffat K. Protein kinetics: structures of intermediates and reaction mechanism from time-resolved x-ray data. Proc. Natl. Acad. Sci. USA. 2004;101:4799–4804. doi: 10.1073/pnas.0305983101. [DOI] [PMC free article] [PubMed] [Google Scholar]
- 16.Hoff W.D., van Stokkum I.H., et al. Hellingwerf K.J. Measurement and global analysis of the absorbance changes in the photocycle of the photoactive yellow protein from Ectothiorhodospira halophila. Biophys. J. 1994;67:1691–1705. doi: 10.1016/S0006-3495(94)80643-5. [DOI] [PMC free article] [PubMed] [Google Scholar]
- 17.Groenhof G., Bouxin-Cademartory M., et al. Robb M.A. Photoactivation of the photoactive yellow protein: why photon absorption triggers a trans-to-cis isomerization of the chromophore in the protein. J. Am. Chem. Soc. 2004;126:4228–4233. doi: 10.1021/ja039557f. [DOI] [PubMed] [Google Scholar]
- 18.Baca M., Borgstahl G.E., et al. Getzoff E.D. Complete chemical structure of photoactive yellow protein: novel thioester-linked 4-hydroxycinnamyl chromophore and photocycle chemistry. Biochemistry. 1994;33:14369–14377. doi: 10.1021/bi00252a001. [DOI] [PubMed] [Google Scholar]
- 19.Borgstahl G.E., Williams D.R., Getzoff E.D. 1.4 A structure of photoactive yellow protein, a cytosolic photoreceptor: unusual fold, active site, and chromophore. Biochemistry. 1995;34:6278–6287. doi: 10.1021/bi00019a004. [DOI] [PubMed] [Google Scholar]
- 20.Ujj L., Devanathan S., et al. Atkinson G.H. New photocycle intermediates in the photoactive yellow protein from Ectothiorhodospira halophila: picosecond transient absorption spectroscopy. Biophys. J. 1998;75:406–412. doi: 10.1016/S0006-3495(98)77525-3. [DOI] [PMC free article] [PubMed] [Google Scholar]
- 21.van Wilderen L.J.G.W., van der Horst M.A., et al. Groot M.L. Ultrafast infrared spectroscopy reveals a key step for successful entry into the photocycle for photoactive yellow protein. Proc. Natl. Acad. Sci. USA. 2006;103:15050–15055. doi: 10.1073/pnas.0603476103. [DOI] [PMC free article] [PubMed] [Google Scholar]
- 22.Hoff W.D., Van Stokkum I.H.M., et al. Hellingwerf K.J. Comparison of acid denaturation and light activation in the eubacterial blue-light receptor photoactive yellow protein. BBBA Bioenergetics. 1997;1322:151–162. [Google Scholar]
- 23.Moffat K. Time-resolved macromolecular crystallography. Annu. Rev. Biophys. Biophys. Chem. 1989;18:309–332. doi: 10.1146/annurev.bb.18.060189.001521. [DOI] [PubMed] [Google Scholar]
- 24.Rajagopal S., Anderson S., et al. Moffat K. A structural pathway for signaling in the E46Q mutant of photoactive yellow protein. Structure. 2005;13:55–63. doi: 10.1016/j.str.2004.10.016. [DOI] [PubMed] [Google Scholar]
- 25.Borucki B., Devanathan S., et al. Heyn M.P. Kinetics of proton uptake and dye binding by photoactive yellow protein in wild type and in the E46Q and E46A mutants. Biochemistry. 2002;41:10026–10037. doi: 10.1021/bi0256227. [DOI] [PubMed] [Google Scholar]
- 26.Demchuk E., Genick U.K., et al. Bashford D. Protonation states and pH titration in the photocycle of photoactive yellow protein. Biochemistry. 2000;39:1100–1113. doi: 10.1021/bi991513p. [DOI] [PubMed] [Google Scholar]
- 27.Graber T., Anderson S., et al. Moffat K. BioCARS: a synchrotron resource for time-resolved X-ray science. J. Synchrotron Radiat. 2011;18:658–670. doi: 10.1107/S0909049511009423. [DOI] [PMC free article] [PubMed] [Google Scholar]
- 28.Schmidt M., Graber T., et al. Srajer V. Five-dimensional crystallography. Acta Crystallogr. A. 2010;66:198–206. doi: 10.1107/S0108767309054166. [DOI] [PMC free article] [PubMed] [Google Scholar]
- 29.Schmidt M. In: Ultrashort Laser Pulses in Medicine and Biology. Braun M., Gilch P., Zinth W., editors. Springer; Berlin/New York: 2008. Structure based enzyme kinetics by time-resolved x-ray crystallography; pp. 201–241. [Google Scholar]
- 30.Schmidt M., Rajagopal S., et al. Moffat K. Application of singular value decomposition to the analysis of time-resolved macromolecular x-ray data. Biophys. J. 2003;84:2112–2129. doi: 10.1016/S0006-3495(03)75018-8. [DOI] [PMC free article] [PubMed] [Google Scholar]
- 31.Reference deleted in proof.
- 32.Schmidt M., Ihee H., et al. Srajer V. Protein-ligand interaction probed by time-resolved crystallography. Methods Mol. Biol. 2005;305:115–154. doi: 10.1385/1-59259-912-5:115. [DOI] [PubMed] [Google Scholar]
- 33.Rajagopal S., Schmidt M., et al. Moffat K. Analysis of experimental time-resolved crystallographic data by singular value decomposition. Acta Crystallogr. D Biol. Crystallogr. 2004;60:860–871. doi: 10.1107/S0907444904004160. [DOI] [PubMed] [Google Scholar]
- 34.Zhao Y., Schmidt M. New software for the singular value decomposition of time-resolved crystallographic data. J. Appl. Cryst. 2009;42:734–740. [Google Scholar]
- 35.Brünger A.T., Adams P.D., et al. Warren G.L. Crystallography & NMR system: a new software suite for macromolecular structure determination. Acta Crystallogr. D Biol. Crystallogr. 1998;54:905–921. doi: 10.1107/s0907444998003254. [DOI] [PubMed] [Google Scholar]
- 36.Hendriks J., Gensch T., et al. van Thor J.J. Transient exposure of hydrophobic surface in the photoactive yellow protein monitored with Nile Red. Biophys. J. 2002;82:1632–1643. doi: 10.1016/S0006-3495(02)75514-8. [DOI] [PMC free article] [PubMed] [Google Scholar]
- 37.Ng K., Getzoff E.D., Moffat K. Optical studies of a bacterial photoreceptor protein, photoactive yellow protein, in single crystals. Biochemistry. 1995;34:879–890. doi: 10.1021/bi00003a022. [DOI] [PubMed] [Google Scholar]
- 38.Yeremenko S., van Stokkum I.H., et al. Hellingwerf K.J. Influence of the crystalline state on photoinduced dynamics of photoactive yellow protein studied by ultraviolet-visible transient absorption spectroscopy. Biophys. J. 2006;90:4224–4235. doi: 10.1529/biophysj.105.074765. [DOI] [PMC free article] [PubMed] [Google Scholar]
- 39.Shimizu N., Imamoto Y., et al. Kataoka M. pH-dependent equilibrium between long lived near-UV intermediates of photoactive yellow protein. J. Biol. Chem. 2006;281:4318–4325. doi: 10.1074/jbc.M506403200. [DOI] [PubMed] [Google Scholar]
- 40.Meyer T.E., Devanathan S., et al. Cusanovich M.A. Site-specific mutations provide new insights into the origin of pH effects and alternative spectral forms in the photoactive yellow protein from Halorhodospira halophila. Biochemistry. 2003;42:3319–3325. doi: 10.1021/bi020702w. [DOI] [PubMed] [Google Scholar]
- 41.Lee B.C., Kumauchi M., Hoff W.D. Modulating native-like residual structure in the fully denatured state of photoactive yellow protein affects its refolding. J. Biol. Chem. 2010;285:12579–12586. doi: 10.1074/jbc.M109.065821. [DOI] [PMC free article] [PubMed] [Google Scholar]
- 42.Espagne A., Changenet-Barret P., et al. Martin M.M. Solvent effect on the excited-state dynamics of analogues of the photoactive yellow protein chromophore. J. Phys. Chem. A. 2006;110:3393–3404. doi: 10.1021/jp0563843. [DOI] [PubMed] [Google Scholar]
- 43.Hendriks J., Hoff W.D., et al. Hellingwerf K.J. Protonation/deprotonation reactions triggered by photoactivation of photoactive yellow protein from Ectothiorhodospira halophila. J. Biol. Chem. 1999;274:17655–17660. doi: 10.1074/jbc.274.25.17655. [DOI] [PubMed] [Google Scholar]
Associated Data
This section collects any data citations, data availability statements, or supplementary materials included in this article.