

Abstract
Myosin II is a central mechanoenzyme in a wide range of cellular morphogenic processes. Its cellular localization is dependent not only on signal transduction pathways, but also on mechanical stress. We suggest that this stress-dependent distribution is the result of both the force-dependent binding to actin filaments and cooperative interactions between bound myosin heads. By assuming that the binding of myosin heads induces and/or stabilizes local conformational changes in the actin filaments that enhances myosin II binding locally, we successfully simulate the cooperative binding of myosin to actin observed experimentally. In addition, we can interpret the cooperative interactions between myosin and actin cross-linking proteins observed in cellular mechanosensation, provided that a similar mechanism operates among different proteins. Finally, we present a model that couples cooperative interactions to the assembly dynamics of myosin bipolar thick filaments and that accounts for the transient behaviors of the myosin II accumulation during mechanosensation. This mechanism is likely to be general for a range of myosin II-dependent cellular mechanosensory processes.
Introduction
Nonmuscle myosin II is critical for many cellular events, such as motility, cell division, and tissue morphogenesis. In the past few decades, much effort has been invested to understand its roles in mechanosensation and mechanotransduction at the single molecule, cellular, and tissue levels (1, 2, 3, 4). Yet, the mechanisms of its cellular functions and its interactions with other proteins remain to be clarified. One of the interesting findings is the cooperative binding of myosin heads to actin filaments (5, 6, 7). Under specific conditions in vitro, the level of actin-bound myosins displayed a sigmoidal increase as a function of increasing myosin concentration and clustering along the actin filaments. These observations suggest cooperative interactions between myosins (homocooperativity). In Dictyostelium, myosin II and the actin cross-linker cortexillin I also codependently accumulate into the highly deformed regions induced by micropipette aspiration (MPA) (2). Furthermore, the extent of myosin II accumulation increases monotonically with increasing applied force in a manner that is dependent on its lever-arm length (3). Although the latter can be qualitatively interpreted by the force-dependent binding affinity to actin filaments (8) and the lever-arm theory of myosin (9), the underlying mechanism of the heterocooperativity between these two different proteins remains elusive.
In the absence of regulatory proteins (such as troponin and tropomyosin), the mechanism for myosin homocooperativity was suggested to occur because binding of myosin heads causes local conformational changes in actin subdomain 2, facilitating myosin binding nearby (7). Other proteins, such as cofilin, espin, and fascin, also display cooperative binding to actin filaments due to the conformational changes in actin upon binding (10, 11, 12, 13). Importantly, actin filaments had increased torsion and bending flexibility due to cofilin binding and twisting due to espin and fascin binding. Based on these observations, the conformational changes of actin due to protein binding may be essential for cooperative binding of proteins to actin filaments although the details of the atomic level deformations are still absent.
Though myosin II biochemical and biophysical assays have revealed the underlying mechanisms of cooperativity, there are several missing links between these in vitro observations and the cellular behaviors: First, most mathematical descriptions of cooperativity were based on fitting the experimental data to the general Michaelis-Menten equation or Hill equation (5, 6), which by itself does not reflect the molecular scale mechanisms of the process. Second, most studies only considered the cooperative interaction between nearest neighbors, thereby ignoring the propagation of actin monomer deformations over longer distances and significantly underestimating cooperativity (14). Third, because the basic functional unit of myosin II is the bipolar thick filament (BTF), a mathematical model that links the force-dependent myosin-actin interactions, myosin cooperativity and the BTF assembly kinetics is required. Specifically, because actin filaments significantly enhance the BTF assembly rate and the myosin-actin binding is force-dependent, these features must be considered in the model (8, 15). However, the current understanding of myosin cooperativity is based either on measurements of the myosin motor (proteolytic subfragment 1, S1) or the dimerized motor (heavy meromyosin) to actin filaments in the absence of applied force (5, 6, 7). The fourth issue is that in vivo protein concentrations are more spatially heterogeneous than those in the in vitro assays (16, 17). Differences also exist in the mechanical studies of in vitro assembled actin networks where the imposed deformations are relatively uniform. However, the deformations experienced by cells, such as through atomic force microscopy or MPA, are typically much more localized, leading to deformation gradients (18), which are likely to be more physiologically relevant for normal cell behaviors. Therefore, for a quantitative interpretation of the in vivo cell behaviors based on the understanding of in vitro assays, a multiscale model that integrates these factors is required.
In this article, we analyzed the heterocooperativity between myosin II and cortexillin I in Dictyostelium cells. We then reproduced the key features of the experimental observations of both homocooperativity and heterocooperativity using simulations. These simulations were based on one essential assumption: myosin binding to actin causes local conformational changes in the actin that enhance myosin binding in nearby regions. We performed two-dimensional coarse-grained kinetic Monte Carlo simulations of homocooperativity of myosin head binding. The simulations yielded the sigmoidal curve and the two-dimensional cluster formation observed in biochemical assays. Moreover, we simulated the mixed system containing myosin and cortexillin, assuming that myosin binding alone promotes further myosin and cortexillin binding. In these simulations, cortexillin binding always followed myosin binding kinetically and the two-dimensional clusters contained mixtures of both proteins. Furthermore, we developed a model for myosin bipolar thick filament (BTF) assembly by incorporating the effect of myosin head binding through mean-field approximation into the BTF dimer addition model. This model accounts for the kinetics and three-dimensional pattern of the cooperative accumulation of myosin observed experimentally during MPA.
Materials and Methods
Measurements of mechanosensory response of proteins using MPA
Micropipette aspiration was performed as described previously (2). In short, to apply aspiration pressure, the pressure difference was generated by adjusting the height of a motor-driven water manometer. The Dictyostelium myosin II null cells (cells deleted for the myosin II heavy chain gene, mhcA) were transformed with GFP myosin II (GFP-mhcA) and mCherry cortexillin I plasmids or GFP 3×Ala myosin II (a mutant myosin II heavy chain where key threonines, which are phosphorylated by heavy chain kinases, are mutated to alanine). WT cells were transformed with the GFP myosin heavy chain kinase C (GFP-MHCK-C) plasmid (19).
Cells were loaded into the observation chamber filled with sterile filtered MES buffer (50 mM MES at pH 6.5, 2 mM MgCl2, 0.2 mM CaCl2). Latrunculin-A and jasplakinolide were used to change the F-actin level in cells as compared to DMSO-carrier treated controls (see the Supporting Material). The images were collected using an IX81 microscope (Olympus, Melville, NY) and analyzed using ImageJ software (National Institutes of Health, Bethesda, MD). After background correction, the fluorescence intensity at the accumulation site inside the micropipette was normalized against the opposite cortex in each frame to account for photobleaching. The fluorescence signals were assumed to be linearly proportional to the concentrations of the corresponding protein.
Two-dimensional coarse-grained kinetic Monte Carlo model
To study the kinetics of cooperative binding, a coarse-grained kinetic Monte Carlo simulation model is introduced. A similar model has proven to be powerful for predicting the kinetics of reaction-diffusion systems (20). The simulation domain is a two-dimensional matrix of N × N square lattices (see Fig. S1 in the Supporting Material). Actin monomers are 5.4 nm in diameter and F-actin filaments are composed of two intertwined strands that are staggered by half a monomer, i.e., 2.7 nm. Because each myosin head covers two actin monomers along a single strand, each lattice point has a size of a = 5 nm, representing one myosin binding site along the actin filament. Two actin filaments are orthogonally aligned at x = N/2 and y = N/2 to mimic the actin network. The simulated mesh size of the actin network is Na. Two-dimensional periodic conditions are applied to the diffusion process but diffusion of bound myosins on F-actin is not allowed. It is assumed that myosin heads have two energy states: unbound and bound state (neglecting the details of the bound myosins with different nucleotide states). The strain energy associated with myosin binding is and decays exponentially along the actin filament (shown in Fig. S1 B), i.e.,
where |xij| is the distance between binding sites i and j (21). The characteristic decay length, λ, was set to 2a because it was observed experimentally that the deformation associated with the binding of a single myosin head propagates ∼3–4 actin monomers along a single strand (14). The binding energy of a myosin head, which depends on the occupation states of its neighboring binding sites, is
where is the binding energy in the absence of strain. To speed up the computation, a lookup table was used for |xij| ≤ 3a, containing 30 different cases in terms of occupation state of 2 × 3 neighboring binding sites. The energy error at a cutoff of 3a is ∼0.14 . If |xij| ≤ 4a is used, the corresponding energy error decreases to 0.08 but the lookup table includes 56 different cases complicating the computations.
Here, the rates of diffusion and binding are kept constant and only the unbinding rate is allowed to be affected by the strain energy associated with cooperative binding through the form of binding energy as defined above. Namely, the energy level of the transition state is assumed to be unaffected by the cooperative binding (see Fig. S1 C). The reasoning behind this assumption is that the ADP-bound isometric state of myosin (where a myosin head tightly binds actin) is the critical state for myosin cooperative binding (22). The energy landscape is shifted from solid line to dotted line upon the cooperative binding (see Fig. S1 C). The unbinding rate has the form koff = v exp(−E/kBT), where E is the associated energy barrier, kB is the Boltzmann constant, Tis the temperature, and ν is the vibration frequency at the molecular level. This energy barrier, E = Ea + Ei, where Ea is the activation energy barrier, is assumed not to change with cooperative binding. There is no reported value for Ea as it is difficult to measure experimentally. To overcome this issue, the rate equation is rewritten as
where is the unbinding rate of single myosin head in the absence of cooperativity and has a reported value ∼300.0 s−1 (23). The value alone contains information of the energies Ea and . Thus, without knowing the exact values of Ea and , the effect of cooperative binding on koff may be evaluated by adjusting because depends on . The binding rate is set to 10.0 s−1, corresponding to the period of myosin ATP hydrolysis cycle (100 ms, (23)). The kinetic rate for diffusion events is chosen to be 3.0 × 10⁷ s−1 corresponding to a three-dimensional diffusion coefficient of ∼0.2 μm2/s (24). Although a myosin II monomer has two heads, whether the myosin heads belong to different monomers or the same does not affect their binding behaviors in simulations.
Myosin thick filament assembly in the presence of actin filaments
Previously, we proposed a detailed dimer addition scheme for BTF assembly/disassembly based on in vivo and in vitro observations (3, 25, 26). In this case, the BTF is formed through dimer addition and the stacking of the tail domain of each monomer. The diameter of the Dictyostelium myosin BTFs increases but their length does not change as the BTFs grow, which is different from the muscle myosin BTF assembly mechanism. The BTF assembly scheme primarily consists of five steps, each described by forward, ki, and backward, k−i, rates (i = 1, 2, …, 5), respectively. The values k2, k3, k4, and k−5 are based on experimentally measured values (25, 27, 28). Other rates are determined numerically by fitting the experimental observation that 20% of myosins are assembled into BTFs (25, 27).
Importantly, numerical tests suggest that the ratio of the rates describing the conversion between incompetent and competent states is the most sensitive parameter that controls the assembly dynamics and therefore, is the only one that is likely to have strain-dependence (3). However, the effect of the cooperative binding of myosin heads in the presence of actin filaments was not considered previously. Myosin binding to actin has at least two effects on BTF assembly: First, the binding is required for myosins to sense the tension in actin filaments. Second, binding prevents myosin monomers from diffusing away from the actin filaments, increasing the probability of the tail-domain interactions between neighboring bound monomers, which elevates BTF assembly.
Here, we incorporated the effect of actin filaments into the kinetics of myosin BTF assembly and present an updated scheme. Due to the presence of actin, the myosin monomer has four different forms: competent bound; incompetent bound; competent unbound; and incompetent unbound. These myosin forms are denoted by M∗, , M and , respectively, where the overbar represents “incompetent” and the asterisk represents “bound”. The change between competent and incompetent states is a structural one and is presumed to be uncoupled from the change between bound and unbound states.
This updated framework takes into account the conversion between the four different myosin monomer forms and the cooperative binding effect, and is shown in Fig. 1. It is thought that the conversions between incompetent and competent states are governed by MHCK and phosphatase in cells (27). Thus, k+ is set to be 0.05 s−1 based on the measured myosin tail dephosphorylation rate (29). However, no experimental data on the phosphorylation rate are available. Therefore, k− needs to be set numerically. The value k1, the rate that controls the conversion from the bound and the unbound states, has the form of k1 = konCactin, where kon is the on-rate for myosin binding to actin and is ∼0.45 μM−1 s−1 (30). Because myosin unbinding to actin is force-dependent (8) and the isometric binding state is crucial for cooperativity (22), it is reasonable to incorporate its associated cooperative effect in the rate k−1 that controls the conversion from the bound and the unbound states.
Figure 1.
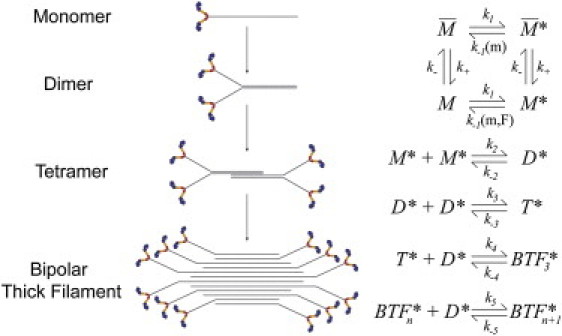
Dimer addition model for myosin BTF assembly in the presence of actin filaments. M, D, and T represent the monomer (the hexameric monomer with two heavy chains, two essential light chains, and two regulatory light chains), dimer, and tetramer, respectively, BTF3, BTFn, and BTFn+1 are the bipolar filaments having 6, 2n, and 2(n+1) monomers, respectively, and n is the number of dimers. The superscripts (∗) and bar (−) represent the actin-bound state and the incompetent forms, respectively. The rate constant k1 = konCactin, where kon is the on-rate for myosin binding to actin and Cactin is the F-actin concentration; k− can be determined by the BTF concentration at steady state. The value k−1 is a function of the concentration of myosin (m) and/or applied force (m, F).
Considering the abundance of actin filaments in cells and that the assembly rate of BTFs in the presence of actin filaments is much higher than that of myosin alone (15, 28), we suspect that although BTFs can still form without binding to actin, the turnover dynamics of myosin BTFs is dominated by the scheme associated with myosin binding to actin. The primary unit for the BTF assembly described is the competent bound myosin M∗. Anything that promotes the conversion from or M to M∗ accelerates BTF assembly. So far no experimental evidence indicates that the conversion from to M∗ (i.e., the dephosphorylation of myosin tail) is force-dependent. However, accumulating evidence, including the simulations presented here, points to the force-dependency of the conversion from M to M∗ (8). Therefore, k−1 is the key parameter that controls the force-induced myosin accumulation and subsequent BTF assembly. Based on the mean-field approximation of homocooperativity of myosin, k−1 has the form of
| (1) |
where is the rate in the absence of force and homocooperativity, and ΔEb is the change of binding energy of a myosin head to actin due to the applied force and the cooperative binding. The measured value of is ∼300.0 s−1 (23). In general, ΔEb can be described as
| (2) |
where f is the force applied on each myosin head and the force-dependent bond length d is an empirical parameter that can be obtained by single molecule measurements according to Bell's model. Each myosin head is able to generate ∼4 pN of force to counteract the external load. The value d is in the range of 1–2 nm (31). The value Φ is the additional strain energy, a coupling term of Es and fd when neighboring bound myosins are deformed by the force f. A simple choice is Φ ∼ fdEs. Experimental data suggest that the increase of binding energy due to tension may be related to the prolonged transition state of the actin-bound myosin before phosphate release (7, 15, 22). f ∼ m−1 because the total force is shared by all bound myosins, i.e., F ∼ mf, where F is the total force and m is the total number of bound myosins. As described in the results (below), Es is approximately a piecewise linear function of the coverage of the actin filament by myosin, implying Es ∼ m. Based on the above scaling analysis, the coupling term Φ is independent of m but proportional to the applied force F and the force-independent strain energy , i.e., Φ ∼ Fd. As a result, Eq. 1 can be rewritten as
| (3) |
where Δ contains the terms dependent on the amount of bound myosin m, and ω is a coefficient characterizing the energy coupling. The coupling term is for the completeness of the formulation and it can be neglected for convenience because it is a higher order term. Therefore, we used k−1 = exp(−Δ/KBT) in all simulations.
Results
Myosin and cortexillin show cooperative accumulation during micropipette aspiration
We used MPA to apply aspiration pressure to cells and observed the concentration changes of myosin and cortexillin at the deformation site (Fig. 2 A). The local concentrations of myosin and cortexillin typically increased in the aspirated region simultaneously with continuously increasing slopes in the rising phase. Importantly, both the peak intensity and the accumulation rate of myosin in the rising phase increased with applied pressure (Fig. 2, B and C). Because the initial myosin concentration in the cell cortex is ∼4 μM and the local myosin concentration increased as much as threefold, this suggests that the accumulation rate can be up to 0.2 μM/s. We found that actin monomers and the actin binding proteins that bind to newly formed actin filaments, such as dynacortin, coronin, and LimE, did not show any concentration change in the tip region during MPA (data not shown, and Effler et al. (2)).
Figure 2.
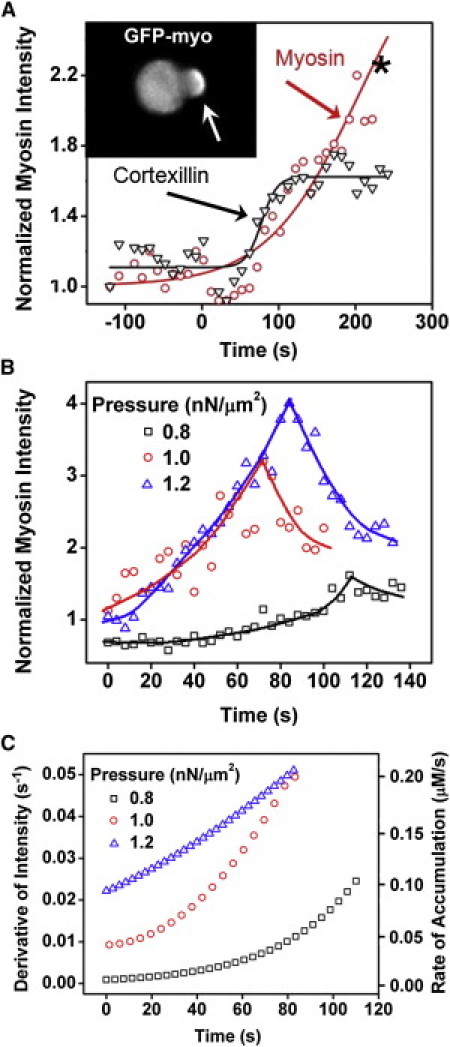
Mechanosensitive accumulation of myosin II and cortexillin I. (A) The transient curves of the accumulation of myosin II and cortexillin I of a single wild-type cell. (Asterisk in the graph) Point where the inset was derived. (Inset) Spatial pattern of GFP-myosin II accumulation during mechanosensing. (Open arrow) Tip position inside the micropipette. (B) The normalized myosin II accumulation magnitude increases overtime at different pressures. (Scattered symbols) Experimental data and lines show the trend. (C) The corresponding accumulation rates calculated from the data in panel B with initial cortical myosin concentration of 4.2 μM (17).
Furthermore, latrunculin-A treatment reduced the total actin and dramatically increased cell deformability, making it impossible to apply enough pressure to induce myosin mechanosensitive accumulation (see Fig. S2). On the other hand, increasing the total actin concentration fourfold using the actin stabilizer jasplakinolide did not alter the myosin stress-induced accumulation (see Fig. S2). All of these results, in combination, suggest that myosin mechanosensitive accumulation does not simply result from changes in the local F-actin concentrations. Because the mechanical input (external pressure) is constant for each curve, a positive feedback loop likely accelerates myosin accumulation by acting primarily at the level of the myosin-actin interaction. Cooperative binding of myosin to actin is one of the possible mechanisms to account for this loop.
We propose that myosin II mechanosensitive accumulation is caused by the force-induced bias of myosin binding affinity to actin filaments, which enhances the myosin binding in the deformed regions. The basic functional unit of myosin is the myosin BTF, as the unassembled myosin monomer is unable to generate force. The majority of the accumulated myosin comes in monomer form from other regions by diffusion. The basis of this assumption is that a mutant myosin II heavy chain (3×Ala myosin II), which constitutively assembles into BTFs, has attenuated mechanosensitive accumulation (3). To fully understand the kinetics of protein accumulation, it is necessary to consider both myosin binding to actin and the turnover dynamics of myosin BTFs. We will discuss them sequentially below and present a model that is able to explain the in vitro cooperative binding and the enhanced myosin BTF assembly in the presence of actin filaments (7, 15, 22), as well as the myosin accumulation observed during cellular mechanosensation.
Strain-induced cooperative interaction of myosin heads leads to cluster formation along actin filaments
We studied the homocooperativity of myosin II and the heterocooperativity between myosin II and cortexillin I using a two-dimensional coarse-grained kinetic Monte Carlo simulation model (see Materials and Methods). In this model, an actin meshwork was mimicked by a two-dimensional periodic rectangular box in which two actin filaments were orthogonally placed. Myosin and cortexillin proteins in the domain are allowed to diffuse, bind, and unbind the actin. Because the kinetic rates and geometries are based on three-dimensional considerations, the two-dimensional simulations reasonably mimic the kinetics of three-dimensional events (see the Supporting Material).
The bound fraction of myosin as a function of the myosin head concentration shows a sigmoidal shape, a signature of cooperativity (Fig. 3 A). It becomes more pronounced as the strain energy, , increases, indicating that the cooperativity is proportional to the conformational change due to myosin binding. The cooperativity can be significant even when strain energy is only a few kBT, a small portion of the ATP hydrolysis energy (∼25 kBT). Fitting the kinetics of binding to an exponential function suggests that the characteristic time of the curves is around a few seconds, consistent with published values (6). The two-dimensional myosin II clusters on actin due to homocooperativity (Fig. 3 B, and see Movie S1 in the Supporting Material) are similar to those observed previously by electron microscopy (7). Moreover, the cluster size increases with the strain energy due to cooperative binding (Fig. 3 C). In comparison, if we only consider nearest-neighbor interactions, the impact of cooperativity is much less, and the strain energy needs to be increased by up to eightfold to achieve similar cluster sizes (see Fig. S3). Thus, the above simulations replicate two major features observed in the in vitro myosin binding assays: the sigmoidal shape of myosin binding and the myosin clusters, suggesting that the simulation scheme and the parameters being used have physical and biological significance.
Figure 3.
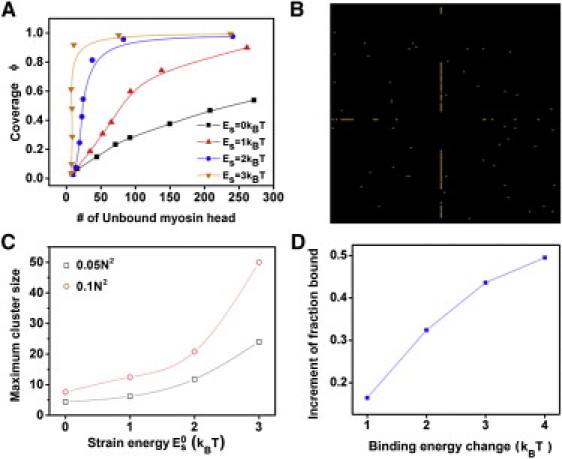
Simulation results of homocooperative binding of myosin II to the actin filaments. (A) Coverage of actin filaments by bound myosins, ϕ (i.e., the fraction of myosin binding sites on actin occupied by myosin) as a function of initial myosin concentrations at different strain energies. (B) A representative snapshot of myosin clusters (aligned bright dots) on the actin filaments. (Scattered shaded dots) Freely diffusing monomers. (C) The cluster size increases with in the cases where the total number of myosin is either 0.05 N2 (open squares) or 0.1 N2 (open circles). (D) The fraction of bound myosin increases with increasing strain energy, . The simulation window size was N = 128.
In cells, myosin heads undergo a power stroke, pulling the actin filaments along one direction. This myosin force-generation leads to an almost equivalent tension in the actin filaments if the polymers are cross-linked and/or entangled. Single molecule studies demonstrated that the tension is able to lock the myosin heads in the isometric state and hence increase its binding lifetime to actin filaments (8). The relation between the tension and the binding lifetime is often described by Bell's model, i.e., the binding lifetime is exponentially proportional to the force experienced by each myosin head. During MPA experiments, the elevated pressure increases the tension in the actin filaments and consequently myosin heads experience more load, presumably leading to more local strain associated with myosin binding, as well as longer binding lifetimes. In simulations, the strain energy was increased with different magnitudes to mimic the effect of pressure jumps in experiments (Fig. 3 D). The bound fraction increases as the strain energy increases, consistent with the experimental observation that myosin accumulation increases as a function of applied pressure (Fig. 2 and Ren et al. (3)).
Because myosin and cortexillin synchronously accumulate during the rising phase (Fig. 2 A), we suggest that heterocooperativity may exist between myosin and cortexillin. To account for this, we consider that similar to myosin, cortexillin may have two energy states and that cortexillin's binding energy in the absence of strain () is similar to that of myosin's (experimental measurement of cortexillin's binding energy states are not yet available). Cortexillin binding to actin may also be cooperative. However, the binding lifetime of cortexillin to actin displayed no force-dependency over a 2.0 pN range in single molecule experiments, and myosin II null cells did not show mechanosensitive GFP-cortexillin accumulation during MPA (3). These observations suggest that the cooperativity from cortexillin binding alone is not sufficient to mediate mechanosensitive cortexillin accumulation.
Therefore, we consider two extreme cases. The first is that the cooperativity of cortexillin binding is as strong as that of myosin binding and that the associated conformational change of actin facilitates both myosin and cortexillin binding. The second is that cortexillin binding is not cooperative. In both cases, it is assumed that myosin binding promotes cortexillin binding. For the first situation, cortexillin is not distinguishable from myosin based on their binding behaviors and the corresponding simulation result is not different from the case of pure myosin (not shown). For the second situation, the simulation shows that the dynamics of the protein binding of the mixed system is dominated by myosin and the corresponding clusters have both proteins (Fig. 4, and see Movie S2 and Fig. S4). Cortexillin accumulates as myosin does in both cases, suggesting that it will also accumulate in cases between the two extremes. Therefore, it is reasonable to conclude that heterocooperativity may be observed as long as myosin binding enhances cortexillin binding, whereas cortexillin binding does not need to enhance myosin binding.
Figure 4.
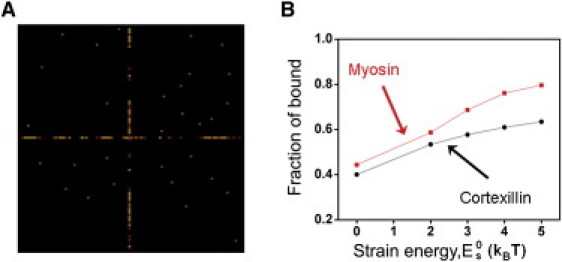
Simulation results of heterocooperative binding of myosin II and cortexillin I to the actin filaments. (A) A representative snapshot of the clusters formed by myosin and cortexillin due to heterocooperativity. (Yellow and red dots) Bound myosins and cortexillins, respectively; (gray and green dots) unbound myosins and cortexillins, respectively. (B) The fraction of bound proteins at steady state increases as a function of strain energy, .
With the essential assumption that local deformation of actin filaments due to myosin binding enhances neighboring myosin binding, these simulations qualitatively reproduce key features observed in the in vitro myosin binding assays and account for the possible heterocooperativity observed in vivo. Without this assumption (i.e., is zero), the sigmoidal curves and cluster formation disappeared (not shown).
Mean-field approximation of strain energy from statistical mechanics
To link quantitatively the cooperative interaction of myosins to the accelerated myosin accumulation observed in experiments, we need to evaluate the average change of the binding energy Es associated with the cooperative binding, as a function of the coverage of actin filaments by myosin binding, ϕ. An analytical solution for Es might generally be obtained for simple cooperative interactions between proteins by considering nearest-neighbor interactions (32). However, the situation here is more complicated. Initially, myosin heads bind to actin filaments more-or-less randomly and slowly form clusters due to the cooperative interactions through the strain field in the actin filaments (see Movie S1). In addition to the inherent randomness of the occupied states of neighboring binding sites (more than just nearest-neighbor binding sites), the long-range nature of this type of cooperative interaction makes it almost impossible to obtain an analytical equation to calculate the average change of the binding energy. However, the average effect may be evaluated through statistical simulations.
To this end, we considered a one-dimensional actin filament with N binding sites for myosin and applied a periodic boundary to it to mimic an infinitely long filament. Using only the values of and the decay length of the strain field (λ), the mean-field approximation of the change of binding energy due to cooperative binding, Es, can be calculated (see the Supporting Material) from
| (4) |
Here, we assumed that can be as large as 3 kBT. This assumption is derived from the precedent that the free energy change associated with cooperative actin binding of another actin binding protein, cofilin, is ∼7 kJ/mol (∼2.8 kBT) (33). The value λ has the same value used previously (2a). We calculated Es as a function of ϕ for different N and (Fig. S5, A–C). From this calculation, we find that regardless of the value of N, Es can be approximated by a piecewise linear function as
| (5) |
where χ1 and χ2 are the slopes and ϕ∗ is the critical point where Es switches between these two regimes. Becauseχ1 > χ2, Es increases less after ϕ exceeds ϕ∗ for = 1, 2, and 3 kBT. Notably, χ1, χ2, and ϕ∗ are dependent on . For any < 3 kBT, the corresponding triplet (χ1, χ2, ϕ∗) can be obtained simply by interpolation on the curves shown in Fig. S5 D.
The value of instantaneous Es can be calculated through Eq. 5 once the concentrations of bound myosin and F-actin are known. The result of the mean-field approximation of Es will be used in a myosin BTF assembly scheme described in the next section to evaluate the myosin accumulation.
A model of myosin BTF assembly demonstrates strain-induced myosin accumulation
We developed a myosin BTF assembly model that takes into account the cooperative interaction and force-dependency of myosin binding to actin filaments (Materials and Methods, Fig. 1). The effect of cooperative interaction and force-dependency is reflected in the rate, k−1, that controls the conversion from the bound to the unbound states through Eq. 3. Based on the scaling discussion, ΔE′b in Eq. 3 has the form Δ = δm + Fd/αm, where the first term represents the strain energy and the second term is associated with the applied force with the coefficients α and δ. Specifically, αm is the amount of the bound BTF (the functional unit able to generate contractile force), and δ = 3χ/Cactin, where χ is the slope derived in the mean-field approximation (see previous section) and Cactin is the F-actin concentration. The terms m and ϕ are related by ϕ = 3m/Cactin where the factor 3 comes from the assumption that each binding site consists of three neighboring actin monomers in a double-helical actin filament (15). The piecewise linear approximation of Es from the mean-field approximation may now be rewritten as
| (6) |
where m∗ corresponds to ϕ∗ in Eq. 5, δ1 and δ2 are the slopes, and δ1 > δ2. Indeed, δ1 and δ2 are related to χ1 and χ2 by a factor 3/Cactin, respectively. Therefore, δ can have a value of either δ1 or δ2 depending on the amount of bound myosin m. The dependence of Δ on m for different is discussed in the Supporting Material.
The only undetermined rate in the scheme, k−, was determined numerically by fitting the simulation results to the experimental observation that the immobile fraction of myosin in the cortex is between 20 and 50% because the immobile fraction measured by FRAP is equivalent to the assembled BTF fraction (34).
We applied the BTF assembly scheme with (3), (6) to different cases and compared the simulation results to the experimental observations. We also performed sensitivity tests of k− and k+ terms, which are provided in the Supporting Material.
Here, we present the simulation results of myosin accumulation in response to pressure. In Dictyostelium cells, Cactin is ∼70 μM, which sets k1 to be ∼30.0 s−1. In MPA measurements, the aspiration pressure ΔP was fixed over time and hence the total force F applied on the tip of cell in the pipette was constant. Initially, the system resides at steady state before time zero and then starts to evolve in response to the applied force, Fd. In the simulations, the concentration of unbound myosin monomer was kept constant (see the Supporting Material) and the value of Fd was varied over a physiological range (see Materials and Methods) to mimic different applied pressures. The kinetics of BTF assembly along with the normalized myosin accumulation and the rates of accumulation with k1 at 7 and 14 s−1 are provided (see Fig. S9). Importantly, the BTF assembly rate was nearly identical to the accumulation rates under the same conditions. With k1 = 7 s−1, BTF assembly increased, leading to significant myosin accumulation in response to applied force. However, these simulations did not show continuously increasing accumulation rates over the duration of force application. In comparison, with k1 = 14 s−1, the simulations showed dramatic BTF assembly and myosin accumulation and, most importantly, continuously rising accumulation rates even with smaller Fd. Quantitatively, the accumulation rate in the simulations reached 0.2 s−1 and the normalized myosin accumulation increased fourfold over 200 s, consistent with experimental observations (see Figure 2, Figure 5).
Figure 5.
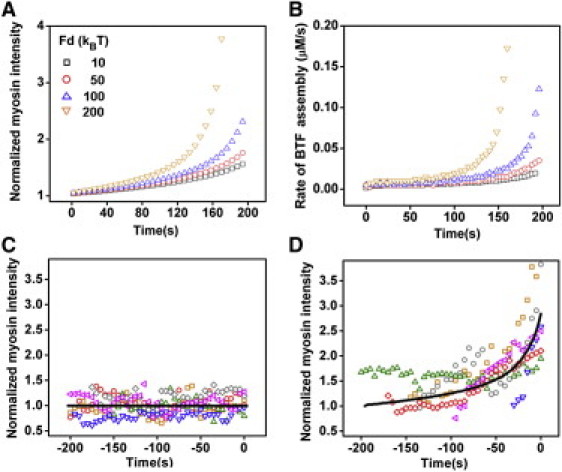
BTF assembly and myosin accumulation for different applied forces. The simulated myosin accumulation and accumulation rate for different Fd values are shown in panels A and B, respectively. Simulations for Fd = 0 and 120 kBT (solid lines) are compared to experimental observations (scattered symbols) at pressure of 0.2 and 1.0 nN/μm2 in panels C and D, respectively. For all simulated cases, k1 = 14 s−1 and = 3 kBT (see the Supporting Material for the Fd to pressure conversion). Data from six cells at each pressure are provided to illustrate the range of cellular responses. Experimental and simulation data were aligned at the peak intensities.
The simulations with k1 = 14 s−1 reproduced the key features of the experimental observations (Fig. 5). The strain energy associated with cooperative interaction in these simulations was 3 kBT. Simulations with smaller at 1 and 2 kBT with different Fd values failed to reproduce the important experimental observations (not shown), suggesting that due to cooperative binding must be larger than 2 kBT under physiological conditions.
We can now account for the stress-induced accumulation of myosin II to the deformed cortex in the micropipette aspiration experiment. The majority of accumulated myosin diffuses from the cytoplasm to the tip region in the form of myosin monomers (Fig. 6 A), similar to the diffusion of myosin II to the cleavage furrow during cytokinesis. These monomers are then incorporated into the preexisting BTFs or assembled into new BTFs. The in-plane deformation of the actin cortex is greatest in the tip region inside the pipette (35, 36). Physically, the associated tension has to decay smoothly away from the tip region because of the gradual change of the cell shape and the continuity of the strain in cortex. We assumed that the tip of the cell has a shape close to a spherical cap and that the cortical tension T is a function of the position along the arc. A simple choice is T(θ) = ΔT cos θ, where θ is the polar angle measured from the tip to the edge (see Fig. S10) and ΔT is the tension drop. The force applied on each myosin head has a similar form: F(θ) = ΔF cos θ, where ΔF is the force drop, corresponding to the tension drop. The nonuniform force distribution profile may then result in different chemical equilibria of the BTF assembly kinetics at each position along the arc, leading to different local levels of myosin accumulation. Following this idea, we substituted the above force profile as boundary conditions into Eq. 3 and solved the three-dimensional reaction-diffusion equations for myosin BTF assembly using COMSOL software (see the Supporting Material).
Figure 6.
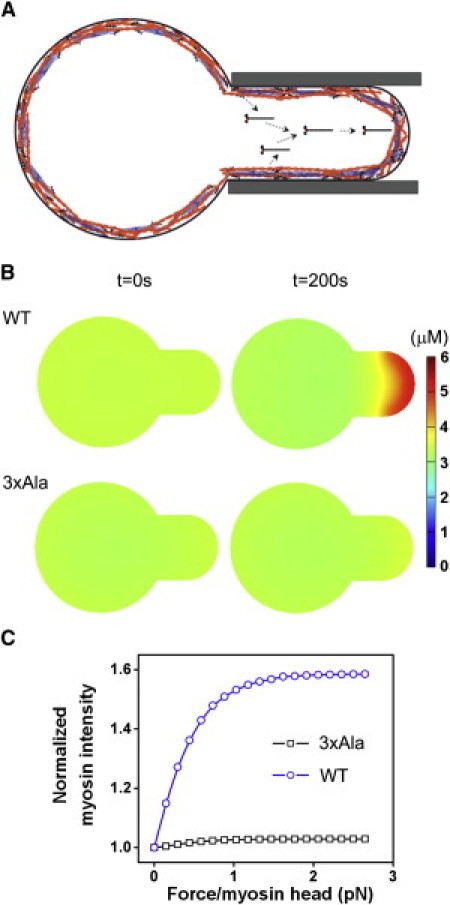
Spatial distribution of myosin BTFs in a mechanosensory response. (A) Cartoon diagram of myosin transport due to the spatial bias of force. (B) Spatial concentration of myosin at 200 s, calculated by solving the three-dimensional reaction-diffusion equations for WT myosin II and 3×Ala myosin II mutant. The associated movies for these two-dimensional simulations may be found in Movie S3 and Movie S4 in the Supporting Material. For comparison, a movie (see Movie S5) from a three-dimensional simulation is provided, which showed very similar results. (C) The myosin accumulation increased with the applied force on each myosin head (see Fig. S11 in the Supporting Material for an alternative representation).
We also incorporated WT actin polymer concentration along with the 1.1-fold ratio between the 0.5-μm-thick cortex and the cytoplasm (17, 28). We then simulated the initial myosin BTF profile and the evolution of the profile over 200 s immediately after the pressure jump for WT myosin II and the constitutively BTF-assembled mutant 3×Ala myosin II (Fig. 6 B; and see Movie S3, Movie S4, and Movie S5). The simulated distributions of WT myosin compare well with the experimental observations (Fig. 2; (3)). Further, the total concentration of myosin II that accumulated was 5 μM, yielding a ratio of normalized intensity of 1.6. This compares favorably with the average normalized ratio and concentrations measured for dividing cells (2, 3) and interphase cells (Figure 2, Figure 5 and Fig. S2). In contrast, the simulations of 3×Ala did not display notable accumulation, consistent with previous experimental observations (3). The simulated myosin II accumulation also increased with the force in agreement with experimental observations (compare Fig. 6 C and Fig. S11 to Figure 2, Figure 5 and Fig. S2).
This modeling scheme only accounts for the rising phase of the myosin accumulation. The falling phase after the peak is likely due to the accumulation of myosin heavy chain kinase C, which accumulates at the micropipette along with myosin II (see Fig. S12). This heavy chain kinase tracks its myosin II substrate, phosphorylating it to promote disassembly (19).
Discussion
To explain how mechanosensitive localization of myosin II occurs, we present a multiscale model based on a myosin bipolar thick filament assembly scheme that incorporates the contributions from cooperative and force-dependent myosin-actin binding. Using physiological protein concentrations and rate constants, our simulations replicate several major in vitro and in vivo experimental observations from the molecular scale to the cell level for both WT and 3×Ala myosin II. Additionally, the simulations provide predictions of the strain energy associated with cooperative binding. Although the simulations draw upon the protein concentrations in Dictyostelium cells, the assembly scheme can be easily adapted for the myosin assembly of other species because the k1 and k−1 that dictate the reactions have reported values in different systems (30), and the concentrations of F-actin and myosin in the cortex are relatively straightforward to measure.
In Dictyostelium cells, myosin II and the actin cross-linking protein cortexillin I accumulate at the cleavage furrow during cytokinesis, at the cell rear during motility, and in retracting pseudopods (37, 38). The heterocooperativity between myosin and cortexillin proposed here might be one mechanism that contributes to these localized accumulations, and the myosin BTF assembly scheme may be used to understand the kinetics of these dynamic processes. The proposed mechanism of cooperative localization involves conformational changes in the actin filament due, in part, to tension and consistent with this idea, mutant Dictyostelium myosin motor domains (S1 fragments) with increased actin affinity localize preferentially to actin filaments in mechanically stressed regions of the cortex (39). Undoubtedly, the principles described here are general and may be applicable to other myosin-mediated, force-dependent accumulation of heterologous proteins, such as in focal adhesions (40).
Overall, we provide a multiscale model that accounts for the in vivo cellular scale mechanosensitive accumulation of myosin II from the cooperative binding of the motor domain coupled to the assembly of bipolar thick filaments.
Acknowledgments
GFP-MHCKC plasmid is a gift from Tom Egelhoff.
This work is supported by the National Institutes of Health grants GM066817 (to D.N.R.) and GM86704 (to D.N.R. and P.A.I.), and the American Cancer Society grant RSG CCG-114122 (to D.N.R.).
Editor: Charles W. Wolgemuth.
Footnotes
Additional sections with supporting equations, three tables, 12 figures, and five movies are available at http://www.biophysj.org/biophysj/supplemental/S0006-3495(11)05422-1.
Contributor Information
Tianzhi Luo, Email: tzluo@jhu.edu.
Douglas N. Robinson, Email: dnr@jhmi.edu.
Supporting Material
References
- 1.Spudich J.A. The myosin swinging cross-bridge model. Nat. Rev. Mol. Cell Biol. 2001;2:387–392. doi: 10.1038/35073086. [DOI] [PubMed] [Google Scholar]
- 2.Effler J.C., Kee Y.-S., et al. Robinson D.N. Mitosis-specific mechanosensing and contractile protein redistribution control cell shape. Curr. Biol. 2006;16:1962–1967. doi: 10.1016/j.cub.2006.08.027. [DOI] [PMC free article] [PubMed] [Google Scholar]
- 3.Ren Y., Effler J.C., et al. Robinson D.N. Mechanosensing through cooperative interactions between myosin II and the actin crosslinker cortexillin I. Curr. Biol. 2009;19:1421–1428. doi: 10.1016/j.cub.2009.07.018. [DOI] [PMC free article] [PubMed] [Google Scholar]
- 4.Wozniak M.A., Chen C.S. Mechanotransduction in development: a growing role for contractility. Nat. Rev. Mol. Cell Biol. 2009;10:34–43. doi: 10.1038/nrm2592. [DOI] [PMC free article] [PubMed] [Google Scholar]
- 5.Greene L.E., Eisenberg E. Cooperative binding of myosin subfragment-1 to the actin-troponin-tropomyosin complex. Proc. Natl. Acad. Sci. USA. 1980;77:2616–2620. doi: 10.1073/pnas.77.5.2616. [DOI] [PMC free article] [PubMed] [Google Scholar]
- 6.Trybus K.M., Taylor E.W. Kinetic studies of the cooperative binding of subfragment 1 to regulated actin. Proc. Natl. Acad. Sci. USA. 1980;77:7209–7213. doi: 10.1073/pnas.77.12.7209. [DOI] [PMC free article] [PubMed] [Google Scholar]
- 7.Orlova A., Egelman E.H. Cooperative rigor binding of myosin to actin is a function of F-actin structure. J. Mol. Biol. 1997;265:469–474. doi: 10.1006/jmbi.1996.0761. [DOI] [PubMed] [Google Scholar]
- 8.Veigel C., Molloy J.E., et al. Kendrick-Jones J. Load-dependent kinetics of force production by smooth muscle myosin measured with optical tweezers. Nat. Cell Biol. 2003;5:980–986. doi: 10.1038/ncb1060. [DOI] [PubMed] [Google Scholar]
- 9.Uyeda T.Q., Abramson P.D., Spudich J.A. The neck region of the myosin motor domain acts as a lever arm to generate movement. Proc. Natl. Acad. Sci. USA. 1996;93:4459–4464. doi: 10.1073/pnas.93.9.4459. [DOI] [PMC free article] [PubMed] [Google Scholar]
- 10.Bobkov A.A., Muhlrad A., et al. Reisler E. Cooperative effects of cofilin (ADF) on actin structure suggest allosteric mechanism of cofilin function. J. Mol. Biol. 2006;356:325–334. doi: 10.1016/j.jmb.2005.11.072. [DOI] [PubMed] [Google Scholar]
- 11.De La Cruz E.M., Sept D. The kinetics of cooperative cofilin binding reveals two states of the cofilin-actin filament. Biophys. J. 2010;98:1893–1901. doi: 10.1016/j.bpj.2010.01.023. [DOI] [PMC free article] [PubMed] [Google Scholar]
- 12.Shin H., Purdy Drew K.R., et al. Grason G.M. Cooperativity and frustration in protein-mediated parallel actin bundles. Phys. Rev. Lett. 2009;103:238102. doi: 10.1103/PhysRevLett.103.238102. [DOI] [PMC free article] [PubMed] [Google Scholar]
- 13.Galkin V.E., Orlova A., Egelman E.H. Actin filaments as tension sensors. Curr. Biol. 2011 doi: 10.1016/j.cub.2011.12.010. In press. [DOI] [PMC free article] [PubMed] [Google Scholar]
- 14.Siddique M.S.P., Mogami G., et al. Suzuki M. Cooperative structural change of actin filaments interacting with activated myosin motor domain, detected with copolymers of pyrene-labeled actin and acto-S1 chimera protein. Biochem. Biophys. Res. Commun. 2005;337:1185–1191. doi: 10.1016/j.bbrc.2005.09.159. [DOI] [PubMed] [Google Scholar]
- 15.Mahajan R.K., Vaughan K.T., et al. Pardee J.D. Actin filaments mediate Dictyostelium myosin assembly in vitro. Proc. Natl. Acad. Sci. USA. 1989;86:6161–6165. doi: 10.1073/pnas.86.16.6161. [DOI] [PMC free article] [PubMed] [Google Scholar]
- 16.MacKintosh F.C. Active gels: motors keep dynamics steady. Nat. Mater. 2011;10:414–415. doi: 10.1038/nmat3028. [DOI] [PubMed] [Google Scholar]
- 17.Surcel A., Kee Y.-S., et al. Robinson D.N. Cytokinesis through biochemical-mechanical feedback loops. Semin. Cell Dev. Biol. 2010;21:866–873. doi: 10.1016/j.semcdb.2010.08.003. [DOI] [PMC free article] [PubMed] [Google Scholar]
- 18.Bao G., Suresh S. Cell and molecular mechanics of biological materials. Nat. Mater. 2003;2:715–725. doi: 10.1038/nmat1001. [DOI] [PubMed] [Google Scholar]
- 19.Yumura S., Yoshida M., et al. Egelhoff T.T. Multiple myosin II heavy chain kinases: roles in filament assembly control and proper cytokinesis in Dictyostelium. Mol. Biol. Cell. 2005;16:4256–4266. doi: 10.1091/mbc.E05-03-0219. [DOI] [PMC free article] [PubMed] [Google Scholar]
- 20.Schmit J.D., Kamber E., Kondev J. Lattice model of diffusion-limited bimolecular chemical reactions in confined environments. Phys. Rev. Lett. 2009;102:218302. doi: 10.1103/PhysRevLett.102.218302. [DOI] [PubMed] [Google Scholar]
- 21.Landau L.D., Lifshitz E.M. Elsevier; Oxford, UK: 1986. Theory of Elasticity. [Google Scholar]
- 22.Tokuraku K., Kurogi R., et al. Uyeda T.Q. Novel mode of cooperative binding between myosin and Mg2+-actin filaments in the presence of low concentrations of ATP. J. Mol. Biol. 2009;386:149–162. doi: 10.1016/j.jmb.2008.12.008. [DOI] [PubMed] [Google Scholar]
- 23.Murphy C.T., Spudich J.A. Dictyostelium myosin 25–50K loop substitutions specifically affect ADP release rates. Biochemistry. 1998;37:6738–6744. doi: 10.1021/bi972903j. [DOI] [PubMed] [Google Scholar]
- 24.Uehara R., Goshima G., et al. Griffis E.R. Determinants of myosin II cortical localization during cytokinesis. Curr. Biol. 2010;20:1080–1085. doi: 10.1016/j.cub.2010.04.058. [DOI] [PMC free article] [PubMed] [Google Scholar]
- 25.Mahajan R.K., Pardee J.D. Assembly mechanism of Dictyostelium myosin II: regulation by K+, Mg2+, and actin filaments. Biochemistry. 1996;35:15504–15514. doi: 10.1021/bi9618981. [DOI] [PubMed] [Google Scholar]
- 26.Sinard J.H., Stafford W.F., Pollard T.D. The mechanism of assembly of Acanthamoeba myosin-II minifilaments: minifilaments assemble by three successive dimerization steps. J. Cell Biol. 1989;109:1537–1547. doi: 10.1083/jcb.109.4.1537. [DOI] [PMC free article] [PubMed] [Google Scholar]
- 27.Moores S.L., Spudich J.A. Conditional loss-of-myosin-II-function mutants reveal a position in the tail that is critical for filament nucleation. Mol. Cell. 1998;1:1043–1050. doi: 10.1016/s1097-2765(00)80104-5. [DOI] [PubMed] [Google Scholar]
- 28.Reichl E.M., Ren Y., et al. Robinson D.N. Interactions between myosin and actin crosslinkers control cytokinesis contractility dynamics and mechanics. Curr. Biol. 2008;18:471–480. doi: 10.1016/j.cub.2008.02.056. [DOI] [PMC free article] [PubMed] [Google Scholar]
- 29.Berlot C.H., Devreotes P.N., Spudich J.A. Chemoattractant-elicited increases in Dictyostelium myosin phosphorylation are due to changes in myosin localization and increases in kinase activity. J. Biol. Chem. 1987;262:3918–3926. [PubMed] [Google Scholar]
- 30.Takács B., O'Neall-Hennessey E., et al. Kovács M. Myosin cleft closure determines the energetics of the actomyosin interaction. FASEB J. 2011;25:111–121. doi: 10.1096/fj.10-164871. [DOI] [PMC free article] [PubMed] [Google Scholar]
- 31.Kovacs M., Thirumurugan K., et al. Sellers J.R. Load-dependent mechanism of nonmuscle myosin 2. Proc. Natl. Acad. Sci. USA. 2007;104:9994–9999. doi: 10.1073/pnas.0701181104. [DOI] [PMC free article] [PubMed] [Google Scholar]
- 32.Ben-Naim A. Kluwer Academic/Plenum Publishers; New York: 2001. Cooperativity and Regulation in Biochemical Processes. [Google Scholar]
- 33.Cao W., Goodarzi J.P., De La Cruz E.M. Energetics and kinetics of cooperative cofilin-actin filament interactions. J. Mol. Biol. 2006;361:257–267. doi: 10.1016/j.jmb.2006.06.019. [DOI] [PubMed] [Google Scholar]
- 34.Zhou Q., Kee Y.-S., et al. Robinson D.N. 14–3-3 coordinates microtubules, rac, and myosin II to control cell mechanics and cytokinesis. Curr. Biol. 2010;20:1881–1889. doi: 10.1016/j.cub.2010.09.048. [DOI] [PMC free article] [PubMed] [Google Scholar]
- 35.Discher D.E., Boal D.H., Boey S.K. Simulations of the erythrocyte cytoskeleton at large deformation. II. Micropipette aspiration. Biophys. J. 1998;75:1584–1597. doi: 10.1016/S0006-3495(98)74076-7. [DOI] [PMC free article] [PubMed] [Google Scholar]
- 36.Derényi I., Jülicher F., Prost J. Formation and interaction of membrane tubes. Phys. Rev. Lett. 2002;88:238101. doi: 10.1103/PhysRevLett.88.238101. [DOI] [PubMed] [Google Scholar]
- 37.Moores S.L., Sabry J.H., Spudich J.A. Myosin dynamics in live Dictyostelium cells. Proc. Natl. Acad. Sci. USA. 1996;93:443–446. doi: 10.1073/pnas.93.1.443. [DOI] [PMC free article] [PubMed] [Google Scholar]
- 38.Xiong Y., Kabacoff C., et al. Iglesias P. Automated characterization of cell shape changes during amoeboid motility by skeletonization. BMC Syst. Biol. 2010;4:33. doi: 10.1186/1752-0509-4-33. [DOI] [PMC free article] [PubMed] [Google Scholar]
- 39.Uyeda T.Q.P., Iwadate Y., et al. Yumura S. Stretching actin filaments within cells enhances their affinity for the myosin II motor domain. PLoS ONE. 2011;6:e26200. doi: 10.1371/journal.pone.0026200. [DOI] [PMC free article] [PubMed] [Google Scholar]
- 40.Kuo J.-C., Han X., et al. Waterman C.M. Analysis of the myosin-II-responsive focal adhesion proteome reveals a role for β-Pix in negative regulation of focal adhesion maturation. Nat. Cell Biol. 2011;13:383–393. doi: 10.1038/ncb2216. [DOI] [PMC free article] [PubMed] [Google Scholar]
Associated Data
This section collects any data citations, data availability statements, or supplementary materials included in this article.