

Abstract
Insulin resistance is a defining feature of metabolic syndrome and type 2 diabetes mellitus but also may occur independently of these conditions. Nonalcoholic fatty liver disease (NAFLD), the hepatic manifestation of these disorders, increases the risk of hepatocellular carcinoma (HCC). However, mechanisms linking hyperinsulinemia to NAFLD and HCC require clarification. We describe a novel model of primary insulin resistance and HCC with strong parent-of-origin effects. Male AB6F1 (A/JCr dam × C57BL/6 sire) but not B6AF1 (B6 dam × A/J sire) mice developed spontaneous insulin resistance, NAFLD, and HCC without obesity or diabetes. A survey of mitochondrial, imprinted, and sex-linked traits revealed modest associations with X-linked genes. However, a diet-induced obesity study, including B6.A chromosome substitution–strain (consomic) mice, showed no segregation by sex chromosome. Thus, parent-of-origin effects were specified within the autosomal genome. Next, we interrogated mechanisms of insulin-associated hepatocarcinogenesis. Steatotic hepatocytes exhibited adipogenic transition characterized by vacuolar metaplasia and up-regulation of vimentin, adipsin, fatty acid translocase (CD36), peroxisome proliferator–activated receptor-γ, and related products. This profile was largely recapitulated in insulin-supplemented primary mouse hepatocyte cultures. Importantly, pyruvate kinase M2, a fetal anabolic enzyme implicated in the Warburg effect, was activated by insulin in vivo and in vitro. Thus, our study reveals parent-of-origin effects in heritable insulin resistance, implicating adipogenic transition with acquired anabolic metabolism in the progression from NAFLD to HCC.
Metabolic diseases, such as obesity, insulin resistance, metabolic syndrome, and type 2 diabetes mellitus (T2D), are reaching epidemic proportions.1 Serious comorbidities are associated with these conditions, including hypertension, cardiovascular disease, and increased risk for several types of cancer.2, 3 Nonalcoholic fatty liver disease (NAFLD), the hepatic manifestation of this group of disorders, increases the risk of hepatocellular carcinoma (HCC).4 HCC is the third leading cause of cancer deaths worldwide and the fastest increasing cancer in the United States.5 In a recent prospective study of asymptomatic, middle-aged adults from the United States, the prevalence of NAFLD as determined by ultrasonography and/or biopsy was found to be 46%.6 Nonalcoholic steatohepatitis (NASH), the more serious NAFLD subcategory defined by hepatic steatosis, inflammation, and ballooning degeneration, afflicts 12% of middle-aged Americans.6 As a result, NAFLD (specifically, NASH) may one day surpass hepatitis C virus infection as the leading cause of HCC in this country.
Genetic predisposition contributes to HCC risk on a metabolic background, but molecular markers of preneoplastic progression and hepatocellular transformation remain elusive. Moreover, because of extensive overlap in clinical presentation, it is difficult to ascribe hepatic consequences, such as NAFLD and HCC, to specific metabolic triggers. Existing animal models of metabolic hepatopathy are ill-equipped to address these questions because most exhibit obesity, insulin resistance, and/or T2D as part of a disease continuum. New models are needed to dissect the roles of individual metabolic parameters in the pathogenesis of hepatic steatosis and carcinogenesis. We describe a novel mouse model of primary insulin resistance and NAFLD leading to HCC in the absence of obesity or T2D. Intriguingly, the model exhibits strong parent-of-origin effects encoded predominantly within the autosomal genome, suggesting involvement of imprinted genetic elements that may serve as useful biomarkers and/or interventional targets. We used this model to probe mechanisms of hyperinsulinemic NAFLD and HCC and documented adipogenic transition of hepatocytes with reactivation of the anabolic enzyme pyruvate kinase M2 (PKM2), a fetal metabolic marker associated with the Warburg effect.7 Taken together, our results suggest that epistatic interactions between parent-specific loci play an important role in regulating insulin sensitivity and that hepatocellular adipogenic transition with acquired anabolic metabolism represents a potential mechanistic link between NAFLD and HCC.
Materials and Methods
Animals and Study Design
A/JCr mice (A/J) were purchased from the National Cancer Institute (Frederick, MD). C57BL/6J (B6) and B6.A chromosome substitution-strain (CSS; consomic) mice were obtained from the Jackson Laboratory (Bar Harbor, ME). Experiments were performed in facilities accredited by the Association for Assessment and Accreditation of Laboratory Animal Care. Mice were maintained in static microisolator cages under specific pathogen-free conditions for 11 murine viruses, Helicobacter spp., Salmonella spp., Citrobacter rodentium, ectoparasites, and endoparasites. Helicobacter-free status was confirmed by DNA PCR on pooled cage feces.8 In the first experiment, A/J and B6 mice were intercrossed and parent-of-origin records maintained to identify offspring as AB6F1 or B6AF1. All F1 offspring (n = 59) were fed the same rodent chow diet (Prolab RMH 3000; Scott's Distributing, Hudson, NH) and collected at 3, 9, or 15 months of age. In a follow-up diet-induced obesity (DIO) study, A/J, C57BL/6J-Chr XA/J/NaJ (B6.AX), C57BL/6J-Chr YA/J/NaJ (B6.AY), AB6F1, and B6AF1 mice were raised under standard conditions until 6 weeks of age and then randomly assigned into low-fat (LF) or high-fat (HF) diet groups (minimum of 8 animals per sex per group, n = 207). The LF diet contained 10 kcal percentage of fat and the HF diet 60 kcal percentage of fat (catalog numbers D12450B and D12492; Research Diets, New Brunswick, NJ). Mice were maintained on the LF or HF diet for 12 weeks. Mice in both studies were euthanatized via carbon dioxide inhalation according to recommendations of the AVMA Panel on Euthanasia. Protocols were compliant with the US Public Health Service Policy on Humane Care and Use of Laboratory Animals and approved by the Massachusetts Institute of Technology Committee on Animal Care and University of North Carolina Institutional Animal Care and Use Committee. Body weight was recorded and blood collected via cardiac puncture immediately after euthanasia. Full necropsies were performed and blood and tissues collected per our published protocols.9, 10
Blood and Tissue Analyses
Blood glucose concentrations were obtained using the One Touch Basic Glucometer (LifeScan, Milpitas, CA). Cholesterol concentrations were measured with the Accutrend GC (Roche Diagnostics, Branchburg, NJ). Serum insulin concentrations were determined with the Lincoplex rat/mouse insulin enzyme-linked immunosorbent assay kit (Millipore, Billerica, MA). The homeostatic model of assessment for insulin resistance was calculated as previously described.11 Parametric laboratory data among all groups were compared by one-way analysis of variance with Tukey's posttest and between pairs by Student's t-test using Prism software (GraphPad, San Diego, CA). P < 0.05 was considered significant. H&E-stained slides of liver were graded by a board-certified veterinary pathologist (A.B.R.) masked to sample identity for hepatic steatosis based on semiquantitative percentage of centrilobular and midzonal hepatocytes containing lipid vacuoles, with 0 indicating less than 5% of hepatocytes; 1, 5% to 25%; 2, 25% to 50%; 3, 50% to 75%; and 4, more than 75%. Macrovesicular and microvesicular steatosis were scored separately according to published morphologic criteria. The combined scores were added to generate a fatty liver index. Inflammation and dysplasia or neoplasia also were scored according to our published criteria.9 Nonparametric histopathology scores were compared among all groups by Kruskal-Wallis analysis of variance with Dunn's posttest and between pairs by the Mann-Whitney U-test. Frozen liver sections in OCT medium were cryosectioned and stained with Oil Red O for lipids. Immunohistochemistry for PKM2 (antibody 3198; Cell Signaling Technology, Beverly, MA) was performed on a Bond-III immunostainer (Leica, Bannockburn, IL) following techniques we have previously published.12
Gene Expression Analysis
mRNA was isolated from liver and assessed for quality as we have previously described.13 Tissues from two 9-month-old, male AB6F1 and B6AF1 mice were analyzed using the Mouse Genome 430A 2.0 Array (Affymetrix, Santa Clara, CA). Data were imported into Partek Genomics Suite (Partek, St. Louis, MO) using Robust Multichip Average and normalized by response variable. Data were filtered by presence or absence call by default Affymetrix algorithms, and P value (<0.05). Signal-fold changes of 1.5 or greater were considered significant. The complete data set was deposited in the NIH Gene Expression Omnibus (number GSE26225). Results for selected genes were validated and extended across all groups by SYBR Green quantitative RT-PCR (qRT-PCR) as described previously.14 Primers were designed using MacVector 11 software (MacVector Inc, Cary, NC). Unique primer sequences are presented in Table 1; all others as described by Amador-Noguez et al.15
Table 1.
Primer Sequences for qRT-PCR
| Gene | Forward | Reverse | Region |
|---|---|---|---|
| Mitochondrial | |||
| Cox1 | 5′-TGGAGGCTTTGGAAACTGACTTG-3′ | 5′-GAGAAGGAGAAATGATGGTGGTAGG-3′ | 325-436 |
| Cytb | 5′-GGTGCCACAGTTATTACAAACCTCC-3′ | 5′-AGCGAAGAATCGGGTCAAGG-3′ | 524-640 |
| Nd1 | 5′-CTTGTTCCCAGAGGTTCAAATCC-3′ | 5′-GGTTGTAAAATGCCGTATGGACC-3′ | 67-243 |
| Rnr2 | 5′-CAAGAACCCCGCCTGTTTACC-3′ | 5′-GTTGGACCCTCGTTTAGCCG-3′ | 926-1078 |
| Imprinted | |||
| Ctcf | 5′-TTTGTCACGCTCGGTTTACCC-3′ | 5′-TGCTGCTTTCGCAAGTGGAC-3′ | 1500-1647 |
| Dio3 | 5′-CAACAGTGAAGGCGAGGAGATG-3′ | 5′-TGGGCTTGCTTGAAGAAATCC-3′ | 260-391 |
| Grb10 | 5′-GGTTTTTCTCCGTTGTGACTCG-3′ | 5′-TTGGCTTCTTTGTTGTGGCG-3′ | 231-378 |
| H19 | 5′-TGTGATGGAGAGGACAGAAGGG-3′ | 5′-CAGAGAGCAGCAGAGAAGTGTTAGC-3′ | 972-1096 |
| Igf2 | 5′-TCGTGTTACCACCCAAAGACCC-3′ | 5′-GATGGAACTGTCCCTGCTCAAG-3′ | 1701-1842 |
| Igf2as | 5′-ATGAAGGGAAGGCTGGCTTG-3′ | 5′-CTGGTTTACAGGTCTGGTTTGAGC-3′ | 571-699 |
| Rtl1 | 5′-AGCGACAGTTCAAACCAGTCAAG-3′ | 5′-CTCGTCATCTCCCAGGTCAGTATC-3′ | 1042-1188 |
| Sgce | 5′-GCAGTCAAGAAATGGAGCCTGTG-3′ | 5′-GCCACGAACTACTTCCTGATAGGTG-3′ | 765-895 |
| X-linked | |||
| Arhgap6 | 5′-TCCACTTTGACTACGAGGTCCCAC-3′ | 5′-AGGAACTGACGATGCTTGCG-3′ | 594-722 |
| Atp11c | 5′-TTGATGGACCTGTAGAAGGAGCC-3′ | 5′-CCCAAAAATGTGAACCCAAACC-3′ | 1589-1691 |
| Bgn | 5′-CGGATGATTGAGAATGGGAGCC-3′ | 5′-CCTTGGTGATGTTGTTGGAGTGC-3′ | 941-1088 |
| Bhlhb9 | 5′-AAAGGGAAAGGTAAGGCAGGC-3′ | 5′-TCCTATGGTTGAAATCTGAGGTGC-3′ | 266-413 |
| Cd99l2 | 5′-GGTCCCAAAAAGCCAAGTGC-3′ | 5′-GGTCATCGTTGCTGCCATAACC-3′ | 313-442 |
| Efnb1 | 5′-AAGTGGCTTGTGGCTATGGTCG-3′ | 5′-GCTTGTCTCCAATCTTCGGGTAG-3′ | 788-935 |
| EG245643 | 5′-TCTCTGCTTGGTTGAACGCAC-3′ | 5′-ATGCCCGAAGAATCAGTCAGG-3′ | 1153-1293 |
| Flna | 5′-TTCTCTGTCTGGTATGTCCCTGAAG-3′ | 5′-TCACTTTGCTGGCATCACCC-3′ | 1122-1251 |
| Gpc4 | 5′-TCCTCCTCCTCCTTCACTACCAAC-3′ | 5′-ACCTTTAGGGGACAGAATGAGACC-3′ | 315-442 |
| Gyk | 5′-CCAAGAGAAGGATGGGTAGAACAAG-3′ | 5′-GCTGACACCAATGGCTTTGATG-3′ | 458-589 |
| Ikbkg | 5′-GCTGGTGGAGAAGAAGGAGTATTTG-3′ | 5′-TGGAGCAGGGAGTAAAGGAGGC-3′ | 957-1110 |
| Msn | 5′-GCGGTCCTGTTGGCTTCTTATG-3′ | 5′-CCTTGTTGAGTTTGTGCTGCTCC-3′ | 551-683 |
| Pdzd11 | 5′-CCTATGAAAACCCTCCAGCGTG-3′ | 5′-AAATCCCAACTGAGCACCAGG-3′ | 156-286 |
| Praf2 | 5′-AGAGCATCGGTCTAAAGCGGAC-3′ | 5′-AAAGGGTTGGTCTTGGGTATGG-3′ | 475-613 |
| Prdx4 | 5′-CCTCTTCTTTCTGACCTGAACCATC-3′ | 5′-AACCAAACGCAGTGTCTCGTCCAC-3′ | 622-795 |
| Satl1 | 5′-ACCTGCTGAGCCTGAAGATTGC-3′ | 5′-TGTCCCCAAAACCATCCCTG-3′ | 1743-1867 |
| Serpina7 | 5′-TGTCTTGGTATTTGGGCTTCAGG-3′ | 5′-GAGTGGCATTTTGTTGGGGC-3′ | 24-124 |
| Slc25a5 | 5′-GCCTGACTTCCTATCCTTTTGACAC-3′ | 5′-AAGCCTTGCTCCCTTCATCG-3′ | 754-888 |
| Stard8 | 5′-TTGTTAGGTCTTGTCCCCAGCC-3′ | 5′-CACCCTTTTCTTTCCTCCTCAGAG-3′ | 570-714 |
| Sytl4 | 5′-TCGGCGACTGAAGAATGAGC-3′ | 5′-CACACAAGTGCTGCTTTTGGG-3′ | 293-428 |
| Tceal8 | 5′-GCAAAAGTCTTGTGACGAGAACG-3′ | 5′-ATGGCTCCCTTCAGTTTCCTCC-3′ | 174-321 |
| Tmsb4x | 5′-TGGCGAATCGTAATGAGGCG-3′ | 5′-TGATGTGAAAGGGGCAGCAC-3′ | 351-500 |
| Ubl4 | 5′-TTCAGTGTAGCAGATGCCAGCAGG-3′ | 5′-CCCTTTTTCCATAGCCTCAGTCAC-3′ | 383-526 |
| Uty | 5′-AGATAGCCTCTGCCGCTTTCTC-3′ | 5′-GCCGCCATTTTCTTTTCCTC-3′ | 251-351 |
| Wdr40b | 5′-CCTTCAGCAACAAAAACCAGGAG-3′ | 5′-TTCTCACGGCAATAGGGCAG-3′ | 1153-1273 |
| Xlr3a | 5′-GGCTTTCTTTGACATTCTGCTCTG-3′ | 5′-CATCTTTCTTACTCGGGAGGTTTG-3′ | 1074-1207 |
| Xlr3b | 5′-ATCTTCTCCTGTCTTCCTCCTGTTC-3′ | 5′-AAAGCCTGCCATCTCTACCTGAG-3′ | 843-976 |
| Y-linked | |||
| Uty | 5′-AGATAGCCTCTGCCGCTTTCTC-3′ | 5′-GCCGCCATTTTCTTTTCCTC-3′ | 251-351 |
| Other | |||
| Acot10 | 5′-AAATCACAGAAAGTCCTACCACCG-3′ | 5′-TCAAAGTCCTCAAGAATCCTGCC-3′ | 311-456 |
| Des | 5′-AACATCTCTGAGGCTGAAGAATGG-3′ | 5′-TCAATCTCGCAGGTGTAGGACTGG-3′ | 933-1078 |
| Egr1 | 5′-TAATAGCAGCAGCAGCACCAGC-3′ | 5′-CAGAGCGATGTCAGAAAAGGACTC-3′ | 562-703 |
| Hnf3b | 5′-CACTGGGGACAAGGGAAATGAG-3′ | 5′-TTAGGGACACAGACAGGTGAGACTG-3′ | 1624-1737 |
| Hnf4a | 5′-TTCTGCGAACTCCTTCTGGATG-3′ | 5′-CGAGGGACGATGTAGTCATTGC-3′ | 839-975 |
| Hspb1 | 5′-ACAGTGAAGACCAAGGAAGGCG-3′ | 5′-ACCTGGAGGGAGCGTGTATTTC-3′ | 337-450 |
| Ifng | 5′-AGCAAGGCGAAAAAGGATGC-3′ | 5′-AATCTCTTCCCCACCCCGAATCAG-3′ | 453-625 |
| Il1b | 5′-GTGAAATGCCACCTTTTGACAGTG-3′ | 5′-TGTTGATGTGCTGCTGCGAG-3′ | 94-240 |
| Il6 | 5′-TGGAGCCCACCAAGAACGATAG-3′ | 5′-CACCAGCATCAGTCCCAAGAAG-3′ | 109-208 |
| Saa1 | 5′-TTTGTTCACGAGGCTTTCCAAG-3′ | 5′-CCTTTGAGCAGCATCATAGTTCCC-3′ | 103-228 |
| Tnfa | 5′-GCAGGTTCTGTCCCTTTCACTCAC-3′ | 5′-TTCTGGAAGCCCCCCATCTTTTGG-3′ | 95-233 |
Primary Hepatocyte Isolation and Culture
Primary mouse hepatocytes were derived from collagenase-digested, 8-week-old, male, B6 mouse livers and isolated and cultured following protocols described elsewhere with minor modification.16 Briefly, murine livers were sequentially perfused in situ with 25 mL of calcium-free EGTA-containing buffer followed by 50 mL of buffered saline containing 0.3 mg/mL of type IV collagenase (Roche Diagnostics Corp, Indianapolis, IN) at 37°C. After perfusion, collagenase-treated livers were dissociated by mincing with scissors followed by passage through a 100-μm-pore nylon mesh. Hepatocytes were purified via repeated (three times) low-speed (50 × g) centrifugation. Cell purity was assessed by light microscopy and by fluorescence-assisted cell sorting. For the latter, 1 × 10⁵ cells were labeled with anti-CD45/leukocyte-common antigen or anti-Fas (CD95) antibodies (or appropriate conjugated isotype control antibodies; all from eBioscience, San Diego, CA) for 30 minutes at room temperature followed by evaluation on an Accuri C6 Flow Cytometer (Ann Arbor, MI). Purified hepatocytes were grown on collagen I–coated matrices (BD Biocoat; BD Biosciences, Franklin Lakes, NJ) in Dulbecco's modified Eagle medium with 10% fetal bovine serum, penicillin-streptomycin, and 2 mmol/L l-glutamine. Subsets of cells were supplemented with insulin (5 mg/L), transferrin, and selenium with or without dexamethasone (10 mmol/L; both Sigma, St. Louis, MO). After 1 or 4 days, cells were harvested and RNA isolated followed by qRT-PCR as described above. Cell viability was determined using a 3-(4,5-dimethylthiazol-2-yl)−2,5-diphenyltetrazolium bromide kit according to the manufacturer's instructions (Molecular Probes, Eugene, OR). For assessment of hepatocyte morphologic characteristics, cell suspensions were dropped onto silanized glass slides, fixed in chilled acetone for 10 minutes, and stained with Diff-Quik (Fisher Scientific, Pittsburgh, PA).
Results
Insulin Resistance Without Obesity or T2D in AB6F1 Male Mice
We characterized the phenotype of A×B F1 mice fed a standard rodent chow diet for 3, 9, or 15 months. First, body and liver weights were determined. AB6F1 male mice weighed 15% to 23% more than age-matched B6AF1 controls when compared across time points (Figure 1). Although this difference was statistically significant, AB6F1 mice were not morbidly obese and could not be visually distinguished from B6AF1 male mice. Female AB6F1 mice also weighed slightly more than B6AF1 female mice, but the difference was statistically insignificant (not shown). A×B F1 mice of both sexes weighed more than published mean body weights for either parental inbred strain (Mouse Phenome Database; Jackson Laboratory). Thus, hybrid mice were larger than parental strains, but morbid obesity was not a component of the F1 phenotype. At necropsy, it was noted that the livers of many male mice were enlarged and pale. Absolute liver weight and liver:body weight ratios were found to be greater in AB6F1 than B6AF1 male mice at 9 and 15 months (Figure 1). Male AB6F1 mice had significantly increased serum insulin levels relative to B6AF1 male mice at all time points. Nevertheless, despite increased serum insulin levels in AB6F1 male mice, no significant differences were found in mean blood glucose concentration between any groups regardless of sex or time point (not shown). Moreover, no animals developed polyuria, polydipsia, hyperphagia, and/or body wasting characteristic of diabetes.17 Thus, despite high circulating insulin levels, AB6F1 mice did not exhibit obesity or T2D. These results demonstrate that AB6F1 but not B6AF1 male mice develop spontaneous hyperinsulinemia on a standard chow diet and that this insulin resistance is not associated with morbid obesity, metabolic syndrome, or T2D.
Figure 1.
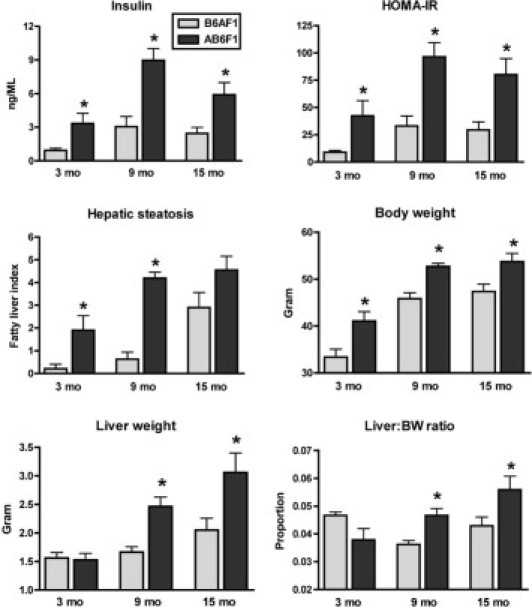
Clinical metabolic parameters in AB6F1 versus B6AF1 male mice. AB6F1 male mice developed early and progressive insulin resistance and hepatic steatosis (fatty liver). Although AB6F1 male mice also had moderately increased body mass compared with B6AF1 mice, neither morbid obesity nor hyperglycemia (not shown) was a component of the phenotype. *P < 0.05 compared with age-matched B6AF1 mice.
Hyperinsulinemic NAFLD and HCC in AB6F1 Male Mice
Masked histopathologic assessment of livers from A×B F1 mice revealed mild-to-moderate hepatic steatosis in a subset of animals by 3 months of age, marked steatosis by 9 months, and severe steatosis with dysplasia and/or HCC by 15 months. When the results were decoded, it was confirmed that the most significant lesions arose in hyperinsulinemic AB6F1 male mice (Figure 2A). B6AF1 male mice showed no or minimal liver lesions at 3 and 9 months of age. However, 50% of BA6F1 male mice exhibited mild-to-moderate steatosis at 15 months. In AB6F1 male mice, histologic changes characteristic of insulin resistance were identified in tissues besides the liver as well. These changes included WAT degeneration with F4/80+ pericellular macrophages forming crown-like rosettes, thoracic BAT metaplasia to a WAT phenotype, focal skeletal muscle degeneration with fatty replacement, and pancreatic islet hyperplasia with occasional megaislets (Figure 2B). Within the liver, preneoplastic and neoplastic lesions, including foci of cellular alteration, dysplastic nodules, and HCC, were limited to AB6F1 male mice (incidence of 30% versus 0% in BA6F1; Figure 2C). This finding is significant because spontaneous HCC is rare in wild-type (WT) A/J and B6 strains within the typical 24-month lifespan (Mouse Phenome Database). Because high insulin levels also have been associated with tumors of the pancreas and lower bowel,18, 19 we examined those organs grossly and histologically but found no neoplastic or preneoplastic lesions (not shown). The findings of histopathologic analysis of female mouse tissues, including the liver, were unremarkable. These findings are consistent with the male predominance of metabolic and neoplastic liver disease documented in humans and other rodent models.6, 20 Viewed together these results demonstrate that hyperinsulinemia, in the absence of morbid obesity, metabolic syndrome, or T2D, is sufficient to induce HCC in mice.
Figure 2.
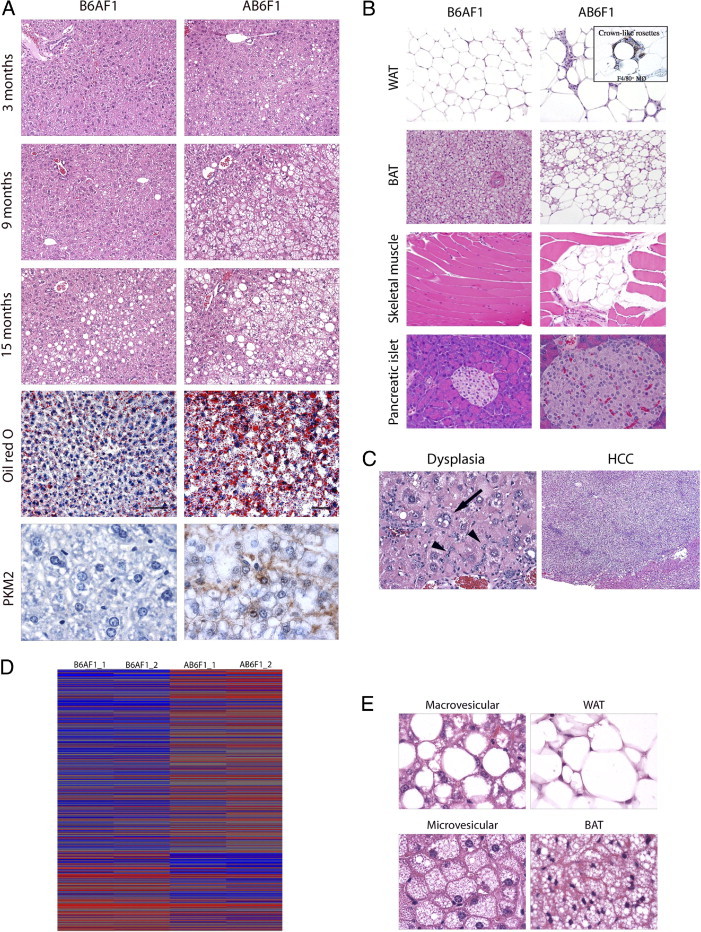
Histopathologic and genomic comparison of AB6F1 versus B6AF1 male mice. A: AB6F1 male mice exhibited more severe fatty liver lesions than B6AF1 male mice at all time points; lipid-filled vacuoles were verified by Oil Red O staining of frozen sections; immunohistochemical demonstration of PKM2 in AB6F1 neoplastic hepatocytes but not B6AF1 normal tissue. B: AB6F1 liver demonstrating focus of cellular alteration and dysplasia characterized by marked pleomorphism, intranuclear pseudoinclusions (arrow) and oval cell hyperplasia (arrowheads; left); HCC arising on a background of metabolic hepatopathy (right). C: Survey of nonhepatic, insulin resistance–associated histologic lesions in AB6F1 male mice, including WAT degeneration with macrophage proliferation forming F4/80+ crown-like rosettes, metaplasia of thoracic BAT to a WAT phenotype, focal skeletal muscle degeneration with fatty replacement, and pancreatic hyperplasia with occasional megaislets. D: Microarray heat map demonstrating hierarchal clustering of AB6F1 versus B6AF1 male mice at 9 months. E: Histologic comparison of macrovesicular steatosis with WAT (top) and microvesicular steatosis with BAT (bottom), consistent with transcriptional alterations characteristic of adipogenic transition. Original magnification: ×100 (A); ×400 (A, bottom); ×400 (B, left); ×40 (B, right); ×200 (C); ×400 (E).
NAFLD-Associated Cytokine Induction, Acute-Phase Responses, and Hepatic Feminization
To determine the global impact of hepatic steatosis on gene expression, we performed microarray analysis of liver samples from 9-month-old, male AB6F1 and B6AF1 mice. Hierarchal clustering analysis using Partek Genomics Suite demonstrated clear segregation of the two genotypes (Figure 2D). Four interrelated pathophysiologic processes were evident in the steatotic male AB6F1 liver: inflammation, acute-phase responses, transcriptional feminization, and metabolic derangement. Numerous proinflammatory genes products were up-regulated, including Stat1, interferon-γ–induced GTPases, interferon-activated or regulatory factors, histocompatibility 2 class II antigens, and others (top 10 altered genes are listed in Table 2; complete data set available at Gene Expression Omnibus number GSE26225). Acute-phrase response induction was confirmed by the up-regulation of canonical acute-phase murine gene products, including lipocalin 2, serum amyloid A1 and A2, orosomucoid, and metallothioneins 1 and 2.13 Of note, all of these transcriptional changes occurred in the absence of histologic hepatitis, demonstrating that NAFLD produces a morphologically covert proinflammatory microenvironment. Nonspecific injury of the male mouse liver frequently leads to loss of sex-specific gene expression characterized by transcriptional feminization.14 Accordingly, we found a significant bias for sex-dependent transcriptional alterations in the feminine direction in AB6F1 male mice with NAFLD. Feminine mRNA up-regulated in the steatotic male liver included sulfotransferase 2a2 and Sult3a1, cytochrome P450 2b13 (Cyp2b13), lymphocyte antigen 6 complex locus D, ATP-binding cassette D2, fatty acid–binding protein 5 (epidermal), and acyl-CoA thioesterase 3. Simultaneously, masculine mRNA were down-regulated in the male AB6F1 liver, including solute carrier organic anion transporter 1a1, hydroxysteroid dehydrogenase 3β-V, elongation of very long chain fatty acids–like 3, elastase-1 (pancreatic), and Cyp7b1. Although many of the metabolic gene alterations in AB6F1 male mice were attributable to hepatic feminization, sex-neutral gene products associated with metabolic function also were dysregulated, including potassium channel T2, complement factor D (adipsin), sulfotransferase 5A1, and insulin-like growth factor binding protein 2. Taken together, these data demonstrate that insulin resistance and NAFLD are sufficient to invoke robust hepatic transcriptional alterations related to inflammation, metabolism, and sex-dependent liver function.
Table 2.
Top 10 Up- and Down-Regulated Liver Genes in AB6F1 Versus B6AF1 Male Mice at 9 Months
| Gene symbol | Gene description | Fold | AB6F1 | B6AF1 |
|---|---|---|---|---|
| Up-regulated in AB6F1 male mice | ||||
| Sult2a2 | Sulfotransferase family 2A, dehydroepiandrosterone-preferring, member 2 | 239.98 | 10,823 | 45 |
| Kcnt2 | Potassium channel, subfamily T, member 2 | 35.57 | 2367 | 67 |
| Sult3a1 | Sulfotransferase family 3A, member 1 | 21.61 | 769 | 36 |
| Cyp2b13 | Cytochrome P450, family 2, subfamily b, polypeptide 13 | 14.74 | 9501 | 645 |
| Cfd | Complement factor D (adipsin) | 11.76 | 3807 | 324 |
| Lcn2 | Lipocalin 2 | 11.68 | 3823 | 327 |
| Thbs1 | Thrombospondin 1 | 8.51 | 403 | 47 |
| Ly6d | Lymphocyte antigen 6 complex, locus D | 8.24 | 610 | 74 |
| Saa2 | Serum amyloid A 2 | 8.18 | 4562 | 558 |
| Orm2 | Orosomucoid 2 | 8.02 | 7225 | 901 |
| Down-regulated in AB6F1 male mice | ||||
| Slco1a1 | Solute carrier organic anion transporter family, member 1a1 | −95.73 | 59 | 5682 |
| Hsd3b5 | Hydroxy-delta-5-steroid dehydrogenase, 3 beta- and steroid delta-isomerase 5 | −62.08 | 37 | 2272 |
| Atp10a | ATPase, class V, type 10A | −14.30 | 4 | 55 |
| Usp3 | Ubiquitin specific peptidase 3 | −9.53 | 10 | 98 |
| Clec2h | C-type lectin domain family 2, member h | −7.85 | 50 | 389 |
| Serpine2 | Serine (or cysteine) peptidase inhibitor, clade E, member 2 | −7.57 | 121 | 915 |
| Evi5 | Ecotropic viral integration site 5 | −7.28 | 10 | 74 |
| Susd4 | Sushi domain containing 4 | −6.05 | 166 | 1003 |
| Elovl3 | Elongation of very long chain fatty acids (FEN1/Elo2, SUR4/Elo3, yeast)-like 3 | −5.58 | 2752 | 15,358 |
| Satl1 | Spermidine/spermine N1-acetyl transferase-like 1 | −5.18 | 11 | 59 |
Expression determined by microarray (mean signal density shown at right).
Parent-of-Origin Effects Not Linked to Known Maternal or Paternal Genes
There are three known sources of parent-specific gene expression: mitochondrial DNA, imprinted loci, and sex-linked genes.21 Genes transcribed from mitochondrial DNA are maternal in origin, imprinted genes are transcribed from a single parental allele, and sex chromosomes are inherited in a parent-specific manner in males. Because of the strong parent-of-origin effects in A×B F1 mice, we used qRT-PCR to interrogate genes that met any of those criteria and were shown to be differentially expressed by microarray. In addition, we analyzed known parent-specific genes canonically associated with metabolism. Altogether, we assessed 4 mitochondrial DNA transcripts, 8 imprinted alleles, and 29 sex-linked genes in all male mice (Table 1). No imprinted or mitochondrially encoded gene exhibited differential expression between AB6F1 and B6AF1 mice (data not shown). In contrast, four X-linked genes showed a positive correlation with NAFLD at one or more time points. Of these, three were up-regulated at 9 and 15 months only (Frmpd3, Slc25a5, Tmsb4x), suggesting an associative rather than causative relationship. The only X-linked gene up-regulated at all time points in AB6F1 male mice was thyroxine-binding globulin (TBG; Serpina7). Interestingly, this gene also was increased in B6AF1 male mice with steatosis at 15 months. However, in all affected animals TBG up-regulation was modest (approximately twofold) and showed no linear correlation with NAFLD severity (data not shown). Further work will be required to determine whether TBG contributes to the pathogenesis of insulin resistance and NAFLD or is merely a bystander. Viewed as a whole, our PCR survey failed to identify a robust candidate among known uniparentally expressed genes to account for the significant parent-specific metabolic phenotype in A×B F1 male mice, suggesting that the disease is polyfactorial and may involve epigenetic mechanisms.
Sex- and Strain-Specific Responses to High-Fat Diet in CSS and F1 Mice
Because we found some associations between X-linked genes and the AB6F1 metabolic phenotype, we performed a follow-up DIO study using sex chromosome substitution strain B6.A mice. These animals were on a B6 background except for an A/J-derived sex chromosome.22 Also included were A×B F1 mice along with a WT A/J control group. An additional control group of WT B6 mice had to be excluded due to poor breeding kinetics that resulted in insufficient numbers. In agreement with the first study showing increased BW in A×B F1 mice relative to the parent strains, B6AF1 and AB6F1 mice on the LF diet weighed significantly more than sex-matched A/J and CSS strains (Table 3). All mice on the HF diet weighed significantly more than sex- and strain-matched animals on the LF diet. However, as a percentage of baseline body mass, CSS mice on the HF diet gained more weight than A/J and F1 mice. This was especially true of B6.AX male mice, which weighed less than all other male groups on the LF diet but the same as all but the A/J male mice on the HF diet. In A/J and CSS mice, serum insulin levels increased in relative proportion to body mass on the HF diet. In stark contrast, insulin levels were significantly lower in B6AF1 and significantly higher in AB6F1 male mice compared with CSS mice despite nearly identical body weights (Figure 3). A similar dichotomy between serum insulin and body mass was observed in female F1 mice on the HF diet. Thus, insulin resistance in F1 mice was regulated by distinct mechanisms from those governing diet-induced weight gain. Female CSS and A×B F1 but not A/J mice on the HF diet exhibited mild-to-moderate macrovesicular steatosis that did not vary by strain (data not shown). Male A/J mice on the HF diet developed moderate patchy macrovesicular steatosis, whereas CSS and F1 male mice developed severe diffuse mixed hepatic steatosis (mean fatty liver index = 5/8; not shown). The proportion of microvesicular-to-macrovesicular steatosis varied within but not between groups. Viewed as a whole, these results demonstrated that weight gain and hepatic steatosis increased in tandem in response to the HF diet, whereas insulin resistance was distinctly regulated in F1 male and female mice. Indeed, B6AF1 mice were protected from DIO-associated insulin resistance compared with CSS mice, whereas AB6F1 mice displayed exaggerated hyperinsulinemia in response to caloric overload. This finding suggests synergy in epistatic interactions between parent-specific alleles in hybrid mice, resulting in a marked shift in insulin sensitivity in a positive or negative direction. Taken together, these results show that insulin resistance is not directly correlated with increased body mass and that additional genetic factors determine the metabolic consequences of diet-induced obesity.
Table 3.
Comparison of Body Weight and Serum Insulin in A/J, B6.AX, B6.AY, B6AF1, and AB6F1 Female and Male Mice on a LF versus HF Diet
| A/J | B6.AX | B6.AY | B6AF1 | AB6F1 | |
|---|---|---|---|---|---|
| F BW LF diet | 23.0 ± 0.5 | 21.2 ± 0.7 | 21.0 ± 0.5 | 25.8 ± 1.2 | 26.9 ± 0.7 |
| F BW HF diet | 31.7 ± 1.4 | 30.0 ± 1.5 | 30.8 ± 2.3 | 39.0 ± 1.4 | 40.4 ± 3.3 |
| F BW % increase | 38 | 42 | 47 | 51 | 51 |
| M BW LF diet | 29.6 ± 0.7 | 26.7 ± 1.2 | 31.0 ± 0.8 | 34.6 ± 0.9 | 34.4 ± 1.2 |
| M BW HF diet | 37.4 ± 2.3 | 45.2 ± 1.1 | 46.9 ± 1.0 | 44.8 ± 0.9 | 46.8 ± 1.0 |
| M BW % increase | 26 | 69 | 51 | 29 | 36 |
| F insulin LF diet | 1.2 ± 0.3 | 1.2 ± 0.1 | 1.2 ± 0.1 | 1.2 ± 0.1 | 1.6 ± 0.4 |
| F insulin HF diet | 1.9 ± 0.7 | 2.4 ± 0.3 | 1.9 ± 0.3 | 3.7 ± 0.6 | 5.8 ± 1.1 |
| F insulin % increase | 58 | 200 | 58 | 308 | 363 |
| M insulin LF diet | 2.4 ± 0.3 | 1.6 ± 0.2 | 2.3 ± 0.2 | 4.0 ± 0.9 | 4.1 ± 0.8 |
| M insulin HF diet | 4.7 ± 0.3 | 9.6 ± 2.1 | 11.2 ± 2.2 | 6.8 ± 1.0 | 16.8 ± 1.3 |
| M insulin % increase | 196 | 600 | 487 | 170 | 410 |
Body weight (BW) presented as mean ± SEM in grams. Serum insulin presented as mean ± SEM in nanograms per deciliter.
F, female; M, male; HF, high fat; LF, low fat.
Figure 3.
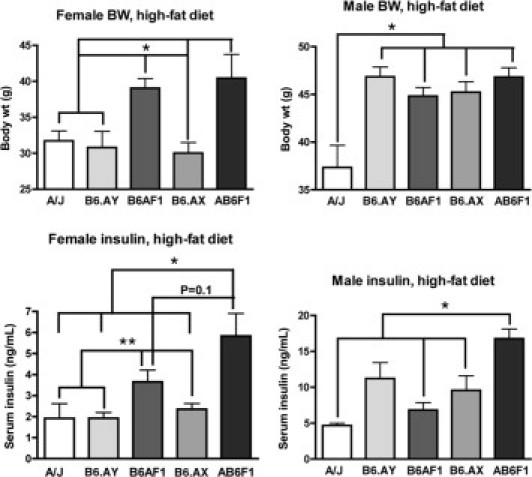
Serum insulin and body weight comparison of A/J, B6.AX, B6.AY, B6AF1, and AB6F1 mice on a HF diet. Note dissociation between body weight and serum insulin levels in F1 mice compared with other groups. *P < 0.05, **P < 0.1.
Insulin Resistance Invokes Adipogenic Transition of Hepatocytes and Reactivates PKM2
Because of the remarkable histologic similarity between steatotic hepatocytes and adipocytes (Figure 2E), we wondered whether fatty liver was associated with molecular changes characteristic of adipogenic transition.23 By microarray and qRT-PCR, we found numerous examples of adipocyte-associated genes that were up-regulated in the livers of 9-month-old AB6F1 mice with NAFLD compared with B6AF1 controls. As mesenchymal cells, adipocytes express a number of canonical genes not typically expressed in hepatocytes and other epithelial tissues. Mesenchymal cell markers that were increased in the livers of mice with NAFLD included vimentin, platelet-derived growth factor-β, and collagen 3α-1 (Figure 4A). In addition, there was up-regulation of more specific adipocyte-associated gene products, including complement factor D (adipsin), fatty acid translocase (CD36), fatty acid binding protein-4 (adipocyte), and peroxisome proliferator–activated receptor-γ (PPAR-γ). Of singular importance, the fetal isoform of pyruvate kinase, Pkm2, was up-regulated nearly twofold in 9-month-old mice with NAFLD. Functional protein expression was confirmed by immunohistochemistry, where cytoplasmic and nuclear PKM2 localization was visualized in neoplasms from AB6F1 mice but not in normal B6AF1 liver (Figure 2A). These results confirm that chronic hyperinsulinemia invokes adipogenic transition of hepatocytes and invokes metabolic pathways in an improper context that may contribute to cellular transformation.
Figure 4.
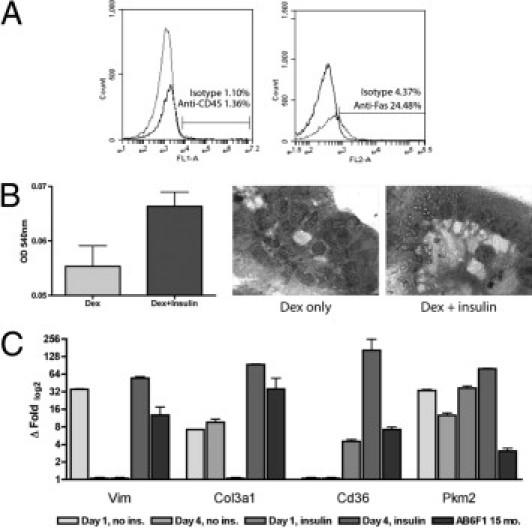
Primary hepatocyte isolation and culture. A: Flow cytometry demonstrating less than 2% white blood cell contamination of enriched hepatocyte population; approximately 25% of hepatocytes labeled with anti-CD95/Fas antibody. B: 3-(4,5-dimethylthiazol-2-yl)−2,5-diphenyltetrazolium bromide assay demonstrating strong trend (P = 0.07) for increased viability of insulin-supplemented cells versus dexamethasone alone after 4 days of culture. Photomicrographs demonstrate organization of hepatocytes into crude canaliculi, with increased clear (lipid) cytoplasmic vacuoles in insulin-supplemented cells (original magnification, ×1000). C: qRT-PCR of insulin-supplemented primary hepatocytes (dark gray columns), especially on day 4 of culture, demonstrating increased expression of adipocyte-associated genes, including vimentin, collagen 3α-1, fatty acid translocase (CD36), and PKM2, compared with nonsupplemented cells (light gray columns); these genes also were up-regulated in AB6F1 versus B6AF1 male mice at 15 months of age (black columns).
Insulin-Dependent Adipogenic Transition and PKM2 Activation in Cultured Hepatocytes
To validate our in vivo findings and confirm that transcriptional alterations reflected changes in parenchymal and not accessory liver cells, we harvested, purified, and cultured primary mouse hepatocytes. To ensure purity, we performed fluorescence-activated cell sorter analysis, which confirmed less than 2% contamination by white blood cells (Figure 4A). Approximately 25% of the purified hepatocytes were positively labeled with an anti-CD95/Fas antibody, in keeping with the known low level of Fas surface expression in healthy mouse liver.24 To ensure that our cultured cell population was primarily hepatocytes, we performed qRT-PCR for albumin and Apoa1 on freshly purified cells and found gene expression levels similar to those from intact mouse liver RNA (not shown). Primary hepatocytes grown in the presence of insulin exhibited greater viability after 4 days than did those grown without insulin supplementation (Figure 4B). Under all growth conditions, primary hepatocytes organized into crude canalicular structures; however, insulin-supplemented cells exhibited clear cytoplasmic lipid-storage vacuoles that were not evident in cells grown in the presence of dexamethasone alone (Figure 4B). Insulin supplementation to primary hepatocytes resulted in up-regulation of many of the same adipocyte-associated gene products we documented in AB6F1 mice with NAFLD, including but not limited to vimentin, collagen 3α-1, fatty acid translocase (CD36), and Pkm2 (Figure 4C). Taken together, these results confirm that supraphysiologic levels of insulin promote hepatocyte survival and invoke activation of adipocyte-associated metabolic pathways that may contribute to hepatocellular transformation.
Discussion
Beneath the current wave of obesity and T2D lurks a larger swell of subclinical metabolic disease. In some settings, up to 75% of individuals with NAFLD are nonobese.25 Most diagnoses of NAFLD in the United States are made in patients without previously identified risk factors. Indeed, in a recent study, nearly half of clinically healthy middle-aged adults in the United States exhibited NAFLD by ultrasonography and/or biopsy.6 The potential impact of covert insulin resistance and NAFLD on a national scale is unknown. However, it is noteworthy that HCC continues to increase in the United States despite steady or decreasing levels of viral hepatitis and alcoholism. Indeed, NAFLD/NASH may one day surpass HCV infection as the leading cause of liver cancer in the United States.5
Because of the complex interactions between metabolic disease and HCC, animal models are needed to characterize the molecular events leading from steatosis to cancer. We observed that male F1 offspring of A/J and B6 mice developed spontaneous insulin resistance, NAFLD, and HCC without obesity or T2D. Intriguingly, the model exhibited strong parent-of-origin effects. AB6F1 but not B6AF1 mice developed early-onset insulin resistance and NAFLD that progressed to HCC in many by 15 months of age. Despite this parent-of-origin-specific inheritance, we found no strong associations with known uniparentally expressed mitochondrial or imprinted genes, although modest associations with some X-linked genes were suggested. However, a follow-up DIO study involving X and Y CSS mice confirmed no significant phenotypic segregation by sex chromosome, although B6.AX mice exhibited a leaner metabolic profile than B6.AY mice on the LF diet. We concluded that the strong parent-of-origin effects in A×B F1 mice were specified within the autosomal genome. Importantly, the DIO experiment also revealed that obesity and insulin resistance were regulated by distinct genetic mechanisms in hybrid animals.
Diabetes is associated with an increased risk of HCC in humans.26 In diabetic patients, treatment with sulfonylurea or exogenous insulin increases HCC risk and worsens tumor response to radioablation, whereas HCC patients taking the insulin-sensitizing drug metformin have more favorable outcomes.27, 28, 29 This finding suggests a direct role for insulin in liver tumor promotion. Because insulin resistance in the absence of obesity or diabetes was sufficient to promote HCC in AB6F1 mice, we investigated potential mechanisms of metabolic hepatocarcinogenesis. In mice with hyperinsulinemic NAFLD, hepatocytes underwent partial adipogenic transition characterized morphologically by vacuolar metaplasia resembling WAT or BAT. At the molecular level, canonical adipocyte gene products were activated in steatotic hepatocytes, including vimentin, adipsin, fatty acid translocase (CD36), fatty acid–binding protein 4 (adipocyte), stearoyl-coA desaturase 2, and PPAR-γ. This transcriptional profile was largely recapitulated in insulin-supplemented but not insulin-deprived primary mouse hepatocytes in vitro. Supraphysiologic insulin exposure also promoted hepatocyte survival in culture. Of special significance, we found that excess insulin reactivated the fetal gene product PKM2 in hepatocytes both in vitro and in vivo.
Complex metabolic traits are regulated polygenetically.30 Thus, our inability to pinpoint a single gene that accounted for the parent-specific metabolic phenotype in A×B F1 mice was not surprising. Because neither parental inbred strain develops equivalent disease, polygenetic crosstalk rather than a single gene polymorphism best explains the positive and negative heterosis observed in B6AF1 and AB6F1 male mice, respectively.31 Although our genomic survey of F1 mice revealed a modest association between NAFLD and X-linked thyroxine-binding globulin, the follow-up DIO study with CSS mice did not validate phenotypic segregation by sex chromosome. In the original description of B6.A CSS mice, it was noted that 17 of the 23 CSS lines exhibited an intermediate obesity phenotype among parental inbred strains.21 Thus, metabolism is governed by multiple genes on an array of different chromosomes. Recent work has revealed important obesity-related quantitative trait loci on chromosomes 6 and 17.32, 33 Combining our results with those from other laboratories, it seems clear that polygenic epistatic interactions, including those inherited in a parent-specific manner, coordinately regulate insulin sensitivity. These findings take on direct translational significance in light of a recent study from Iceland showing that parent-specific autosomal polymorphisms strongly influence T2D risk in humans.34
In addition to its value as a genetic tool, the A×B mouse model has utility for addressing molecular mechanisms of hepatocarcinogenesis in the context of primary insulin resistance. For example, we observed that vacuolated hepatocytes in mice with hyperinsulinemic NAFLD not only took on a morphologic appearance of WAT or BAT but also expressed many genes classically associated with adipose tissue. These products included but were not limited to adipsin, fatty acid translocase, fatty acid–binding protein 4, vimentin, and PPAR-γ. The important role of insulin in adipogenic transition was confirmed by our in vitro experiments that recapitulated the emergence of lipid vacuoles along with up-regulation of adipogenic genes in primary mouse hepatocytes. Moreover, we confirmed that insulin extends hepatocyte survival and inhibits apoptosis. This may have in vivo significance because liver cells undergoing severe oxidative stress in a proinflammatory microenvironment would be prevented from entering apoptosis in the context of hyperinsulinemia, as shown experimentally in skeletal muscle.35
A singularly important potential link among hyperinsulinemia, adipogenic transition, and HCC revealed by this study was PKM2. Pyruvate kinases are critical enzymes in glycolytic oxidative phosphorylation. There are four pyruvate kinase isoforms: L, R, M1, and M2.36 The adult liver is characterized by expression of the L-type isoform.37 In contrast, M2 is expressed predominantly during embryogenesis in the fetal liver and other rapidly dividing tissues.38 In contrast to the adult isoforms, PKM2 diverts glucose metabolism to an alternate pathway that generates short carbon chains for molecular building blocks needed by rapidly dividing cells.39 Aberrant expression of PKM2 is a common feature of cancers that rely on aerobic glycolysis with lactate generation (Warburg effect) to support rapid proliferation. Intriguingly, PKM2 is activated normally in an insulin-dependent manner during the programmed differentiation of NIH 3T3 cells from preadipocytes to adipocytes.40 It is possible that insulin invokes adipogenic transition and Pkm2 expression in hepatocytes through similar mechanisms. Of note, the only two adult mammalian tissues that ordinarily express PKM2 are skeletal muscle and adipose tissue, both of which are replicatively senescent.41, 42 In contrast, hepatocytes readily enter cell division with sufficient prompting. It is tempting to speculate that insulin-directed PKM2 reactivation in replication-competent cells, such as hepatocytes, represents a significant proto-oncogenic event. If so, PKM2 inhibitors currently under development for the treatment of established cancer also may have utility for the prevention of HCC in patients with insulin resistance and NAFLD.43 Further study will be required to test this hypothesis.
In summary, we have introduced a novel mouse model of primary insulin resistance, NAFLD, and HCC with strong parent-of-origin effects. AB6F1 but not B6AF1 male mice develop spontaneous insulin resistance that leads to severe NAFLD by 9 months and HCC by 15 months. Parent-specific inheritance in this model is polygenetic and encoded within the autosomal genome. We have shown that insulin resistance is regulated independently of diet-induced weight gain in A×B F1 mice and that hyperinsulinemia is associated with adipogenic transition of hepatocytes. Among the adipocyte-associated gene products in this program is PKM2, an anabolic enzyme implicated in tumorigenesis and the Warburg effect. Viewed as a whole, our study implicates the existence of autosomal parent-specific loci that may serve as useful biomarkers for metabolic risk profiling and identifies new potential targets to improve insulin sensitivity and prevent NAFLD-associated HCC.
Acknowledgments
We thank the Division of Comparative Medicine, Massachusetts Institute of Technology, animal caretakers, diagnostic technicians, and histotechnologists for essential support, and the University of North Carolina Lineberger Animal Histopathology Core for immunohistochemistry. Matthew G. Vander Heiden (Massachusetts Institute of Technology) provided helpful discussions on PKM2.
Footnotes
Support by NIH grants AA016563 (I.N.H.), CA067529, P01CA0267, P30ES02109, and RR007036 (J.G.F.), and CA158661 and CA016086 (A.B.R.).
J.G.F. and A.B.R. share senior authorship.
References
- 1.James W.P. WHO recognition of the global obesity epidemic. Int J Obes. 2005;32(Suppl):S120–S126. doi: 10.1038/ijo.2008.247. [DOI] [PubMed] [Google Scholar]
- 2.Pender J.R., Pories W.J. Epidemiology of obesity in the United States. Gastroenterol Clin North Am. 2005;34:1–7. doi: 10.1016/j.gtc.2004.12.010. [DOI] [PubMed] [Google Scholar]
- 3.Hirsch H.A., Iliopoulos D., Joshi A., Zhang Y., Jaeger S.A., Bulyk M., Tsichlis P.N., Shirley Liu X., Struhl K. A transcriptional signature and common gene networks link cancer with lipid metabolism and diverse human diseases. Cancer Cell. 2010;17:348–361. doi: 10.1016/j.ccr.2010.01.022. [DOI] [PMC free article] [PubMed] [Google Scholar]
- 4.Ertle J., Dechene A., Sowa J.P., Penndorf V., Herzer K., Kaiser G., Schlaak J.F., Gerken G., Syn W.K., Canbay A. Nonalcoholic fatty liver disease progresses to HCC in the absence of apparent cirrhosis. Int J Cancer. 2010;128:2436–2443. doi: 10.1002/ijc.25797. [DOI] [PubMed] [Google Scholar]
- 5.El-Serag H.B. Epidemiology of hepatocellular carcinoma in USA. Hepatol Res. 2007;37(Suppl 2):S88–S94. doi: 10.1111/j.1872-034X.2007.00168.x. [DOI] [PubMed] [Google Scholar]
- 6.Williams C.D., Stengel J., Asike M.I., Torres D.M., Shaw J., Contreras M., Landt C.L., Harrison S.A. Prevalence of nonalcoholic fatty liver disease and nonalcoholic steatohepatitis among a largely middle-aged population utilizing ultrasound and liver biopsy: a prospective study. Gastroenterology. 2011;140:124–131. doi: 10.1053/j.gastro.2010.09.038. [DOI] [PubMed] [Google Scholar]
- 7.Christofk H.R., Vander Heiden M.G., Harris M.H., Ramanathan A., Gerszten R.E., Wei R., Fleming M.D., Schreiber S.L., Cantley L.C. The M2 splice isoform of pyruvate kinase is important for cancer metabolism and tumour growth. Nature. 2008;452:230–233. doi: 10.1038/nature06734. [DOI] [PubMed] [Google Scholar]
- 8.Fox J.G., Dewhirst F.E., Tully J.G., Paster B.J., Yan L., Taylor N.S., Collins M.J., Jr., Gorelick P.L., Ward J.M. Helicobacter hepaticus sp. nov., a microaerophilic bacterium isolated from livers and intestinal mucosal scrapings from mice. J Clin Microbiol. 1994;32:1238–1245. doi: 10.1128/jcm.32.5.1238-1245.1994. [DOI] [PMC free article] [PubMed] [Google Scholar]
- 9.Rogers A.B., Houghton J. Helicobacter-based mouse models of digestive system carcinogenesis. Methods Mol Biol. 2009;511:267–295. doi: 10.1007/978-1-59745-447-6_11. [DOI] [PubMed] [Google Scholar]
- 10.Fox J.G., Feng Y., Theve E.J., Raczynski A.R., Fiala J.L., Doernte A.L., Williams M., McFaline J.L., Essigmann J.M., Schauer D.B., Tannenbaum S.R., Dedon P.C., Weinman S.A., Lemon S.M., Fry R.C., Rogers A.B. Gut microbes define liver cancer risk in mice exposed to chemical and viral transgenic hepatocarcinogens. Gut. 2010;59:88–97. doi: 10.1136/gut.2009.183749. [DOI] [PMC free article] [PubMed] [Google Scholar]
- 11.Stern S.E., Williams K., Ferrannini E., DeFronzo R.A., Bogardus C., Stern M.P. Identification of individuals with insulin resistance using routine clinical measurements. Diabetes. 2005;54:333–339. doi: 10.2337/diabetes.54.2.333. [DOI] [PubMed] [Google Scholar]
- 12.Rogers A.B., Cormier K.S., Fox J.G. Thiol-reactive compounds prevent nonspecific antibody binding in immunohistochemistry. Lab Invest. 2006;86:526–533. doi: 10.1038/labinvest.3700407. [DOI] [PubMed] [Google Scholar]
- 13.Boutin S.R., Rogers A.B., Shen Z., Fry R.C., Love J.A., Nambiar P.R., Suerbaum S., Fox J.G. Hepatic temporal gene expression profiling in Helicobacter hepaticus-infected A/JCr mice. Toxicol Pathol. 2004;32:678–693. doi: 10.1080/01926230490524058. [DOI] [PubMed] [Google Scholar]
- 14.Rogers A.B., Theve E.J., Feng Y., Fry R.C., Taghizadeh K., Clapp K.M., Boussahmain C., Cormier K.S., Fox J.G. Hepatocellular carcinoma associated with liver-gender disruption in male mice. Cancer Res. 2007;67:11536–11546. doi: 10.1158/0008-5472.CAN-07-1479. [DOI] [PubMed] [Google Scholar]
- 15.Amador-Noguez D., Yagi K., Venable S., Darlington G. Gene expression profile of long-lived Ames dwarf mice and Little mice. Aging Cell. 2004;3:423–441. doi: 10.1111/j.1474-9728.2004.00125.x. [DOI] [PubMed] [Google Scholar]
- 16.Kremer M., Perry A.W., Milton R.J., Rippe R.A., Wheeler M.D., Hines I.N. Pivotal role of Smad3 in a mouse model of T cell-mediated hepatitis. Hepatology. 2008;47:113–126. doi: 10.1002/hep.21956. [DOI] [PubMed] [Google Scholar]
- 17.Lemke L.B., Rogers A.B., Nambiar P.R., Fox J.G. Obesity and non-insulin-dependent diabetes mellitus in Swiss-Webster mice associated with late-onset hepatocellular carcinoma. J Endocrinol. 2008;199:21–32. doi: 10.1677/JOE-07-0588. [DOI] [PubMed] [Google Scholar]
- 18.Bao B., Wang Z., Li Y., Kong D., Ali S., Banerjee S., Ahmad A., Sarkar F.H. The complexities of obesity and diabetes with the development and progression of pancreatic cancer. Biochim Biophys Acta. 2011;1815:135–146. doi: 10.1016/j.bbcan.2010.11.003. [DOI] [PMC free article] [PubMed] [Google Scholar]
- 19.Giouleme O., Diamantidis M.D., Katsaros M.G. Is diabetes a causal agent for colorectal cancer?: pathophysiological and molecular mechanisms. World J Gastroenterol. 2011;17:444–448. doi: 10.3748/wjg.v17.i4.444. [DOI] [PMC free article] [PubMed] [Google Scholar]
- 20.Rogers A.B., Fox J.G. Inflammation and cancer, I: rodent models of infectious gastrointestinal and liver cancer. Am J Physiol. 2004;286:G361–G366. doi: 10.1152/ajpgi.00499.2003. [DOI] [PubMed] [Google Scholar]
- 21.Curley J.P., Mashoodh R. Parent-of-origin and trans-generational germline influences on behavioral development: the interacting roles of mothers, fathers, and grandparents. Dev Psychobiol. 2010;52:312–330. doi: 10.1002/dev.20430. [DOI] [PubMed] [Google Scholar]
- 22.Singer J.B., Hill A.E., Burrage L.C., Olszens K.R., Song J., Justice M., O'Brien W.E., Conti D.V., Witte J.S., Lander E.S., Nadeau J.H. Genetic dissection of complex traits with chromosome substitution strains of mice. Science. 2004;304:445–448. doi: 10.1126/science.1093139. [DOI] [PubMed] [Google Scholar]
- 23.Radonjic M., de Haan J.R., van Erk M.J., van Dijk K.W., van den Berg S.A., de Groot P.J., Muller M., van Ommen B. Genome-wide mRNA expression analysis of hepatic adaptation to high-fat diets reveals switch from an inflammatory to steatotic transcriptional program. PloS One. 2009;4:e6646. doi: 10.1371/journal.pone.0006646. [DOI] [PMC free article] [PubMed] [Google Scholar]
- 24.Goncalves L.A., Vigario A.M., Penha-Goncalves C. Improved isolation of murine hepatocytes for in vitro malaria liver stage studies. Malar J. 2007;6:169. doi: 10.1186/1475-2875-6-169. [DOI] [PMC free article] [PubMed] [Google Scholar]
- 25.Das K., Das K., Mukherjee P.S., Ghosh A., Ghosh S., Mridha A.R., Dhibar T., Bhattacharya B., Bhattacharya D., Manna B., Dhali G.K., Santra A., Chowdhury A. Nonobese population in a developing country has a high prevalence of nonalcoholic fatty liver and significant liver disease. Hepatology. 2010;51:1593–1602. doi: 10.1002/hep.23567. [DOI] [PubMed] [Google Scholar]
- 26.Regimbeau J.M., Colombat M., Mognol P., Durand F., Abdalla E., Degott C., Degos F., Farges O., Belghiti J. Obesity and diabetes as a risk factor for hepatocellular carcinoma. Liver Transpl. 2004;10:S69–S73. doi: 10.1002/lt.20033. [DOI] [PubMed] [Google Scholar]
- 27.Donadon V., Balbi M., Ghersetti M., Grazioli S., Perciaccante A., Della Valentina G., Gardenal R., Dal Mas M., Casarin P., Zanette G., Miranda C. Antidiabetic therapy and increased risk of hepatocellular carcinoma in chronic liver disease. World J Gastroenterol. 2009;15:2506–2511. doi: 10.3748/wjg.15.2506. [DOI] [PMC free article] [PubMed] [Google Scholar]
- 28.Chen T.M., Lin C.C., Huang P.T., Wen C.F. Metformin associated with lower mortality in diabetic patients with early stage hepatocellular carcinoma after radiofrequency ablation. J Gastroenterol Hepatol. 2011;26:858–865. doi: 10.1111/j.1440-1746.2011.06664.x. [DOI] [PubMed] [Google Scholar]
- 29.Kawaguchi T., Taniguchi E., Morita Y., Shirachi M., Tateishi I., Nagata E., Sata M. Association of exogenous insulin or sulphonylurea treatment with an increased incidence of hepatoma in patients with hepatitis C virus infection. Liver Int. 2010;30:479–486. doi: 10.1111/j.1478-3231.2009.02191.x. [DOI] [PubMed] [Google Scholar]
- 30.Leiter E.H. Selecting the “right” mouse model for metabolic syndrome and type 2 diabetes research. Methods Mol Biol. 2009;560:1–17. doi: 10.1007/978-1-59745-448-3_1. [DOI] [PubMed] [Google Scholar]
- 31.Leiter E.H., Reifsnyder P.C., Zhang W., Pan H.J., Xiao Q., Mistry J. Differential endocrine responses to rosiglitazone therapy in new mouse models of type 2 diabetes. Endocrinology. 2006;147:919–926. doi: 10.1210/en.2005-0839. [DOI] [PubMed] [Google Scholar]
- 32.Buchner D.A., Burrage L.C., Hill A.E., Yazbek S.N., O'Brien W.E., Croniger C.M., Nadeau J.H. Resistance to diet-induced obesity in mice with a single substituted chromosome. Physiol Genomics. 2008;35:116–122. doi: 10.1152/physiolgenomics.00033.2008. [DOI] [PMC free article] [PubMed] [Google Scholar]
- 33.Millward C.A., Burrage L.C., Shao H., Sinasac D.S., Kawasoe J.H., Hill-Baskin A.E., Ernest S.R., Gornicka A., Hsieh C.W., Pisano S., Nadeau J.H., Croniger C.M. Genetic factors for resistance to diet-induced obesity and associated metabolic traits on mouse chromosome 17. Mamm Genome. 2009;20:71–82. doi: 10.1007/s00335-008-9165-2. [DOI] [PMC free article] [PubMed] [Google Scholar]
- 34.Kong A., Steinthorsdottir V., Masson G., Thorleifsson G., Sulem P., Besenbacher S., Jonasdottir A., Sigurdsson A., Kristinsson K.T., Jonasdottir A., Frigge M.L., Gylfason A., Olason P.I., Gudjonsson S.A., Sverrisson S., Stacey S.N., Sigurgeirsson B., Benediktsdottir K.R., Sigurdsson H., Jonsson T., Benediktsson R., Olafsson J.H., Johannsson O.T., Hreidarsson A.B., Sigurdsson G., Ferguson-Smith A.C., Gudbjartsson D.F., Thorsteinsdottir U., Stefansson K. Parental origin of sequence variants associated with complex diseases. Nature. 2009;462:868–874. doi: 10.1038/nature08625. [DOI] [PMC free article] [PubMed] [Google Scholar]
- 35.Sell H., Eckardt K., Taube A., Tews D., Gurgui M., Van Echten-Deckert G., Eckel J. Skeletal muscle insulin resistance induced by adipocyte-conditioned medium: underlying mechanisms and reversibility. Am J Physiol Endocrinol Metab. 2008;294:E1070–E1077. doi: 10.1152/ajpendo.00529.2007. [DOI] [PubMed] [Google Scholar]
- 36.Yamada K., Noguchi T. Nutrient and hormonal regulation of pyruvate kinase gene expression. Biochem J. 1999;337(pt 1):1–11. [PMC free article] [PubMed] [Google Scholar]
- 37.Eckert D.T., Zhang P., Collier J.J., O'Doherty R.M., Scott D.K. Detailed molecular analysis of the induction of the L-PK gene by glucose. Biochem Biophys Res Commun. 2008;372:131–136. doi: 10.1016/j.bbrc.2008.05.002. [DOI] [PMC free article] [PubMed] [Google Scholar]
- 38.Tee L.B., Kirilak Y., Huang W.H., Smith P.G., Morgan R.H., Yeoh G.C. Dual phenotypic expression of hepatocytes and bile ductular markers in developing and preneoplastic rat liver. Carcinogenesis. 1996;17:251–259. doi: 10.1093/carcin/17.2.251. [DOI] [PubMed] [Google Scholar]
- 39.Vander Heiden M.G., Locasale J.W., Swanson K.D., Sharfi H., Heffron G.J., Amador-Noguez D., Christofk H.R., Wagner G., Rabinowitz J.D., Asara J.M., Cantley L.C. Evidence for an alternative glycolytic pathway in rapidly proliferating cells. Science. 2010;329:1492–1499. doi: 10.1126/science.1188015. [DOI] [PMC free article] [PubMed] [Google Scholar]
- 40.Asai Y., Yamada K., Watanabe T., Keng V.W., Noguchi T. Insulin stimulates expression of the pyruvate kinase M gene in 3T3-L1 adipocytes. Biosci Biotech Biochem. 2003;67:1272–1277. doi: 10.1271/bbb.67.1272. [DOI] [PubMed] [Google Scholar]
- 41.Li Y., Chang Y., Zhang L., Feng Q., Liu Z., Zhang Y., Zuo J., Meng Y., Fang F. High glucose upregulates pantothenate kinase 4 (PanK4) and thus affects M2-type pyruvate kinase (Pkm2) Mol Cell Biochem. 2005;277:117–125. doi: 10.1007/s11010-005-5535-1. [DOI] [PubMed] [Google Scholar]
- 42.Traxinger R.R., Marshall S. Insulin regulation of pyruvate kinase activity in isolated adipocytes: crucial role of glucose and the hexosamine biosynthesis pathway in the expression of insulin action. J Biol Chem. 1992;267:9718–9723. [PubMed] [Google Scholar]
- 43.Vander Heiden M.G., Christofk H.R., Schuman E., Subtelny A.O., Sharfi H., Harlow E.E., Xian J., Cantley L.C. Identification of small molecule inhibitors of pyruvate kinase M2. Biochem Pharmacol. 2010;79:1118–1124. doi: 10.1016/j.bcp.2009.12.003. [DOI] [PMC free article] [PubMed] [Google Scholar]