

Abstract
Dysregulated overexpression of hepatocyte growth factor and its receptor, c-Met, has been reported in various cancers, but its role in colorectal carcinoma (CRC) has not been elucidated. Therefore, we investigated the role of phosphorylated Met (p-Met) in Middle Eastern CRC patient samples and cell lines. The p-Met was overexpressed in 80.8% of CRCs and strongly associated with the expression of p-AKT, DR5, and Ki-67 by immunohistochemistry. Coexpression of p-Met and DR5 was seen in 53.1% of CRC cases and was associated with a less aggressive phenotype, characterized by a histological subtype of adenocarcinomas, well-differentiated tumors, and was an independent prognostic marker for better overall survival. PHA665752, a selective p-Met inhibitor, induced apoptosis in CRC cells via inactivation of c-Met and AKT. PHA665752 treatment also caused increased expression of DR5 via generation of reactive oxygen species, and combination treatment with tumor necrosis factor–related apoptosis-inducing ligand (TRAIL) and PHA665752 induced significant apoptosis. In vivo, cotreatment of a CRC xenograft with PHA665752 and TRAIL significantly reduced tumor volume and weight. These data demonstrate a significant correlation between p-Met and DR5 in patients with CRC. Furthermore, inhibition of p-Met signaling by PHA665752 in combination with TRAIL significantly inhibited cell growth and induced apoptosis in CRC cell lines, suggesting that this may have significant clinical implications as a therapeutic target in the treatment of CRC.
Colorectal cancer (CRC) is still a leading cause of cancer-related death worldwide, despite recent advances in adjuvant chemotherapeutic regimens using fluorouracil and oxiliplatin.1 Recent advances in understanding tumor biological characteristics have led to the development of newer targeted treatment,2 allowing progress in the management of CRC.3 Targeted therapy against receptor tyrosine kinases increases survival in patients with CRC.4, 5
Recently, dysregulated hepatocyte growth factor (HGF) and its tyrosine kinase receptor, c-Met, have been reported in many cancers, including CRC.6, 7, 8, 9, 10, 11 However, the role of HGF/c-Met signaling has not been fully elucidated in CRC. In various cancers, c-Met activation results in activation of various signal transduction pathways, including phosphatidylinositol 3-kinase (PI3K) and extracellular signal–regulated kinase.12, 13, 14 Activation of PI3K, one of the key survival pathways, leads to activation of several signaling proteins, including AKT. Once AKT is activated, it causes activation of other anti-apoptotic proteins, such as Bad, forkhead box protein O1 (FOXO1), and glycogen synthase kinase 3 (GSK3), thereby allowing malignant cells to survive.15, 16 These findings implicate that c-Met/HGF–dysregulated pathways play a critical in growth and survival of cancer cells.
Recently, the development of more selective, tumor biology–driven agents and targets for tumor-derived molecules has become of great interest in cancer research.17, 18 Furthermore, combinations of conventional chemotherapies with biological agents are thought to be more effective.19, 20, 21 Tumor necrosis factor–related apoptosis-inducing ligand (TRAIL), a member of the superfamily of tumor necrosis factors,22, 23 may act as an inducer of apoptosis in cancer cells. Of the five TRAIL receptors, only two, DR4 (TRAIL-R1) and DR5 (TRAIL-R2), have demonstrated their potential of inducing apoptosis; these two receptors possess cytoplasm death domains.24, 25 Unfortunately, many primary tumors are inherently resistant to TRAIL-mediated apoptosis.26, 27
In the present study, we investigated in detail the prevalence of phosphorylated Met (p-Met) overexpression in a large cohort of Saudi CRC patient samples and its clinicopathological association and prognostic significance by TMA. We followed this with in vitro and in vivo studies investigating the effects of pharmacological inhibitors of p-Met on cell survival, death, and downstream signaling pathways in CRC. Finally, combination treatment of a p-Met inhibitor and TRAIL was assessed in vitro and in vivo.
Materials and Methods
Patient Selection and TMA Construction
Patients (N=448) with CRC diagnosed between 1990 and 2006 were selected from King Faisal Specialist Hospital and Research Centre. All CRCs, 24 adenomas, and 229 adjacent healthy colorectal mucosa samples were analyzed in a TMA format, as previously described.28 The Institutional Review Board of King Faisal Specialist Hospital and Research Centre approved the study. A measure of survival used was all-cause mortality and termed as overall survival; our survival data do not reflect disease-specific mortality. Of the 339 cases with available data for p-Met and DR5 by immunohistochemistry (IHC), adjuvant therapy was given in 163 (48%) CRC cases; no adjuvant therapy was given in 75 (22%) of the cases, and data were not available for 101 (30%) of the cases.
IHC Data
TMA slides were processed and stained manually. Primary antibodies used, their dilutions, and incidences are listed in Table 1. Only fresh-cut slides were stained simultaneously to minimize the influence of slide ageing and maximize the repeatability and reproducibility of the experiment.
Table 1.
Antibodies Used for TMA IHC Analysis
| Antibody | Clone | Company | Source | Dilution⁎ | Antigen retrieval | Detection system |
|---|---|---|---|---|---|---|
| p-Met | Polyclonal | Invitrogen (Carlsbad, CA) | Rabbit | 1:300 | pH 6, PC | EnVision+ |
| DR5 | Polyclonal | R&D Systems (Minneapolis, MN) | Goat | 1:1000 | pH 6 | EnVision+ |
| p-AKT | Ser473 | Cell Signaling Technologies (Beverly, MA) | Mouse monoclonal | Predilute | pH 9, MW | Signal stain IHC detection kit |
| Ki-67 | MIB-1 | Dako (Carpinteria, CA) | Mouse monoclonal | 1:100 | pH 9, MW | EnVision+ |
| KRAS4A | Polyclonal | SCBT (c-17) (Santa Cruz, CA) | Rabbit | 1:500 | pH 9, MW | EnVision+ |
| p27kip1 | 57 | Zymed (San Francisco, CA) | Mouse | 1:400 | pH 9, PC | EnVision+ |
MW, microwave; PC, pressure cooker.
Overnight incubation.
IHC Assessment
p-Met and DR5 expression were categorized by obtaining an H score, as previously described.29, 30 CRCs were grouped into two groups based on X-tile plots for p-Met, DR5, cleaved caspase-3, and KRAS4A.31, 32, 33
Statistical Analysis
The JMP 9.0 (SAS Institute, Inc., Cary, NC) software package was used for data analyses. Survival curves were generated using the Kaplan-Meier method, with significance evaluated using the Mantel-Cox log-rank test. Risk ratio (relative risk for death) was calculated using the Cox proportional hazard model in both univariate and multivariate analyses. In the cell line, data are presented as mean ± SD. Comparisons between groups were made with the paired Student's t-test.
Cell Culture
Colo-320, HCT-15, LOVO, and SW-480 cells were obtained from Deutsche Sammlung von Mikroorganismen und Zellkulturen (DSMZ, Braunschweig, Germany). All of the cell lines were authenticated by performing short tandem repeat profiling and validated with published short tandem repeats. The CRC cell lines were cultured in RPMI 1640 medium supplemented with 10% (v/v) fetal bovine serum, 100 U/mL penicillin, and 100 U/mL streptomycin at 37°C in a humidified atmosphere containing 5% CO2. All cell lines were tested for immunological markers and cytogenetics. Colo-320 and LOVO cells express appreciable levels of DR5, whereas HCT-15 and SW-480 cell lines express low levels of DR5.
Reagents and Antibodies
PHA665752 inhibitor were obtained from Tocris Bioscience (Ellisville, MO). TRAIL was obtained from Alexis Corp (Farmingdale, NY). Antibodies against p-AKT, caspase-9, p-FOXO-1, p-GSK3, DR5, p-Bad, and Bid were obtained from Cell Signaling Technologies (Beverly, MA). p-Met antibody was obtained from Biosource (Camarillo, CA). Cytochrome c, β-actin, caspase-3, and poly (ADP-ribose) polymerase (PARP) antibodies were obtained from Santa Cruz Biotechnology, Inc. (Santa Cruz, CA). X-linked inhibitor of apoptosis protein (XIAP), cellular inhibitor of apoptosis protein-1 (cIAP1), DR5, Survivin, and caspase-8 antibodies were obtained from R&D Systems (Minneapolis, MN). Annexin V was obtained from Molecular Probes (Eugene, OR). An apoptotic DNA ladder kit was obtained from Roche (Penzberg, Germany).
Cell Cycle Analysis, Annexin V Staining, and DNA Ladderin
CRC cell lines were treated with different concentrations of PHA665752 either alone or in combination with TRAIL, as described in the legends. For cell cycle analysis, cells were washed once with PBS, resuspended in 500 μL of hypotonic staining buffer, and analyzed by flow cytometry, as previously described.28, 34, 35 For the detection of apoptosis, cells were harvested and the percentage apoptosis was measured by flow cytometry after staining with fluorescein-conjugated annexin V and propidium iodide (PI; Molecular Probes) and DNA laddering using a 1.5% agarose gel, as previously described.36
Cell Lysis and Immunoblotting
Cells were treated as described in the legends and lysed as previously described.36 Proteins, 15 to 20 μg, were separated by SDS-PAGE and transferred to a polyvinylidene difluoride membrane (Immobilon; Millipore, Billerica, MA). Proteins were immunoblotted with different antibodies and visualized by enhanced chemiluminescence (Amersham, Piscataway, NJ).
Measurement of Mitochondrial Potential Using JC1 (5,5′,6,6′-Tetrachloro-1,1′,3,3′- Tetraethylbenzimidazolylcarbocyanine Iodide)
Cells, 1 × 10⁶, were treated with PHA665752 for 24 hours. Cells were washed with PBS and suspended in mitochondrial incubation buffer (Alexis Corp, Farmingdale, NY); JC1 was added to a final concentration of 10 μmol/L, and cells were analyzed by flow cytometry, as previously described.37
Measurement of ROS
Exponentially growing cells were treated with 5 μmol/L PHA665752 for various time periods. After treatment, cells were loaded with 10 μmol/L 2′,7′-dichlorodihydrofluorescein diacetate (H2DCFDA), a cell-permeable fluorescence probe, and incubated at 37°C for 45 minutes. After incubation, cells were washed with one times PBS, and green fluorescence intensity in the cells was examined by fluorescence-activated cell sorting analysis.
Assay for Cytochrome c Release
Release of cytochrome c from mitochondria was assayed as previously described.38 Proteins, 15 to 20 μg, from the cytosolic and mitochondrial fractions of each sample were analyzed by immunoblotting using an anti-cytochrome c antibody.
Gene Silencing Using siRNA
c-Met small-interfering RNA (siRNA) was obtained from Santa Cruz Biotechnology, Inc. AKT siRNA and Scrambled control siRNA were obtained from Qiagen (Valencia, CA). Cells were transfected using Lipofectamine 2000 (Invitrogen, Carlsbad, CA), as previously described,38 and specific protein levels were determined by using Western blot analysis with specific antibodies.
Animal and Xenograft Studies
Nude mice, aged 6 weeks, were maintained in a pathogen-free animal facility at least 1 week before use. Mice were inoculated s.c. into the right abdominal quadrant with 5 × 10⁶ HCT-15 cells in 200 μL of PBS. After 1 week, mice were randomly assigned into four groups: three groups received 0.5 mg/kg TRAIL, 25 mg/kg PHA665752, and a combination of 0.5 mg/kg TRAIL and 25 mg/kg PHA665752, respectively; and the remaining one group received 0.9% saline. The body weight and tumor volume of each mouse were monitored weekly. The tumor volume was measured as previously described.39 After 5 weeks of treatment, mice were sacrificed and individual tumors were weighted and then snap frozen in liquid nitrogen for storage.
Results
Correlation of p-Met Expression with p-AKT and Other Clinicopathological Parameters
p-Met overexpression was detected in 80.8% of CRCs (Figure 1). The association with other IHC markers is presented in Supplemental Table S1 (available at http://ajp.amjpathol.org). p-Met overexpression was significantly associated with p-AKT overexpression (P = 0.0219), Bcl-Xl (P = 0.0637; a trend was noted), and Ki-67 (P = 0.0382) (Figure 1). p-Met expression progressively increased from healthy colon to adenomas to colorectal carcinomas. The expression of p-Met in colorectal adenomas (113.48 ± 64.32) and colorectal carcinomas (105.23 ± 59.62) was more than in healthy colons (77.59 ± 40.32; P = 0.0150 and P < 0.0001, respectively) (see Supplemental Figure S1 at http://ajp.amjpathol.org).
Figure 1.
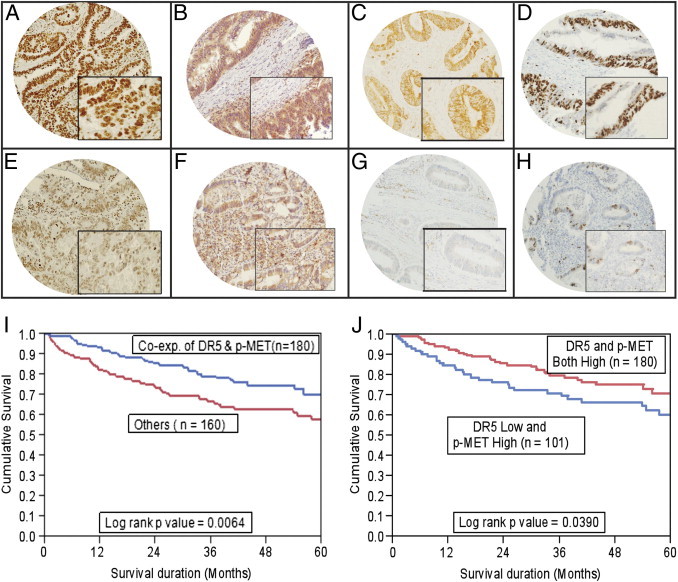
TMA-based IHC analysis of p-MET, p-AKT, DR5, and Ki-67 expression in patients with CRC. Overexpression of p-Met (A), p-AKT (B), DR5 (C), and Ki-67 (D) was observed in the CRC TMA specimen. Decreased staining for p-Met was seen (E), along with low expression levels of p-AKT (F), DR5 (G), and Ki-67 (H) in another CRC TMA specimen. Original magnification: ×20 (A–H); ×100 (inset, A–H). I: Impact of p-Met expression on prognosis in patients with CRC. Patients with coexpression (Co-exp.) of p-Met and DR5 had a good overall survival of 70.4% at 5 years (n = 180, P = 0.0064) compared with 58.2% in other CRC subgroups (n = 160). J: Patients with coexpression of p-Met and DR5 had a good overall survival of 70.4% at 5 years (n = 180, P = 0.0390) compared with 60.1% in the CRC group with high p-MET and low DR5 expression (n = 101).
CRC Subgroup with Coexpression of p-Met and DR5 Is Associated with Proapoptotic Molecules
Although we did not observe any prognostic difference in outcome based on p-Met expression, DR5 expression was associated with better overall survival (P = 0.0211). Interestingly, p-Met expression was also significantly associated with expression of DR5 (P = 0.0344). Coexpression of p-Met and DR5 was seen in 53.1% (180/339) CRC cases and was associated with a less aggressive phenotype, characterized by a histological subtype of adenocarcinoma (P = 0.0083), tumors in the descending colon (P = 0.0014), and well-differentiated tumors (P = 0.0003) (Table 2). p-Met and DR5 coexpression was tightly linked with expression of p27kip1 (P < 0.0001) and cleaved caspase-3 (P = 0.0290). We observed a highly significant association of p-Met and DR5 coexpression with the proapoptotic KRAS4A isoforms (P < 0.00001).
Table 2.
Clinicopathological Characteristics and Coexpression of DR5 and p-MET in Patients with CRC
| Characteristics | Total | Coexpression of p-MET and DR5 | Others | P value |
|---|---|---|---|---|
| Total [no. (%)] | 339 | 180 (53.1) | 159 (46.9) | ND |
| Age (years) | ||||
| ≤50 | 119 (35.1) | 62 (52.1) | 57 (47.9) | 0.7869 |
| >50 | 220 (64.9) | 118 (53.6) | 102 (46.3) | |
| Sex | ||||
| Male | 163 (48.1) | 90 (55.2) | 73 (44.8) | 0.4521 |
| Female | 176 (51.9) | 90 (51.1) | 86 (48.9) | |
| Tumor site | ||||
| Descending colon | 285 (84.1) | 162 (56.8) | 123 (43.2) | 0.0014 |
| Ascending colon | 54 (15.9) | 18 (33.3) | 36 (66.7) | |
| Histological type | ||||
| Adenocarcinoma | 300 (88.5) | 167 (55.7) | 133 (44.3) | 0.0083 |
| Mucinous carcinoma | 39 (11.5) | 13 (33.3) | 26 (66.7) | |
| Tumor stage⁎ | ||||
| I | 45 (13.9) | 29 (64.4) | 16 (35.6) | 0.2133 |
| II | 110 (33.9) | 54 (49.1) | 56 (50.9) | |
| III | 130 (40.1) | 74 (56.9) | 56 (43.1) | |
| IV | 39 (12.0) | 18 (46.1) | 21 (53.9) | |
| Differentiation | ||||
| Well | 26 (7.7) | 18 (69.2) | 8 (30.8) | 0.0003 |
| Moderate | 259 (76.4) | 146 (56.4) | 113 (43.6) | |
| Poor | 54 (15.9) | 16 (29.6) | 38 (70.4) | |
| p27⁎ | ||||
| High | 128 (40.2) | 89 (69.5) | 39 (30.5) | <0.0001 |
| Low | 190 (59.8) | 87 (45.8) | 103 (54.2) | |
| KRAS4A⁎ | ||||
| High | 153 (47.7) | 110 (71.9) | 43 (28.1) | <0.0001 |
| Low | 168 (52.3) | 66 (39.3) | 102 (60.7) | |
| Cleaved caspase 3⁎ | ||||
| High | 159 (50.6) | 97 (61.0) | 63 (39.0) | 0.0245 |
| Low | 155 (49.4) | 75 (48.4) | 80 (51.6) | |
| Overall survival at 5 years | ND | 70.4 | 58.2 | 0.0064 |
Data are given as number (percentage) unless otherwise indicated.
ND, no data.
Analysis failure of some markers for these IHC markers was attributed to missing or nonrepresentative spots.
Overall Survival in CRC Subgroups Stratified according to Expression of p-Met and DR5
Coexpression of p-Met and DR5 showed a better 5-year overall survival of 70.4% compared with 58.2% in the other group (P = 0.0064, Figure 1I). The mean overall survival for CRC subgroup with coexpression of p-MET and DR5 was 116.4 months (95% CI, 105.4–127.3 months) compared with a mean overall survival of 98.4 months (95% CI, 84.4–112.4 months) for other groups. We also performed a multivariate (Cox proportional hazards) analysis with p-Met and DR5 coexpression, histological subtype, tumor grade, tumor stage, age, and sex as variables (Table 3). We found that the prognostic value of p-Met and DR5 coexpression in all cases was independent of these factors. Thus, p-Met and DR5 coexpression was an independent prognostic marker for better survival.
Table 3.
Coexpression of DR5 and p-Met: Cox Regression Analysis for Overall Survival of Patients with CRC
| Clinical parameters | Univariate analysis |
Multivariate analysis |
||
|---|---|---|---|---|
| Risk ratio (95% CI) | P value | Risk ratio (95% CI) | P value | |
| Age ≥50 | 1.17 (0.80–1.74) | 0.4306 | 1.30 (0.77–2.26) | 0.3326 |
| Male sex | 1.10 (0.76–1.59) | 0.6084 | 1.32 (0.81–2.14) | 0.26 |
| Stage III–IV | 7.26 (4.34–13.03) | <0.0001 | 5.52 (3.10–10.82) | <0.0001 |
| Poor grade | 1.41 (0.90–2.14) | 0.1307 | 1.40 (0.73–2.54) | 0.3068 |
| Microsatellite instability | 2.04 (1.14–4.05) | 0.0149 | 2.14 (1.01–5.26) | 0.0457 |
| Coexpression of p-Met and DR5 | 1.79 (1.18–2.77) | 0.0064 | 1.84 (1.13–3.00) | 0.0143 |
Because our CRC cell lines showed a phenotype of high p-Met and low DR5 expression, we further compared the overall survival in the CRC subgroup showing high p-Met and low DR5 expression with the CRC subgroup with coexpression of high p-Met and DR5. The CRC subgroup with coexpression of high p-Met and DR5 showed a better 5-year overall survival of 70.4% compared with 60.1% in the other group (P = 0.0390, Figure 1J). Finally, we also performed survival analysis for the following three CRC subgroups: low coexpression of p-MET and DR5, high coexpression of p-MET and DR5, and high p-MET but low DR5 expression. The CRC subgroup with high coexpression of p-MET and DR5 showed the best outcome, with an overall survival of 70.4%, compared with 60.1% in the CRC subgroup with high p-MET and low DR5 expression and 65.3% in the CRC subgroup with low coexpression of p-MET and DR5. There was no difference in outcome in the CRC subgroup with low coexpression of p-MET and DR5 compared with the subgroup with high expression of p-MET and low expression of DR5 (P = 0.8911, data not shown).
p-Met Inactivation Inhibited Cell Viability and Induced Apoptosis in CRC Cell Lines
We first sought to determine whether p-Met inhibition by PHA665752, a specific inhibitor of c-Met, causes inhibition of cell viability in CRC cell lines in vitro. CRC cell lines were incubated with 0.5, 1, 5, and 10 μmol/L PHA665752, and cell viability was determined by MTT assay. As shown in Figure 2A, treatment of CRC cells with PHA665752 caused inhibition of viability in all CRC cell lines in a dose-dependent manner. Previously, p-Met activation secondary to HGF stimulation required low doses of PHA66575240; however, when p-Met is constitutively activated, higher doses of PHA665752 are required.41, 42 We have also previously shown that treatment with PHA665752 at doses of 1 and 5 μmol/L does not affect the phosphorylation status of other proteins, such as p-Lyn, p-Stat3, p-Jak2, and p-SRC, in epithelial ovarian cancer.41 Therefore, we selected working doses of 1 and 5 μmol/L of PHA665752 for our in vitro experiments. Next, we treated CRC cell lines with 1 and 5 μmol/L of PHA665752, and cell cycle fractions were analyzed by flow cytometry. As shown in Figure 2B, there was an increase in the sub-G1 population of cells from 3.54% in controls to 57.39% and 85.88% at 1 and 5 μmol/L of PHA665752, respectively, in the colo-320 cell line. Similar results were obtained in the other cell lines (HCT-15, LOVO, and SW-480). This increase in the sub-G1 population of cells has occurred as the result of apoptosis.36, 37, 38 In addition, CRC cells were treated with PHA665752, and apoptotic cells were assayed by annexin V/PI dual staining. As shown in Figure 2C, CRC cells treated with 1 and 5 μmol/L of PHA665752 showed apoptosis in a dose-dependent manner. Finally, colo-320 and HCT-15 cell lines were treated with PHA665752, and DNA fragmentation was observed in both of the cell lines (Figure 2D). These data clearly suggest that PHA665752 treatment of CRC cells led to apoptosis in CRC cell lines.
Figure 2.
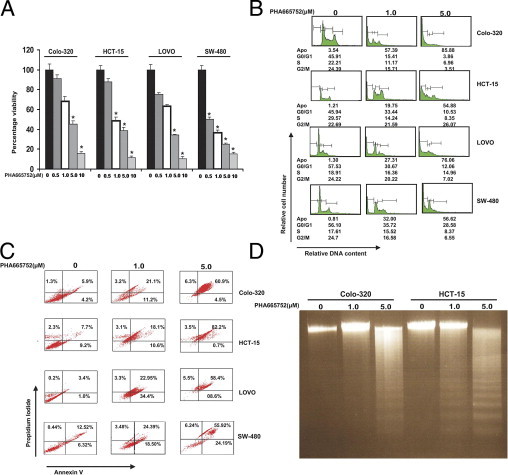
PHA665752 treatment causes dose-dependent inhibition of cell viability of CRC cells. A: Colo-320, HCT-15, LOVO, and SW-480 cells were treated with 0.5, 1.0, 5.0, and 10 μmol/L PHA665752 for 48 hours. Cell viability assays were performed using MTT, as described in Materials and Methods. The graph displays the mean ± SD of three independent experiments with replicates of six wells for all of the doses and vehicle control for each experiment. *P < 0.001 (Student's t-test). B: PHA665752 treatment increases sub-G1 (Apo) population CRC cell lines. Colo-320, HCT-15, LOVO, and SW-480 cells were treated with 1 and 5 μmol/L PHA665752 for 24 hours. Thereafter, the cells were washed and stained with PI and analyzed for DNA content by flow cytometry, as described in Materials and Methods. A representative of four independent experiments in shown. C: PHA665752-induced apoptosis in CRC cell lines. Colo-320, HCT-15, LOVO, and SW-480 cell lines were treated with 1 and 5 μmol/L PHA665752 for 24 hours; cells were subsequently stained with fluorescein-conjugated annexin V antibody and PI; and the ratio of apoptotic cells was analyzed by flow cytometry. A representative of three independent experiments is depicted. D: Colo-320 and HCT-15 cells were treated with 1 and 5 μmol/L PHA665752, respectively, for 24 hours, and DNA was extracted and separated by electrophoresis on 1.5% agarose gel.
Inhibition of p-Met Activity Leads to Inactivation of PI3K-AKT Signaling in CRC Cell Lines
Met activation via phosphorylation has controlled various signaling pathways.43, 44 Therefore, we first examined the phosphorylation status of the four cell lines that were being used in the study. As shown in Supplemental Figure S2 (available at http://ajp.amjpathol.org), all of the four cell lines expressed comparable levels of p-Met, as detected by immunoblotting. We next sought to determine whether PHA665752 inhibits constitutive phosphorylation of c-Met and AKT in CRC cell lines. As shown in Figure 3A, c-Met and AKT were constitutively activated in CRC cell lines and treatment of these cell lines with PHA665752 dephosphorylated both molecules and their downstream targets in CRC cell lines. These data suggest that PHA665752 treatment has the ability to dephosphorylate Met and AKT, leading to inactivation of downstream signaling molecules of AKT, mainly FOXO1, GSK3, and p-Bad, in CRC cell lines.
Figure 3.
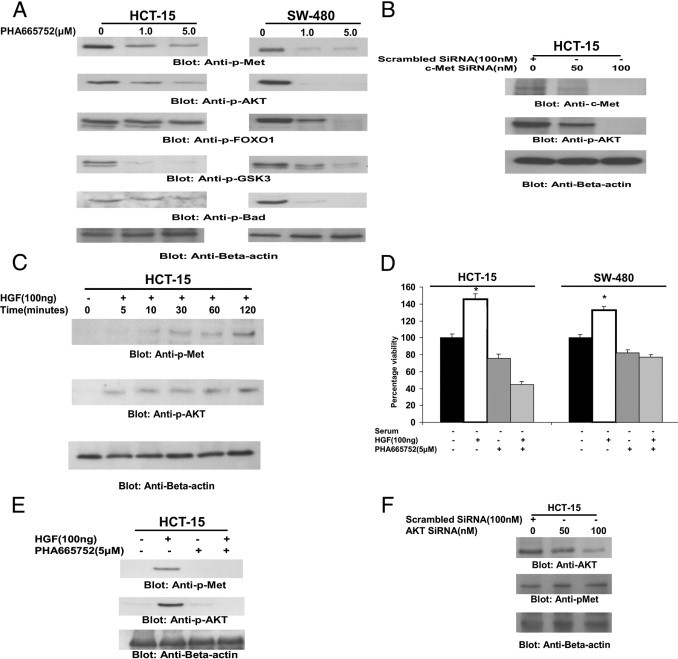
PHA665752 treatment causes dephosphorylation of constitutive p-Met and AKT and its substrates in CRC cell lines. A: HCT-15 and SW-480 cells were treated with 1 and 5 μmol/L PHA665752, respectively, for 24 hours. After cell lysis, equal amounts of proteins were separated by SDS-PAGE, transferred to a polyvinylidene difluoride (PVDF) membrane, and immunoblotted with antibodies against p-Met, p-AKT, p-FOXO1, p-GSK3, p-Bad, and β-actin, as indicated. B: c-MET siRNA dephosphorylates AKT in HCT-15 cells. The HCT-15 cells were transfected with 100 nmol/L scrambled siRNA and 50 and 100 nmol/L c-MET siRNA with Lipofectamine, as described in Materials and Methods. After 48 hours of transfection, cells were lysed and equal amounts of proteins were separated by SDS-PAGE, transferred to a PVDF membrane, and immunoblotted with antibodies against p-MET, p-AKT, and β-actin, as indicated. C: HGF-mediated phosphorylation of p-MET and AKT in CRC cells. HCT-15 cells were serum starved for 24 hours and then treated with 100 nmol/L HGF for various periods, as indicated. After cell lysis, equal amounts of proteins were separated by SDS-PAGE, transferred to a PVDF membrane, and immunoblotted with antibodies against p-Met, p-AKT, and β-actin, as indicated. D: PHA665752 treatment inhibits HGF-induced cell viability in CRC cells. HCT-15 and SW-480 cells were serum starved for 24 hours and treated with 5 μmol/L PHA665752 in the presence and absence of 100 ng HGF for 24 hours. Cell viability assays were performed using MTT, as described in Materials and Methods. The graph displays the mean ± SD of three independent experiments, with replicates of six wells for all of the doses and vehicle control for each experiment. *P < 0.001 (Student's t-test). E: PHA665752 treatment inactivates HGF-induced phosphorylation of p-MET and AKT. The HCT-15 cell line was serum starved for 24 hours and treated with and without 5 μmol/L PHA665752 for 24 hours in the presence and absence of 100 nmol/L HGF. After treatment, cells were lysed and equal amounts of proteins were separated by SDS-PAGE, transferred to a PVDF membrane, and immunoblotted with antibodies against p-MET, p-AKT, and β-actin, as indicated. F: AKT siRNA down-regulates AKT expression but does not affect phosphorylation of p-MET in CRC cells. HCT-15 cells were transfected with 100 nmol/L scrambled siRNA and 50 and 100 nmol/L AKT siRNA with Lipofectamine, as described in Materials and Methods. After 48 hours of transfection, cells were lysed and equal amounts of proteins were separated by SDS-PAGE, transferred to a PVDF membrane, and immunoblotted with antibodies against AKT, p-Met, and β-actin, as indicated.
We were also interested in understanding the association between c-Met and AKT; therefore, we performed transfection experiments on CRC cells using siRNA against c-Met. Transfection of c-Met–specific siRNA in HCT-15 cells down-regulated expression of c-Met and dephosphorylated AKT (Figure 3B). These data suggest that AKT activation is mediated by c-Met in CRC cell lines.
To assess the role of HGF in activation of c-Met, serum-starved HCT-15 cells were treated with 100 ng/mL HGF for various periods and phosphorylation status levels of c-Met and AKT were determined. HGF induced time-dependent phosphorylation of c-Met and AKT (Figure 3C). In addition, HGF treatment of serum-starved CRC cells caused a significant increase in cell viability in HCT-15 and SW-480 cells; however, pretreatment with PHA665752 abrogated HGF-mediated proliferation of these cells (Figure 3D). Furthermore, pretreatment of the HCT-15 cell line with PHA665752 prevented HGF-mediated activation of c-Met and AKT (Figure 3E). These data indicated that HGF-mediated activation of c-Met played an important role in CRC cell proliferation.
Finally, we sought to determine whether there was cross talk between c-Met and AKT; we performed transfection studies with siRNA against AKT. Our data showed that AKT siRNA had no effect on the activation status of c-Met, suggesting that c-Met mediates AKT activation in CRC cell lines (Figure 3F).
PHA665752-Induced Change in Mitochondrial Membrane Potential and Release of Cytochrome c into Cytosol
One of the downstream targets of p-AKT, Bad, was also dephosphorylated after treatment with PHA665752. Once Bad becomes dephosphorylated, it causes conformational changes of Bax protein, leading to changes in mitochondrial membrane potential and release of cytochrome c into cytosol. To assess this, HCT-15 cells were treated with 5 μmol/L for various periods, lysed in 1.0% Chaps lysis buffer, and immunoprecipitated with Bax 6A7 antibody, which only recognizes the conformationally changed Bax. As shown in Figure 4A, conformationally changed Bax was detected as early as 4 hours of treatment and continued up to 16 hours. To study the role of PHA665752 in modulating the mitochondrial membrane potential, we used JC1 dye as a surrogate marker to measure change in membrane potential in CRC cells. We treated CRC cells with 1 and 5 μmol/L PHA665752 for 24 hours and stained the cells with JC1 dye. As shown in Figure 4B, there was an increase in percentage of JC1-stained green fluorescence apoptotic cells after PHA665752 treatment, suggesting a change in mitochondrial membrane potential. This was followed with a dose-dependent increase in cytochrome c expression in the cytosolic fraction and a decrease in mitochondrial fraction in CRC cells after PHA665752 treatment, as detected by immunoblotting (Figure 4C). These results clearly indicate that PHA665752 treatment causes a change in mitochondrial membrane potential, leading to release of cytochrome c from the mitochondria to the cytosol.
Figure 4.
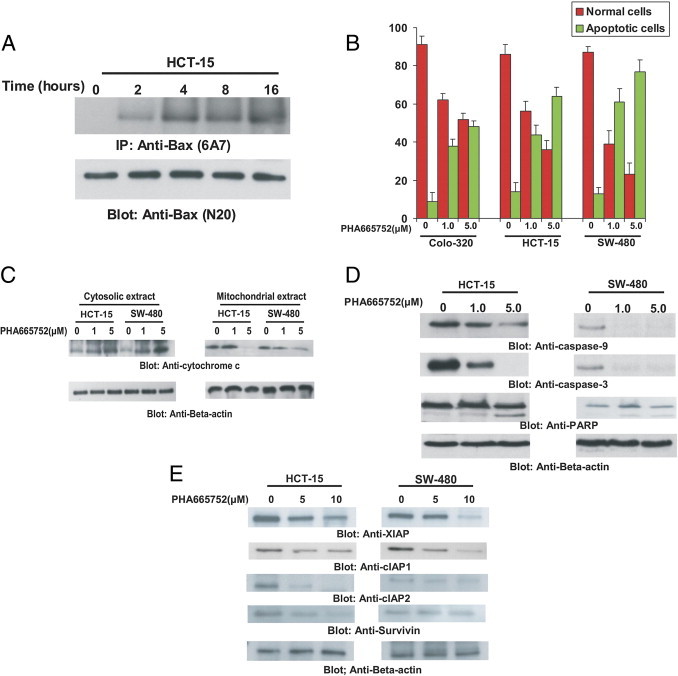
PHA665752-induced activation of the mitochondrial apoptotic pathway in CRC cells. A: PHA665752-induced Bax activation in CRC cells. After treating with 5 μmol/L PHA665752 for 2, 4, 8, and 16 hours, as indicated, HCT-15 cells were lysed in 1% Chaps lysis buffer and subjected to immunoprecipitation with either anti-Bax 6A7 antibody for detection of conformationally changed Bax protein. In addition, the total cell lysates were directly applied to SDS-PAGE, transferred to an Immobilon membrane, and immunoblotted with specific anti-Bax polyclonal antibody. B: Loss of mitochondrial potential by PHA665752 treatment of CRC cells. Colo-320, HCT-15, and SW-480 cells were treated with and without 1 and 5 μmol/L PHA665752 for 24 hours. Live cells with intact mitochondrial membrane potential (red bars) and dead cells with lost mitochondrial membrane potential (green bars) were measured by JC1 staining and analyzed by flow cytometry, as described in Materials and Methods. An average of three independent experiments is depicted. C: PHA665752-induced release of cytochrome c. HCT-15 and SW-480 cells were treated with and without 1 and 5 μmol/L PHA665752 for 24 hours. Mitochondrial-free cytosolic fractions and mitochondrial extracts were isolated, as described in Materials and Methods. Cell extracts were separated on SDS-PAGE, transferred to a polyvinylidene difluoride (PVDF) membrane, and immunoblotted with an antibody against cytochrome c. β-Actin was used for equal loading. D: Activation of caspases induced by treatment of PHA665752 in CRC cells. HCT-15 and SW-480 cells were treated with and without 1 and 5 μmol/L PHA665752 for 24 hours. Cells were lysed, and proteins were immunoblotted with antibodies against caspase-9, pro-caspase-3, PARP, and β-actin. E: PHA665752-induced down-regulation of XIAP, cIAP1, cIAP2, and Survivin expression. HCT-15 and SW-480 cells were treated with and without 1 and 5 μmol/L PHA665752 for 24 hours. Cells were lysed, and equal amounts of proteins were separated on SDS-PAGE, transferred to a PVDF membrane, and immunoblotted with antibodies against XIAP, cIAP1, cIAP2, Survivin, and β-actin, as indicated.
PHA665752-Induced Activation of Caspases and Proteolytic Cleavage of PARP in CRC Cells
Caspases are activated in response to various apoptotic stimuli.36, 37, 38 We, therefore, investigated whether PHA665752 treatment also caused their activation in CRC cells. As shown in Figure 4D, PHA665752 treatment of CRC cells caused activation and cleavage of caspases 9 and 3 and PARP in HCT-15 and SW-480 cell lines.
PHA665752-Induced Down-Regulation of IAPs in CRC Cells
We have previously shown a strong association between PI3K-AKT and XIAP.38 Because our data also showed that p-Met inhibition led to inactivation of AKT in CRC, we examined whether PHA665752 treatment modulated the expression of XIAP and other members of the IAP family. As shown in Figure 4E, PHA665752 treatment caused down-regulation of XIAP, cIAP1, cIAP2, and Survivin in HCT-15 and SW-480 CRC cell lines. These results indicate that IAPs may also be involved in PHA665752-induced apoptosis.
PHA665752-Induced Treatment of CRC Cells Causes ROS Generation
There are several compounds that are being used in therapy that act via the release of reactive oxygen species (ROS).45 We, therefore, examined whether ROS was also released in CRC cells treated with PHA665752 for various periods. H2DCFDA-based fluorescence-activated cell sorting detection of the HCT-15 and SW-480 cell lines revealed that intracellular ROS levels were released in CRC cell lines as early as 2 hours after treatment with 1 μmol/L PHA665752 (Figure 5A).
Figure 5.
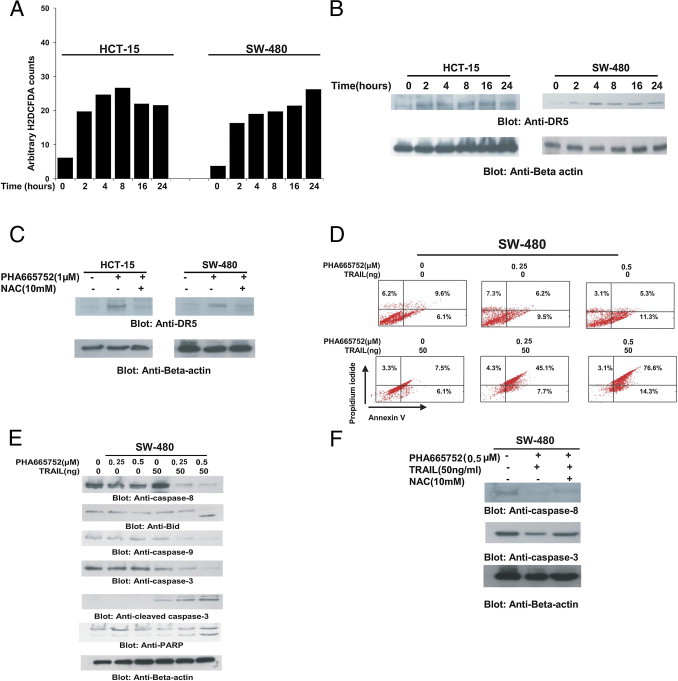
PHA665752 sensitizes CRC cells to TRAIL-mediated apoptosis. A: PHA665752 increases ROS generation in CRC cells. HCT-15 and SW-480 cells were loaded with 10 μmol/L H2DCFDA for 45 minutes and then were incubated in the absence or presence of 1 μmol/L PHA665752 for the indicated periods. After washing with PBS, cells were resuspended in PBS and immediately analyzed using flow cytometry for intracellular accumulation of ROS. B: PHA665752-induced up-regulation of DR5 expression. HCT-15 and SW-480 cells were incubated with 1 μmol/L PHA665752 for various periods. After cell lysis, equal amounts of proteins were separated by SDS-PAGE, transferred to an Immobilon membrane, and immunoblotted with antibodies against DR5 and β-actin. C: PHA665752-induced DR5 up-regulation is ROS dependent. HCT-15 cells were pretreated with 10 mmol/L NAC for 2 hours and subsequently treated with 1 μmol/L PHA665752 for 24 hours. After cell lysis, equal amounts of proteins were separated by SDS-PAGE, transferred to an Immobilon membrane, and immunoblotted with antibodies against DR5 and β-actin. D: Cotreatment of CRC cells with PHA665752 and TRAIL induced apoptosis. SW-480 cells were treated with subtoxic doses (0.25 and 0.5 μmol/L PHA665752) and subsequently treated with 50 ng/mL TRAIL for 24 hours. Apoptosis was analyzed by staining with fluorescein-conjugated annexin V antibody and PI using flow cytometry. E: SW-480 cells were treated as described in D, and whole cell extracts were prepared and analyzed by using Western blot analysis using antibodies against caspases 8, 9, and 3 and PARP. β-Actin was used as a loading control. F: The activation of caspases 8 and 3 after cotreatment with PHA665752 and TRAIL is ROS dependent. SW-480 cells were pretreated with 10 mmol/L NAC for 2 hours and subsequently treated with a combination of 1 μmol/L PHA665752 and 50 ng/mL TRAIL for 24 hours. After cell lysis, equal amounts of proteins were separated by SDS-PAGE, transferred to an Immobilon membrane, and immunoblotted with antibodies against caspases 8 and 3 and β-actin.
PHA665752-Induced ROS Generation Causes Up-Regulation of DR5
There are several studies that show that expression of DR5 is up-regulated by ROS generated by several compounds.37, 46 We, therefore, selected two CRC cell lines that expressed low levels of DR5 and sought to determine whether PHA665752-generated free radicals led to up-regulation of DR5. As shown in Figure 5B, PHA665752 treatment of CRC cells up-regulated DR5 expression in a time-dependent manner. We next examined the cell surface expression of DR5 after treatment with PHA665752. As shown in Supplemental Figure S3 (available at http://ajp.amjpathol.org), there was increased surface expression of DR5 in SW-480 cells, starting within 2 hours, peaking at 8 hours, and then decreasing at later points after treatment with 5 μmol/L PHA665752. To confirm the specificity of ROS generation in PHA665752-induced DR5 up-regulation, we assessed DR5 expression in HCT-15 and SW-480 cells preincubated with N-acetyl cysteine (NAC), a scavenger for ROS, for 2 hours, followed by treatment with 1 μmol/L PHA665752. As shown in Figure 5C, NAC pretreatment markedly inhibited PHA665752-induced DR5 up-regulation. These data confirm that up-regulation of DR5 is ROS dependent in CRC cells.
PHA665752 Augmented Antitumor Effects of TRAIL in CRC Cells
TRAIL is an attractive therapeutic agent for cancer treatment. However, many tumors have been resistant to TRAIL-induced apoptosis. We sought to determine whether PHA665752 treatment potentiates or sensitizes the anticancer effects of TRAIL via up-regulation of DR5. As shown in Figure 5D, neither PHA665752 at a subtoxic level nor TRAIL at 50 ng/mL induced apoptosis in SW-480 cells. However, when PHA665752 and TRAIL were combined, the combination induced efficient apoptosis in SW-480 cells. Similar data were obtained for HCT-15 cells (data not shown). Next, we knocked down the expression of c-Met and AKT by siRNA transfection with specific siRNAs, followed by treatment with 50 ng/mL TRAIL for 24 hours. As shown in Supplemental Figure S4 (available at http://ajp.amjpathol.org), SW-480 cells transfected with c-Met and AKT siRNA alone underwent 38% and 43% apoptosis, respectively; however, the addition of TRAIL did not appreciably alter the percentage of apoptosis in SW-480 cells (35% and 47%) in c-Met– and AKT-transfected cells, respectively. There was a negligible amount of apoptosis in SW-480 cells transfected with scrambled siRNA, even in the presence of TRAIL. To further explore the underlying mechanism that may be responsible for enhancement of TRAIL-induced apoptosis by PHA66572, we examined the expression of caspases that play an important role in the induction of apoptosis. As shown in Figure 5E, although PHA665752 and TRAIL alone had a minimal effect on activation of caspases and cleavage of PARP, the combination of the two was highly effective in activation of caspases and consequent PARP cleavage. To confirm whether caspase activation was ROS dependent, SW-480 cells were pretreated with 10 mmol/L NAC for two hours and then treated with 0.5 μmol/L PHA665752 and 50 ng/mL TRAIL for 24 hours. As shown in Figure 5F, caspase 8 and 3 activation was blocked by pretreatment of NAC, suggesting that caspase activation is dependent on ROS release in CRC cells at subtoxic doses. These results indicate that PHA665752 enhanced TRAIL-induced apoptosis via activation of caspases and cleavage of PARP.
Combination of PHA665752 and TRAIL Inhibits CRC Xenografts in Mice
Our in vitro data clearly suggest that PHA665752 potentiates/sensitizes TRAIL-induced apoptosis in CRC cells, indicating a definitive role as therapeutic modalities for treatment of CRC. Therefore, we were interested in determining the role of PHA665752 in combination with TRAIL in the inhibition of CRC xenografts in vivo. Twenty-four nude mice were inoculated s.c. with 5 million HCT-15 cells. The animals were then divided into four groups of six animals each: the first group was treated with 25 mg/kg PHA665752, the second group was treated with a subtoxic dose of 0.5 mg/kg TRAIL, the third group was treated with a combination of these two agents, and the last group was treated with vehicle dimethyl sulfoxide (n = 6). The treatment schedule was twice weekly, and the route of administration was i.p. After 5 weeks of treatment, mice were sacrificed and tumors were collected. As shown in Figure 6A, PHA665752 treatment alone and the combination of PHA665752 and TRAIL caused regression of HCT-15 xenograft tumors in a time-dependent manner in mice, compared with vehicle-treated mice. Although regression of tumor occurred in both groups, statistical significance (P < 0.05) was achieved at the end of the fifth week with the combination treatment of PHA665752 and TRAIL. A significant reduction in tumor weight was also observed in mice treated with PHA665752 combined with TRAIL compared with vehicle (P < 0.05, Figure 6B). In addition, images of tumor after necropsy showed that treatment of a combination of TRAIL and PHA665752 resulted in more shrinkage of tumor size compared with PHA665752, TRAIL, and vehicle treatment alone (Figure 6C). As shown in Figure 6D, there was inactivation of p-Met and p-AKT and cleavage of caspase-3 in primary tumors of mice treated with a combination of PHA665752 and TRAIL, compared with vehicle, PHA665752, and TRAIL alone, by immunoblotting. These data suggest that targeting CRC tumors in vivo using a combination of PHA665752 and TRAIL had a more potent antitumor effect compared with single-agent treatment.
Figure 6.
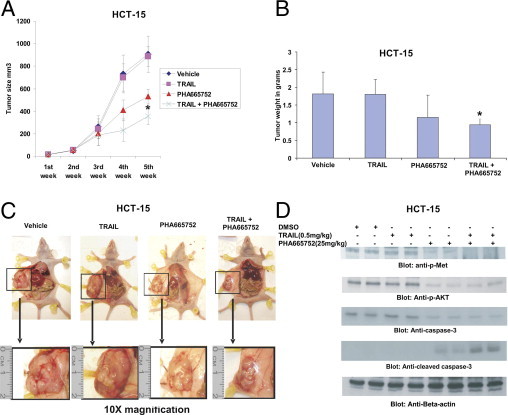
PHA665752 augmented TRAIL-mediated inhibition of CRC xenograft in nude mice. Nude mice at the age of 6 weeks were injected with 5 million HCT-15 cells. A: The volume of each tumor was measured every week. The average (n = 6) tumor volume in vehicle-treated mice and those treated with indicated doses of PHA665752, TRAIL alone, and a combination of PHA665752 and TRAIL. The results are expressed as mean ± SD (n = 6). *P < 0.05 compared with vehicle-treated mice. B: After 5 weeks of treatment, mice were sacrificed and tumor weights were measured. The results are expressed as mean ± SD. *P < 0.05 compared with vehicle-treated mice by Student's t-test. C: Representative tumor images of vehicle-treated mice and mice treated with PHA665752 and/or TRAIL after necropsy. D: Whole cell homogenates from tumors treated with vehicle, 25 mg/kg PHA665752, 0.5 mg/kg TRAIL, and a combination of 0.5 mg/kg TRAIL and 25 mg/kg PHA665752 were immunoblotted with p-Met, p-AKT, caspase 3, cleaved caspase-3, and β-actin antibodies.
Discussion
In the current study, we found p-Met expression in most CRC samples studied (86.8%), and a progressive increase in p-Met expression was observed from healthy colon to adenoma to carcinoma stage, thereby underlining the oncogenic role of c-Met in colorectal carcinogenesis. Because p-Met expression did not significantly differ between adenoma and cancer, we can also postulate that c-Met dysregulation might be an early tumor-initiating event. Constitutive activation of c-Met in CRC tumor samples was associated with activation of AKT (P = 0.0219) and a high expression of proliferative marker Ki-67 (P = 0.0382). Interestingly, p-Met expression also significantly correlated with the expression of DR5 (P = 0.0344).
Our in vitro experiments showed that PHA665752, a tyrosine kinase inhibitor of c-Met, caused inhibition of cell proliferation and induced apoptosis in CRC cells via inactivation of c-Met and AKT pathways. Interestingly, gene-silencing studies using c-Met–specific siRNA down-regulated expression and abrogated p-Met–mediated AKT signaling, confirming that PHA665752 specifically induced its apoptotic effect via inactivation of c-Met and AKT. We also show that HGF stimulated activity of c-Met and AKT in serum-starved CRC cells. Furthermore, PHA665752 treatment inactivated HGF-induced phosphorylation of c-Met and AKT, suggesting that AKT activity is dependent on c-Met signaling in CRC cells. Finally, AKT-specific siRNA did not affect c-Met expression in CRC cell lines. These data strongly indicate that the basal c-Met activity plays a role in activating the PI3K-AKT pathway.
Considering the potential utility of TRAIL as a therapeutic target and the tight linkage observed between p-Met and DR5 expression in CRC samples, we further analyzed the phenotype of the CRC subgroup with coexpression of p-Met and DR5. Interestingly, this CRC subset was characterized by a less aggressive phenotype, and we also observed a tight linkage with proapoptotic markers, such as KRAS4A, p27kip1, and cleaved caspase-3. Coexpression of c-Met and DR5 was associated with better overall survival and was an independent prognostic marker in a Cox regression analysis. We performed additional analysis to compare the overall survival in the CRC subgroup showing high p-Met and low DR5 expression with the CRC subgroup with coexpression of high p-Met and DR5. The CRC subgroup with coexpression of high p-Met and DR5 showed better 5-year overall survival compared with the other group (P = 0.0390). From these observations, we hypothesize that DR5 coexpression overcame the oncogenic effect of p-Met activity and conferred a better survival.
Based on these findings, we hypothesized that modulation of p-Met and DR5 expression may result in induction of apoptosis in CRC cells. To test this hypothesis, we selected two CRC cell lines with high p-Met activity and a low expression level of DR5. The inhibition of p-Met activity with PHA665752, a selective inhibitor of p-Met activity, induced dose-dependent inhibition of cell viability via mitochondrial and caspase-activated apoptosis. In addition, interestingly, PHA665752 also induced up-regulation of DR5 via generation of ROS. The PHA665752-mediated up-regulation of DR5 was abrogated by pretreatment of CRC cells with NAC, a scavenger of ROS, suggesting the role of ROS in DR5 up-regulation. To our knowledge, this is the first report that shows that PHA665752 treatment leads to the generation of ROS in cancer cell lines.
Among all of the apoptosis-inducing cytokines, TRAIL is the only one still being actively pursued for its anticancer properties in the clinic. Many human cancer cell types, however, are resistant to TRAIL-induced apoptosis.26, 27 Our in vitro data showed that PHA665752 significantly up-regulated DR5 expression in CRC cells and that these cells showed profound apoptosis when treated with a combination of subtoxic doses of TRAIL and PHA665752. However, this effect was not seen by depletion of c-Met expression by siRNA. One possible reason could be that PHA665752 treatment, unlike siRNA transfection, inhibits activation of c-Met; on the other hand, it causes release of ROS that up-regulates the expression of DR5. These data are in concordance with another report47 that shows that TRAIL resistance in prostate and breast cancer cell lines is overcome by combination with PHA665752 by increasing the stability of TRAIL receptors. Furthermore, our in vivo study data, using combination treatment of PHA665752 and TRAIL, showed a more effective antitumor effect on CRC cell xenografts in a mouse model. Thus, in clinical settings, a combination of PHA665752 and TRAIL may be a novel strategy for CRC that is resistant to chemotherapy.
In summary, our data suggest that CRC tumors of Middle Eastern origin have ubiquitous overexpression of p-MET and, therefore, targeting p-MET may be an attractive therapeutic option. Considering the tight linkage between p-MET and DR5 in clinical samples and the synergistic efficacy of the PHA665752 and TRAIL combination regimen, the findings of our study could provide a mechanistic basis for a pharmacogenomic approach that could be further exploited therapeutically. Further studies are needed to elucidate the molecular link between p-MET overexpression and DR5 expression that may serve as a promising therapeutic target in this molecular and distinct subtype of CRC.
Acknowledgments
We acknowledge Syed Zeeshan Qadri and Thara George for statistical support and Saeeda O. Ahmed and Valorie Balde for technical support.
Footnotes
Supported by King Abdulaziz City for Science and Technology (KACST) and the National Comprehensive Plan for Science and Technology, resulting from a KACST Project (08-MED479-20).
S.U. and A.R.H. contributed equally to this work.
S.U., A.R.H., and K.S.A.-K. designed and performed research, analyzed and interpreted data, and wrote the manuscript; S.U. and A.R.H. contributed equally to the manuscript; M.A. and P.B. performed research, collected data, analyzed and interpreted data, and helped to write the manuscript; and N.A.-S., A.A., L.H.A., S.A., and F.A.-D. collected clinical samples and data and analyzed and interpreted data.
Supplemental material for this article can be found at http://ajp.amjpathol.org or at doi: 10.1016/j.ajpath.2011.08.007.
Supplementary data
Box plots indicate the mean ± SD of p-MET expression in three groups: adjacent healthy colorectal mucosa, adenomas, and colorectal carcinomas. The expression of p-MET in colorectal adenomas (113.48 ± 64.32) and colorectal carcinomas (105.23 ± 59.62) was more than healthy colon (77.59 ± 40.32; P = 0.0150 and P < 0.0001, respectively). However, there was no difference in the expression of p-MET between adenomas and carcinomas.
Proteins from colo-320, HCT-15, LOVO, and SW-480 cell lines were isolated and immunoblotted with antibodies against p-Met and β-actin.
SW-480 cells (2 × 10⁶) were treated with 5 μmol/L PHA665752 for various periods, as indicated, and harvested by centrifugation at 178 × g for 10 minutes at 4°C. Cells were washed once with one times PBS with 3% bovine serum albumin (BSA) and resuspended in 200 μL of PBS with 3% BSA. DR5 antibody, 1 μg/mL (R&D), was added, and the cells were incubated on ice for 30 minutes. After incubation, cells were washed twice in PBS containing 0.2% BSA, resuspended in 200 μL of PBS with 3% BSA and 1 μg/mL donkey anti-goat fluorescein isothiocyanate–conjugated secondary antibody, and incubated at 4°C in the dark for 30 minutes. Cells were washed twice with PBS containing 0.2% BSA, and cells were resuspended in 500 μL of PBS and analyzed by flow cytometry.
SW-480 cells were transfected with 100 nmol/L scrambled, c-Met, and AKT siRNA with Lipofectamine, as described in Materials and Methods. A: After 48 hours of transfection, cells were treated with 50 ng/mL TRAIL for 24 hours and analyzed by flow cytometry after staining with annexin V–fluorescein isothiocyanate/PI. B: An average of three independent experiments.
References
- 1.Douillard J.Y., Cunningham D., Roth A.D., Navarro M., James R.D., Karasek P., Jandik P., Iveson T., Carmichael J., Alakl M., Gruia G., Awad L., Rougier P. Irinotecan combined with fluorouracil compared with fluorouracil alone as first-line treatment for metastatic colorectal cancer: a multicentre randomised trial. Lancet. 2000;355:1041–1047. doi: 10.1016/s0140-6736(00)02034-1. [DOI] [PubMed] [Google Scholar]
- 2.Khamly K., Jefford M., Michael M., Zalcberg J. Beyond 5-fluorouracil: new horizons in systemic therapy for advanced colorectal cancer. Expert Opin Investig Drugs. 2005;14:607–628. doi: 10.1517/13543784.14.6.607. [DOI] [PubMed] [Google Scholar]
- 3.Hurwitz H.I., Fehrenbacher L., Hainsworth J.D., Heim W., Berlin J., Holmgren E., Hambleton J., Novotny W.F., Kabbinavar F. Bevacizumab in combination with fluorouracil and leucovorin: an active regimen for first-line metastatic colorectal cancer. J Clin Oncol. 2005;23:3502–3508. doi: 10.1200/JCO.2005.10.017. [DOI] [PubMed] [Google Scholar]
- 4.Cunningham D., Humblet Y., Siena S., Khayat D., Bleiberg H., Santoro A., Bets D., Mueser M., Harstrick A., Verslype C., Chau I., Van Cutsem E. Cetuximab monotherapy and cetuximab plus irinotecan in irinotecan-refractory metastatic colorectal cancer. N Engl J Med. 2004;351:337–345. doi: 10.1056/NEJMoa033025. [DOI] [PubMed] [Google Scholar]
- 5.Meyerhardt J.A., Mayer R.J. Systemic therapy for colorectal cancer. N Engl J Med. 2005;352:476–487. doi: 10.1056/NEJMra040958. [DOI] [PubMed] [Google Scholar]
- 6.Eder J.P., Vande Woude G.F., Boerner S.A., LoRusso P.M. Novel therapeutic inhibitors of the c-Met signaling pathway in cancer. Clin Cancer Res. 2009;15:2207–2214. doi: 10.1158/1078-0432.CCR-08-1306. [DOI] [PubMed] [Google Scholar]
- 7.Breuhahn K., Longerich T., Schirmacher P. Dysregulation of growth factor signaling in human hepatocellular carcinoma. Oncogene. 2006;25:3787–3800. doi: 10.1038/sj.onc.1209556. [DOI] [PubMed] [Google Scholar]
- 8.Liu C., Park M., Tsao M.S. Overexpression of c-met proto-oncogene but not epidermal growth factor receptor or c-erbB-2 in primary human colorectal carcinomas. Oncogene. 1992;7:181–185. [PubMed] [Google Scholar]
- 9.Di Renzo M.F., Olivero M., Giacomini A., Porte H., Chastre E., Mirossay L., Nordlinger B., Bretti S., Bottardi S., Giordano S., Plebani M., Gespach C., Comoglio P.M. Overexpression and amplification of the met/HGF receptor gene during the progression of colorectal cancer. Clin Cancer Res. 1995;1:147–154. [PubMed] [Google Scholar]
- 10.Wielenga V.J., van der Voort R., Taher T.E., Smit L., Beuling E.A., van Krimpen C., Spaargaren M., Pals S.T. Expression of c-Met and heparan-sulfate proteoglycan forms of CD44 in colorectal cancer. Am J Pathol. 2000;157:1563–1573. doi: 10.1016/S0002-9440(10)64793-1. [DOI] [PMC free article] [PubMed] [Google Scholar]
- 11.Umeki K., Shiota G., Kawasaki H. Clinical significance of c-met oncogene alterations in human colorectal cancer. Oncology. 1999;56:314–321. doi: 10.1159/000011985. [DOI] [PubMed] [Google Scholar]
- 12.Christensen J.G., Burrows J., Salgia R. c-Met as a target for human cancer and characterization of inhibitors for therapeutic intervention. Cancer Lett. 2005;225:1–26. doi: 10.1016/j.canlet.2004.09.044. [DOI] [PubMed] [Google Scholar]
- 13.Goodwin C.R., Lal B., Zhou X., Ho S., Xia S., Taeger A., Murray J., Laterra J. Cyr61 mediates hepatocyte growth factor-dependent tumor cell growth, migration, and Akt activation. Cancer Res. 2010;70:2932–2941. doi: 10.1158/0008-5472.CAN-09-3570. [DOI] [PMC free article] [PubMed] [Google Scholar]
- 14.Knowles L.M., Stabile L.P., Egloff A.M., Rothstein M.E., Thomas S.M., Gubish C.T., Lerner E.C., Seethala R.R., Suzuki S., Quesnelle K.M., Morgan S., Ferris R.L., Grandis J.R., Siegfried J.M. HGF and c-Met participate in paracrine tumorigenic pathways in head and neck squamous cell cancer. Clin Cancer Res. 2009;15:3740–3750. doi: 10.1158/1078-0432.CCR-08-3252. [DOI] [PMC free article] [PubMed] [Google Scholar]
- 15.Hussain A.R., Khan A.S., Ahmed S.O., Ahmed M., Platanias L.C., Al-Kuraya K.S., Uddin S. Apigenin induces apoptosis via downregulation of S-phase kinase-associated protein 2-mediated induction of p27Kip1 in primary effusion lymphoma cells. Cell Prolif. 2010;43:170–183. doi: 10.1111/j.1365-2184.2009.00662.x. [DOI] [PMC free article] [PubMed] [Google Scholar]
- 16.Datta S.R., Dudek H., Tao X., Masters S., Fu H., Gotoh Y., Greenberg M.E. Akt phosphorylation of BAD couples survival signals to the cell-intrinsic death machinery. Cell. 1997;91:231–241. doi: 10.1016/s0092-8674(00)80405-5. [DOI] [PubMed] [Google Scholar]
- 17.Voutsinas G.E., Stravopodis D.J. Molecular targeting and gene delivery in bladder cancer therapy. J BUON. 2009;14(Suppl 1):S69–S78. [PubMed] [Google Scholar]
- 18.Kurebayashi J., Okubo S., Yamamoto Y., Ikeda M., Tanaka K., Otsuki T., Sonoo H. Additive antitumor effects of gefitinib and imatinib on anaplastic thyroid cancer cells. Cancer Chemother Pharmacol. 2006;58:460–470. doi: 10.1007/s00280-006-0185-x. [DOI] [PubMed] [Google Scholar]
- 19.Moschella F., Proietti E., Capone I., Belardelli F. Combination strategies for enhancing the efficacy of immunotherapy in cancer patients. Ann N Y Acad Sci. 2010;1194:169–178. doi: 10.1111/j.1749-6632.2010.05464.x. [DOI] [PubMed] [Google Scholar]
- 20.Dan S., Okamura M., Seki M., Yamazaki K., Sugita H., Okui M., Mukai Y., Nishimura H., Asaka R., Nomura K., Ishikawa Y., Yamori T. Correlating phosphatidylinositol 3-kinase inhibitor efficacy with signaling pathway status: in silico and biological evaluations. Cancer Res. 2010;70:4982–4994. doi: 10.1158/0008-5472.CAN-09-4172. [DOI] [PubMed] [Google Scholar]
- 21.Wilson P.M., Labonte M.J., Lenz H.J. Molecular markers in the treatment of metastatic colorectal cancer. Cancer J. 2010;16:262–272. doi: 10.1097/PPO.0b013e3181e07738. [DOI] [PubMed] [Google Scholar]
- 22.Spierings D.C., de Vries E.G., Vellenga E., van den Heuvel F.A., Koornstra J.J., Wesseling J., Hollema H., de Jong S. Tissue distribution of the death ligand TRAIL and its receptors. J Histochem Cytochem. 2004;52:821–831. doi: 10.1369/jhc.3A6112.2004. [DOI] [PubMed] [Google Scholar]
- 23.Suliman A., Lam A., Datta R., Srivastava R.K. Intracellular mechanisms of TRAIL: apoptosis through mitochondrial-dependent and -independent pathways. Oncogene. 2001;20:2122–2133. doi: 10.1038/sj.onc.1204282. [DOI] [PubMed] [Google Scholar]
- 24.Schulze-Osthoff K., Ferrari D., Los M., Wesselborg S., Peter M.E. Apoptosis signaling by death receptors. Eur J Biochem. 1998;254:439–459. doi: 10.1046/j.1432-1327.1998.2540439.x. [DOI] [PubMed] [Google Scholar]
- 25.Ashkenazi A., Dixit V.M. Death receptors: signaling and modulation. Science. 1998;281:1305–1308. doi: 10.1126/science.281.5381.1305. [DOI] [PubMed] [Google Scholar]
- 26.Barua S., Linton R.S., Gamboa J., Banerjee I., Yarmush M.L., Rege K. Lytic peptide-mediated sensitization of TRAIL-resistant prostate cancer cells to death receptor agonists. Cancer Lett. 2010;293:240–253. doi: 10.1016/j.canlet.2010.01.012. [DOI] [PubMed] [Google Scholar]
- 27.Testa U. TRAIL/TRAIL-R in hematologic malignancies. J Cell Biochem. 2010;110:21–34. doi: 10.1002/jcb.22549. [DOI] [PubMed] [Google Scholar]
- 28.Bavi P., Jehan Z., Atizado V., Al-Dossari H., Al-Dayel F., Tulbah A., Amr S.S., Sheikh S.S., Ezzat A., El-Solh H., Uddin S., Al-Kuraya K. Prevalence of fragile histidine triad expression in tumors from Saudi Arabia: a tissue microarray analysis. Cancer Epidemiol Biomarkers Prev. 2006;15:1708–1718. doi: 10.1158/1055-9965.EPI-05-0972. [DOI] [PubMed] [Google Scholar]
- 29.Uddin S., Siraj A.K., Al-Rasheed M., Ahmed M., Bu R., Myers J.N., Al-Nuaim A., Al-Sobhi S., Al-Dayel F., Bavi P., Hussain A.R., Al-Kuraya K.S. Fatty acid synthase and AKT pathway signaling in a subset of papillary thyroid cancers. J Clin Endocrinol Metab. 2008;93:4088–4097. doi: 10.1210/jc.2008-0503. [DOI] [PubMed] [Google Scholar]
- 30.Uddin S., Hussain A.R., Ahmed M., Al-Dayel F., Bu R., Bavi P., Al-Kuraya K.S. Inhibition of c-MET is a potential therapeutic strategy for treatment of diffuse large B-cell lymphoma. Lab Invest. 2010;90:1346–1356. doi: 10.1038/labinvest.2010.108. [DOI] [PubMed] [Google Scholar]
- 31.Camp R.L., Dolled-Filhart M., Rimm D.L. X-tile: a new bio-informatics tool for biomarker assessment and outcome-based cut-point optimization. Clin Cancer Res. 2004;10:7252–7259. doi: 10.1158/1078-0432.CCR-04-0713. [DOI] [PubMed] [Google Scholar]
- 32.McCarthy M.M., Sznol M., DiVito K.A., Camp R.L., Rimm D.L., Kluger H.M. Evaluating the expression and prognostic value of TRAIL-R1 and TRAIL-R2 in breast cancer. Clin Cancer Res. 2005;11:5188–5194. doi: 10.1158/1078-0432.CCR-05-0158. [DOI] [PubMed] [Google Scholar]
- 33.Abubaker J., Bavi P., Al-Haqawi W., Sultana M., Al-Harbi S., Al-Sanea N., Abduljabbar A., Ashari L.H., Alhomoud S., Al-Dayel F., Uddin S., Al-Kuraya K.S. Prognostic significance of alterations in KRAS isoforms KRAS-4A/4B and KRAS mutations in colorectal carcinoma. J Pathol. 2009;219:435–445. doi: 10.1002/path.2625. [DOI] [PubMed] [Google Scholar]
- 34.Hussain A.R., Al-Rasheed M., Manogaran P.S., Al-Hussein K.A., Platanias L.C., Al Kuraya K., Uddin S. Curcumin induces apoptosis via inhibition of PI3′-kinase/AKT pathway in acute T cell leukemias. Apoptosis. 2006;11:245–254. doi: 10.1007/s10495-006-3392-3. [DOI] [PubMed] [Google Scholar]
- 35.Hussain A.R., Al-Jomah N.A., Siraj A.K., Manogaran P., Al-Hussein K., Abubaker J., Platanias L.C., Al-Kuraya K.S., Uddin S. Sanguinarine-dependent induction of apoptosis in primary effusion lymphoma cells. Cancer Res. 2007;67:3888–3897. doi: 10.1158/0008-5472.CAN-06-3764. [DOI] [PubMed] [Google Scholar]
- 36.Uddin S., Hussain A.R., Siraj A.K., Manogaran P.S., Al-Jomah N.A., Moorji A., Atizado V., Al-Dayel F., Belgaumi A., El-Solh H., Ezzat A., Bavi P., Al-Kuraya K.S. Role of phosphatidylinositol 3′-kinase/AKT pathway in diffuse large B-cell lymphoma survival. Blood. 2006;108:4178–4186. doi: 10.1182/blood-2006-04-016907. [DOI] [PubMed] [Google Scholar]
- 37.Hussain A.R., Ahmed M., Al-Jomah N.A., Khan A.S., Manogaran P., Sultana M., Abubaker J., Platanias L.C., Al-Kuraya K.S., Uddin S. Curcumin suppresses constitutive activation of nuclear factor-kappa B and requires functional Bax to induce apoptosis in Burkitt's lymphoma cell lines. Mol Cancer Ther. 2008;7:3318–3329. doi: 10.1158/1535-7163.MCT-08-0541. [DOI] [PubMed] [Google Scholar]
- 38.Uddin S., Hussain A.R., Ahmed M., Abubaker J., Al-Sanea N., Abduljabbar A., Ashari L.H., Alhomoud S., Al-Dayel F., Bavi P., Al-Kuraya K.S. High prevalence of fatty acid synthase expression in colorectal cancers in Middle Eastern patients and its potential role as a therapeutic target. Am J Gastroenterol. 2009;104:1790–1801. doi: 10.1038/ajg.2009.230. [DOI] [PubMed] [Google Scholar]
- 39.Uddin S., Ahmed M., Hussain A., Abubaker J., Al-Sanea N., AbdulJabbar A., Ashari L.H., Alhomoud S., Al-Dayel F., Jehan Z., Bavi P., Siraj A.K., Al-Kuraya K.S. Genome-wide expression analysis of Middle Eastern colorectal cancer reveals FOXM1 as a novel target for cancer therapy. Am J Pathol. 2011;178:537–547. doi: 10.1016/j.ajpath.2010.10.020. [DOI] [PMC free article] [PubMed] [Google Scholar]
- 40.Watson G.A., Zhang X., Stang M.T., Levy R.M., Queiroz de Oliveira P.E., Gooding W.E., Christensen J.G., Hughes S.J. Inhibition of c-Met as a therapeutic strategy for esophageal adenocarcinoma. Neoplasia. 2006;8:949–955. doi: 10.1593/neo.06499. [DOI] [PMC free article] [PubMed] [Google Scholar]
- 41.Bu R., Uddin S., Bavi P., Hussain A.R., Al-Dayel F., Ghourab S., Ahmed M., Al-Kuraya K.S. HGF/c-Met pathway has a prominent role in mediating antiapoptotic signals through AKT in epithelial ovarian carcinoma. Lab Invest. 2011;91:124–137. doi: 10.1038/labinvest.2010.136. [DOI] [PubMed] [Google Scholar]
- 42.Mukohara T., Civiello G., Davis I.J., Taffaro M.L., Christensen J., Fisher D.E., Johnson B.E., Janne P.A. Inhibition of the met receptor in mesothelioma. Clin Cancer Res. 2005;11:8122–8130. doi: 10.1158/1078-0432.CCR-05-1191. [DOI] [PubMed] [Google Scholar]
- 43.van der Voort R., Taher T.E., Derksen P.W., Spaargaren M., van der Neut R., Pals S.T. The hepatocyte growth factor/Met pathway in development, tumorigenesis, and B-cell differentiation. Adv Cancer Res. 2000;79:39–90. doi: 10.1016/s0065-230x(00)79002-6. [DOI] [PubMed] [Google Scholar]
- 44.van der Voort R., Taher T.E., Keehnen R.M., Smit L., Groenink M., Pals S.T. Paracrine regulation of germinal center B cell adhesion through the c-met-hepatocyte growth factor/scatter factor pathway. J Exp Med. 1997;185:2121–2131. doi: 10.1084/jem.185.12.2121. [DOI] [PMC free article] [PubMed] [Google Scholar]
- 45.Fruehauf J.P., Meyskens F.L., Jr Reactive oxygen species: a breath of life or death? Clin Cancer Res. 2007;13:789–794. doi: 10.1158/1078-0432.CCR-06-2082. [DOI] [PubMed] [Google Scholar]
- 46.Jung E.M., Lim J.H., Lee T.J., Park J.W., Choi K.S., Kwon T.K. Curcumin sensitizes tumor necrosis factor-related apoptosis-inducing ligand (TRAIL)-induced apoptosis through reactive oxygen species-mediated upregulation of death receptor 5 (DR5) Carcinogenesis. 2005;26:1905–1913. doi: 10.1093/carcin/bgi167. [DOI] [PubMed] [Google Scholar]
- 47.Fan S., Meng Q., Laterra J.J., Rosen E.M. Scatter factor protects tumor cells against apoptosis caused by TRAIL. Anticancer Drugs. 2010;21:10–24. doi: 10.1097/CAD.0b013e32832afc3b. [DOI] [PubMed] [Google Scholar]
Associated Data
This section collects any data citations, data availability statements, or supplementary materials included in this article.
Supplementary Materials
Box plots indicate the mean ± SD of p-MET expression in three groups: adjacent healthy colorectal mucosa, adenomas, and colorectal carcinomas. The expression of p-MET in colorectal adenomas (113.48 ± 64.32) and colorectal carcinomas (105.23 ± 59.62) was more than healthy colon (77.59 ± 40.32; P = 0.0150 and P < 0.0001, respectively). However, there was no difference in the expression of p-MET between adenomas and carcinomas.
Proteins from colo-320, HCT-15, LOVO, and SW-480 cell lines were isolated and immunoblotted with antibodies against p-Met and β-actin.
SW-480 cells (2 × 10⁶) were treated with 5 μmol/L PHA665752 for various periods, as indicated, and harvested by centrifugation at 178 × g for 10 minutes at 4°C. Cells were washed once with one times PBS with 3% bovine serum albumin (BSA) and resuspended in 200 μL of PBS with 3% BSA. DR5 antibody, 1 μg/mL (R&D), was added, and the cells were incubated on ice for 30 minutes. After incubation, cells were washed twice in PBS containing 0.2% BSA, resuspended in 200 μL of PBS with 3% BSA and 1 μg/mL donkey anti-goat fluorescein isothiocyanate–conjugated secondary antibody, and incubated at 4°C in the dark for 30 minutes. Cells were washed twice with PBS containing 0.2% BSA, and cells were resuspended in 500 μL of PBS and analyzed by flow cytometry.
SW-480 cells were transfected with 100 nmol/L scrambled, c-Met, and AKT siRNA with Lipofectamine, as described in Materials and Methods. A: After 48 hours of transfection, cells were treated with 50 ng/mL TRAIL for 24 hours and analyzed by flow cytometry after staining with annexin V–fluorescein isothiocyanate/PI. B: An average of three independent experiments.