Abstract
Purpose: The purpose of this work is to demonstrate that multicontrast computed tomography (CT) imaging can be performed using a Talbot-Lau interferometer without phase stepping, thus allowing for an acquisition scheme like that used for standard absorption CT.
Methods: Rather than using phase stepping to extract refraction, small-angle scattering (SAS), and absorption signals, the two gratings of a Talbot-Lau interferometer were rotated slightly to generate a moiré pattern on the detector. A Fourier analysis of the moiré pattern was performed to obtain separate projection images of each of the three contrast signals, all from the same single-shot of x-ray exposure. After the signals were extracted from the detector data for all view angles, image reconstruction was performed to obtain absorption, refraction, and SAS CT images. A physical phantom was scanned to validate the proposed data acquisition method. The results were compared with a phantom scan using the standard phase stepping approach.
Results: The reconstruction of each contrast mechanism produced the expected results. Signal levels and contrasts match those obtained using the phase stepping technique.
Conclusions: Absorption, refraction, and SAS CT imaging can be achieved using the Talbot-Lau interferometer without the additional overhead of long scan time and phase stepping.
Keywords: phase contrast, CT, moire, phase stepping
Phase sensitive x-ray computed tomography (CT) imaging techniques have seen tremendous growth in recent years. Of the methods, Talbot and Talbot-Lau interferometry based differential phase contrast CT (DPC-CT) have shown promise for use in medical imaging.1, 2, 3 However, a potential limitation to the implementation of the technique is the speed of the acquisition due to the added complexity of the phase stepping procedure.1, 2 Several groups have proposed workarounds to address this limitation, including interleaved rotation and phase stepping4 and using the conjugate ray to approximate phase shift.5 However, these methods may suffer from blurring or may not be able to extract the small-angle scattering signal (SAS) that comes with the phase stepping procedure.6, 7, 8
When there is a misalignment of two periodic structures, the G1 and G2 gratings in the case of Talbot interferometry, a moiré pattern is formed on the detector.9 Information about the refraction and SAS characteristics of the object encoded into the fractional Talbot image of the G1 grating is also encoded into the moiré pattern. Using a Fourier analysis method,10 this encoded refraction and SAS information can be extracted. This method has been used in Talbot interferometry using a synchrotron source11, 12 to achieve DPC-CT. Note that a similar Fourier extraction technique can be applied to other schemes where a periodic pattern is generated using one or two absorption grids.13, 14, 15, 16, 17 However, the proposed moiré method in this paper relies on a moiré pattern formed from periodic patterns generated by an interference effect from partially coherent x-rays. This would give the moiré technique the same high sensitivity to refraction and scattering from an object as the phase stepping approach. The sensitivity of the measurement is defined as the ratio of the measured phase offset in the detector plane to the corresponding refraction angle, given by for the Talbot-Lau interferometry, where p2 is the pitch of the final grating and d is the distance between G1 and G2 gratings. This factor is approximately 3 × 10⁵ for the system used here,18 while it is about 103 for methods using larger-period Bucky-type grids.14 In addition to maintaining high sensitivity, because the moiré method does not rely on multiple phase step images at each rotation view angle, tomographic acquisition can proceed much like a standard CT. This enables techniques such as time-resolved DPC-CT.12
In this letter, Fourier analysis of the moiré pattern has been applied to a Talbot-Lau interferometer to achieve multicontrast CT imaging using a standard rotating-anode x-ray tube with a polychromatic x-ray spectrum. We demonstrate the feasibility of the method and give reconstructions of a physical phantom study. These results are then compared to results obtained by using the phase stepping method. The single-shot results show reconstructions of attenuation, phase, and SAS contrast mechanisms all from a single CT acquisition without the need for phase stepping.
In Talbot and Talbot-Lau interferometry, after the introduction of a phase grating, a periodic pattern is produced at Talbot and fractional-Talbot distances , where, for a π phase grating, m is an odd integer, p1 is the pitch of the phase grating, and λ is the wavelength.1, 2 Through a phase stepping procedure of any one grating through its period, the detected intensity on the detector reflects both refraction and SAS in the x-ray beam due to an image object. Alternatively, Fourier analysis of the moiré pattern can be used to avoid phase stepping procedure in a multicontrast CT data acquisition. To generate the moiré pattern, a rotation misalignment between the G1 phase grating and the G2 absorption grating is introduced. The resulting moiré pattern will have a period pm and angle θm.9, 19 For the moiré pattern analysis, it is desirable to have the moiré pattern with a period close to three times the detector pitch. This allows for maximum separation of the harmonic peaks in Fourier space.11, 14
The detected moiré intensity pattern I(u,ν) at a detector pixel (u,ν), where u describes the horizontal direction and ν the vertical, can be described using the first two terms of its Fourier expansion
| (1) |
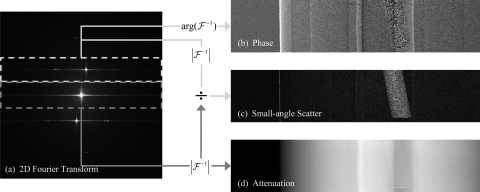
where In is the nth Fourier coefficient and φ is the phase of the pattern. Performing a two-dimensional Fourier transform over the image results in a Fourier space representation of the image as shown in Fig. 1. Projection images of each of the three contrast mechanisms are extracted by performing inverse Fourier transforms on subregions of .
Figure 1.
Schematic of the image extraction process. A two-dimensional Fourier transform (a) is applied to a single projection image. The resulting transform shows distinct peaks representing the DC and first harmonic terms. The position of the first harmonics is determined by the period of the moiré pattern and will be located at 1/pm. The DC and first harmonic peaks are used to generate the refraction (b), small-angle scattering (c), and attenuation (d) projection images. Note that the refraction image (b) is differential in nature, as expected from Eq. 6.
An attenuation contrast image is formed by centering the region of inverse Fourier transform on the center of with a vertical width equal to half of the separation between the DC peak and first harmonics, 1/(2pm), and horizontal width equal to the width of the Fourier space. Because the horizontal direction of Fourier space is not reduced for each projection, the in-plane resolution will remain unchanged in the final reconstruction. The magnitude of the image is normalized to the magnitude of the DC term from a background projection (denoted by the subscript b) with no object to obtain the final attenuation projection image T
| (2) |
where the logarithm has been taken in preparation for tomographic reconstruction.
Similarly, the SAS and refraction contrast images can be acquired by centering the region for inverse Fourier transform of Ĩ over the first harmonic peak located at 1/pm, again with a width of 1/(2pm). The resulting inverse can be processed by taking the magnitude and normalizing to the magnitude of the DC term to get the a projection image of the reduction in visibility due to small-angle scattering events V(u,ν)
| (3) |
This operation is repeated with the object removed, and the ratio of the two measurements gives a measure of the dark-field signal VSAS (Ref. 7)
| (4) |
where, again, the logarithm has been taken in preparation for tomographic reconstruction.
By taking the argument of the resulting inverse Fourier transform of the first harmonic, the phase angle φ in Eq. 1 can be measured with and without the object in place to get Δφ = φ − φb. This gives a measurement of the refraction Θ of the beam due to the object
| (5) |
This measurement of the refraction angle can be tomographically reconstructed using the developed image reconstruction algorithms20 to obtain an image of the decrement δ from the real part of the index of refraction n = 1 − δ of the x-ray wavefront through the object following the relationship
| (6) |
The measurement of δ is directly related to the phase shift of the x-ray through the object.
The proposed method was experimentally demonstrated using our previously described x-ray Talbot-Lau interferometer at the University of Wisconsin-Madison.3 The pitches p0, p1, and p2 are 37, 8, and 4.5 μm, respectively. The pitch p2 is equal to the frequency-doubled and magnified fringe pattern from G1. G2 was purposely rotated to produce the desired moiré pattern on the detector. Due to the introduction of the moiré pattern, the visibility of the fringes was reduced from 16% to 10%.
The object scanned for this study was a cylindrical plastic rod phantom. The cylinder contained three rods made from PTFE, PMMA, and POM, as well as an the air-filled tube with a wooden dowel. The phantom chamber was filled with H2O. The various plastic rods provide uniform phase signal. The wooden dowel rod demonstrates a material with significant SAS, which reduces the intensity modulation on the detector, and contributes to a high-contrast dark-field image, but low-contrast phase and attenuation images. For comparison with the phase stepping method, the wooden dowel was removed from the phantom to reduce any artifacts in the DPC-CT images.
The single-shot moiré acquisition took 360 projections with a 1° angular sampling at 40 kVp and 100 mAs/projection. Each projection set was extracted using the moiré analysis method described above. The phase stepping acquisition used four phase steps. Each phase-step projection used one-fourth the exposure, so that the total exposure was the same for both the single-shot and phase stepping acquisitions. The three contrast mechanisms were extracted from the phase stepping data using the standard method.6, 7, 8 The phase-step projections were binned in the vertical direction to match the size of the moiré technique projections. Each dataset was reconstructed using an FDK-type reconstruction algorithm.21 The reconstructions of the attenuation and scattering images were done by directly applying the FDK algorithm, whereas the phase image was reconstructed by extending a fan beam reconstruction algorithm for differential phase contrast CT to the 3D case.20
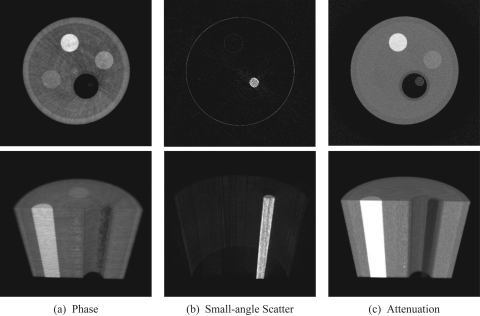
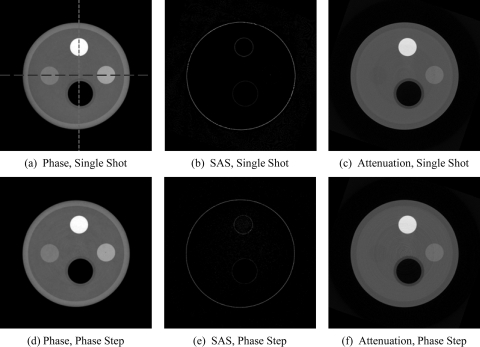
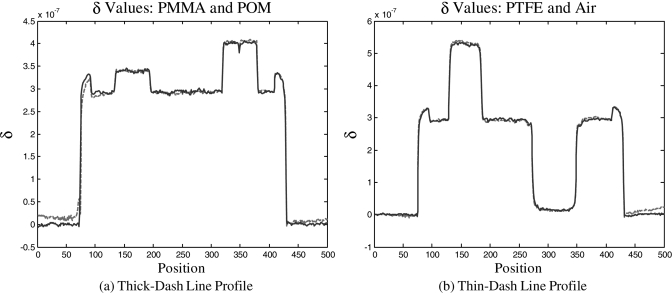
A flowchart of the image extraction technique along with representative projections of each contrast mechanism is shown in Fig. 1. Reconstructions of the projection datasets are shown in Fig. 2. From these images, one can see the nature of each contrast mechanism. The phase and attenuation images are similar, though the phase shows improved contrast in the PMMA cylinder against the water background. This agrees with previous findings which used a phase stepping data acquisition.3 Additionally, the SAS image shows strong signal from the wooden dowel, as well as at the air interface surrounding the phantom. This, again, agrees with previously published results.22 In order to compare the moiré analysis technique with the standard phase stepping technique, Fig. 3 shows the results from both the moiré analysis method and phase stepping method. From these results, one can see that each method retrieves the same information, confirming the moiré technique. Line plots from the DPC-CT reconstructions from each acquisition method are shown in Fig. 4. These plots again confirm the accuracy of the proposed moiré method. The plots also confirm that the in-plane DPC-CT spatial resolution is the same for two different data acquisition methods, as indicated by the same edge definition in both the moiré and phase-stepped reconstructions.
Figure 2.
CT reconstructions of the phase (a), small-angle scattering (b), and attenuation (c) contrast mechanisms. The top row shows axial slices from the center of the image volume, while the bottom row shows volume renderings in the plane of the wooden dowel and PTFE rod. The display range is [1.0, 5.5] × 10−7 for the phase image, [0.0, 0.015] mm−1 for the absorption, and [0.01, 0.065] for the SAS. Note that the wooden dowel, which gives very little signal in the phase and attenuation images, is highly scattering and is easily seen in the SAS image. Also note that the PMMA rod, at the top of the volume renderings, is visible in the phase contrast image and not in the attenuation image.
Figure 3.
CT reconstructions of the phase (a),(d); small-angle scattering (b),(e); and attenuation (c),(f) contrast mechanisms. The top row shows axial 100-slice averages from the moiré reconstructions. The bottom row shows axial 100-slice averages from the phase stepping reconstructions. Note the similarity between the two rows, indicating the ability of the moiré technique to faithfully extract each contrast mechanism. The display range is [1.0, 5.5] × 10−7 for the phase image, [0.0, 0.015] mm−1 for the absorption, and [0.01, 0.065] for the SAS. Image (a) shows the lines over which the plots in Fig. 4 are shown.
Figure 4.
Line plots of the lines drawn in Fig. 3a. In each plot, the dashed line is from the moiré dataset, while the solid line is from the phase stepping dataset. Plot (a) shows the level of the PMMA and POM cylinders. Plot (b) shows the PTFE and air cylinders. As expected from the images in Fig. 3, both image acquisition techniques show the same contrast levels for each material. Additionally, one can see from these plots that the in-plane spatial resolution is maintained for the moiré technique.
Due to the position of the Fourier harmonics along the vertical direction, it is expected that the spatial resolution along the vertical direction (i.e., slice thickness direction in the reconstructed tomographic images) will be different from the in-plane direction. As a result, the net effects of the Fourier space cropping are anisotropic image pixels in the projection images and anisotropic voxels in the reconstructions. Assuming that both the DC and ±1 harmonics should have the same bandwidth after Fourier space cropping, the resulting bandwidth of each harmonic will be 1/3 of the original bandwidth before cropping. Therefore, the anisotropy ratio in spatial resolution would be 3:1, i.e., for CT images, the spatial resolution along the slice thickness direction is about 1/3 of the corresponding in-plane spatial resolution. In clinical applications, this 3:1 anisotropic spatial resolution is not expected to be a problem, as many radiological readings of CT exams are conducted using reformatted images with anisotropic resolution with ratios of 4:1 (e.g., 2.5 mm slice thickness and 0.625 mm in-plane spatial resolution) or 8:1 (e.g., 5 mm slice thickness and 0.625 mm in-plane spatial resolution).
In conclusion, it can be seen that the proposed Fourier analysis of the moiré pattern allows for the successful extraction and reconstruction of the three contrast mechanisms available in Talbot-Lau x-ray interferometry based CT data acquisition. This has been validated by comparing the results to those obtained using the established phase stepping technique. This single-shot technique enables for drastic improvements in CT acquisition time without sacrificing in-plane spatial resolution, thereby increasing the clinical potential. Future work must investigate the new applications available to phase-sensitive CT imaging as a result of the increased scanning performance.
ACKNOWLEDGEMENT
This work is partially supported by an NIH training Grant No. 5T32CA009206-33.
Note Added in Proof
The authors would like to thank one of the anonymous reviewers for bringing the recent work of Sato et al.17 to our attention in the review process. In their work, a similar data acquisition method was proposed for projection imaging using two-dimensional gratings. However, due to the necessary truncation of Fourier space in both directions, the use of two-dimensional gratings will cause an inevitable in-plane resolution loss for CT acquisitions,11, 17 and this may result in inferior CT images.
References
- Momose A., Kawamoto S., Koyama I., Hamaishi Y., Takai H., and Suzuki Y., “Demonstration of x-ray talbot interferometry,” Jpn. J. Appl. Phys., Part 2 42, 866–868 (2003). 10.1143/JJAP.42.L866 [DOI] [Google Scholar]
- Weitkamp T., Diaz A., David C., Pfeiffer F., Stampanoni M., Cloetens P., and Zeigler E., “X-ray phase imaging with a grating interferometer,” Opt. Express 12, 6296–6304 (2005). 10.1364/OPEX.13.006296 [DOI] [PubMed] [Google Scholar]
- Zambelli J., Bevins N., Qi Z., and Chen G.-H., “Radiation dose efficiency comparison between differential phase contrast CT and conventional absorption CT,” Med. Phys. 37, 2473–2479 (2010). 10.1118/1.3425785 [DOI] [PMC free article] [PubMed] [Google Scholar]
- Zanette I., Bech M., Pfeiffer F., and Weitkamp T., “Interlaced phase stepping in phase-contrast x-ray tomography,” Appl. Phys. Lett. 98, 094101 (2011). 10.1063/1.3559849 [DOI] [Google Scholar]
- Zhu P., Zhang K., Wang Z., Liu Y., Liu X., Wu Z., McDonald S., Marone F., and Stampanoni M., “Low-dose, simple, and fast grating-based x-ray phase-contrast imaging,” Proc. Natl. Acad. Sci. U.S.A. 107, 13576–13581 (2010). 10.1073/pnas.1003198107 [DOI] [PMC free article] [PubMed] [Google Scholar]
- Pfeiffer F., Bech M., Bunk O., Donath T., Henrich B., Kraft P., and David C., “X-ray dark-field and phase-contrast imaging using a grating interferometer,” J. Appl. Phys. 105, 102006 (2009). 10.1063/1.3115639 [DOI] [Google Scholar]
- Chen G.-H., Bevins N., Zambelli J., and Qi Z., “Small-angle scattering computed tomography (SAS-CT) using a Talbot-Lau interferometer and a rotating anode x-ray tube: theory and experiments,” Opt Express 18, 12960–12970 (2010). 10.1364/OE.18.012960 [DOI] [PMC free article] [PubMed] [Google Scholar]
- Yashiro W., Terui Y., Kawabata K., and Momose A., “On the origin of visibility contrast in x-ray Talbot interferometry,” Opt. Express 18, 16890–16901 (2010). 10.1364/OE.18.016890 [DOI] [PubMed] [Google Scholar]
- Amidror I., The Theory of the Moiré Phenomenon (Springer, New York, 2009), Vol. 1. [Google Scholar]
- Takeda M., Ina H., and Kobayashi S., “Fourier-transform method of fringe-pattern analysis for computer-based topography and interferometry,” J. Opt. Soc. Am. 72, 156–160 (1982). 10.1364/JOSA.72.000156 [DOI] [Google Scholar]
- Momose A., Yashiro W., Maikusa H., and Takeda Y., “High-speed x-ray phase imaging and x-ray phase tomography with Talbot interferometer and white synchrotron radiation,” Opt. Express 17, 12540–12545 (2009). 10.1364/OE.17.012540 [DOI] [PubMed] [Google Scholar]
- Momose A., Yashiro W., Harasse S., and Kuwabara H., “Four-dimensional x-ray phase tomography with Talbot interferometry and white synchrotron radiation: Dynamic observation of a living worm,” Opt. Express 19, 8423–8432 (2011). 10.1364/OE.19.008423 [DOI] [PubMed] [Google Scholar]
- Wen H., Bennett E., Hegedus M., and Carroll S., “Spatial harmonic imaging of x-ray scattering—initial results,” IEEE Trans. Med. Imaging. 27, 997–1002 (2008). 10.1109/TMI.2007.912393 [DOI] [PMC free article] [PubMed] [Google Scholar]
- Bennett E., Kopace R., Stein A., and Wen H., “A grating-based single-shot x-ray phase contrast and diffraction method for in vivo imaging,” Med. Phys. 37, 6047–6054 (2010). 10.1118/1.3501311 [DOI] [PMC free article] [PubMed] [Google Scholar]
- Stein A., Ilavsky J., Kopace R., Bennett E., and Wen H., “Selective imaging of nano-particle contrast agents by a single-shot x-ray diffraction technique,” Opt. Express 18, 13271–13278 (2010). 10.1364/OE.18.013271 [DOI] [PMC free article] [PubMed] [Google Scholar]
- Lynch S., Pai V., Auxier J., Stein A., Bennett E., Kemble C., Xiao X., Lee W., Morgan N., and Harold Wen H., “Interpretation of dark-field contrast and particle-size selectivity in grating interferometers,” Appl. Opt. 50, 4310–4319 (2011). 10.1364/AO.50.004310 [DOI] [PMC free article] [PubMed] [Google Scholar]
- Sato G. et al. , “Two-dimensional gratings-based phase-contrast imaging using a conventional x-ray tube,” Opt. Lett. 36, 3551–3553 (2011). 10.1364/OL.36.003551 [DOI] [PubMed] [Google Scholar]
- Zambelli J., “Design and characterization of a phase contrast x-ray CT system,” Ph.D. thesis, University of Wisconsin, Madison, 2010. [Google Scholar]
- Righi A., “Sui fenomeni che si producono colla sovrapposizione di due peticoli e sopra alcune loro applicazioni,” Il Nuovo Cimento 21, 203–228 (1887). 10.1007/BF02737370 [DOI] [Google Scholar]
- Qi Z. and Chen G.-H., “Direct fan-beam reconstruction algorithm via filtered backprojection for differential phase-contrast computed tomography,” X-Ray Opt. Instrum. 2008, 835172 (2008). [Google Scholar]
- Feldkamp L. A., Davis L. C., and Kress J. W., “Practical cone-beam algorithm,” J. Opt. Soc. Am. A 1, 612–619 (1984). 10.1364/JOSAA.1.000612 [DOI] [Google Scholar]
- Bevins N., Zambelli J., Qi Z., and Chen G., “X-ray dark-field computed tomography using a grating interferometer setup,” Proc. SPIE 7622, 76220P (2010). 10.1117/12.844438 [DOI] [Google Scholar]


