

Abstract
Fxyd1 encodes a trans-membrane protein that modulates Na+, K+-ATPase activity and is a substrate for multiple protein kinases. Fxyd1 expression is repressed by methyl CpG-binding protein 2 (Mecp2) in the frontal cortex (FC), but not in the cerebellum (CB) of the mouse brain. Consistent with these observations, FXYD1 mRNA abundance is increased in the FC of Rett syndrome (RTT) patients with MECP2 mutations. Because Fxyd1 is implicated in the regulation of neuronal excitability, understanding how Fxyd1 expression is controlled is an important question. Here, we report that basal expression of Fxyd1a and Fxyd1b, the two main alternatively spliced forms of Fxyd1 mRNA, is lower in the FC than in the CB. This difference is accompanied by increased Mecp2 recruitment to the promoter region of these two Fxyd1 mRNA forms. DNA methylation of both promoters is more frequent in the FC than in the CB, and in both cases the most frequently methylated CpG dinucleotides are adjacent to [A/T]4 sequences required for high-affinity Mecp2 binding. Consistent with these features of epigenetic silencing, histone 3 acetylated at lysines 9 and 14 (H3K9/14ac) and histone 3 methylated at lysine 4 (H3K4me3), both activating histone marks, were associated with the Fxyd1 promoter to a lesser degree in the FC than in the CB. These results indicate that differential Fxyd1 expression in these two brain regions is, at least in part, regulated by an epigenetic mechanism involving increased DNA methylation of the two alternative Fxyd1 promoters, enhanced Mecp2 recruitment, and reduced association of activating histones.
Keywords: Rett Syndrome, DNA methylation, histone acetylation, phospholemman
INTRODUCTION
Inactivating mutations of MECP2, the gene encoding the nuclear protein methyl-CpG binding protein 2 (MeCP2), are the primary cause of Rett syndrome (RTT), an X-linked autism spectrum disorder almost exclusively diagnosed in females (Bienvenu et al., 2000; Bienvenu and Chelly, 2006; Chahrour and Zoghbi, 2007; Wan et al., 1999). Consistent with this concept, Mecp2-null mice exhibit neurological abnormalities strikingly similar to those of RTT (Chen et al., 2001b; Guy et al., 2001; Kishi and Macklis, 2004). In brain, Mecp2 can either repress or activate transcription (Chahrour et al., 2008); when acting as a repressor, Mecp2 binds to methylated CpG dinucleotides (Nan et al., 1993) and recruits a Sin3A/histone deacetylase (HDAC) silencing complex to chromatin (Bienvenu and Chelly, 2006). The mechanisms underlying Mecp2-dependent trans-activation are not well understood (Chahrour et al., 2008); however, neuronal Mecp2 associates exclusively with methylated DNA sequences in vivo (Klose et al., 2005; Skene et al., 2010), suggesting that DNA methylation may also be required for Mecp2 trans-activating functions.
Although Mecp2 deficiency results in global changes in neuronal chromatin structure, including elevated levels of histone 3 acetylation and histone 1 (Skene et al., 2010), widespread deregulation of gene expression throughout the central nervous system is not observed in Mecp2-null mice. Instead, loss of Mecp2 appears to affect discrete subsets of genes required for mature neuronal functions (Bienvenu and Chelly, 2006; Chahrour et al., 2008; Chahrour and Zoghbi, 2007; Chang et al., 2006; Chen et al., 2003; Deng et al., 2007; Horike et al., 2005; Kriaucionis et al., 2006; Luikenhuis et al., 2004; Martinowich et al., 2003; McGill et al., 2006; Nuber et al., 2005; Peddada et al., 2006; Tudor et al., 2002).
An aspect of Mecp2 biology that has received little attention is the evidence indicating that Mecp2 may control gene expression in a region-dependent manner (Belichenko et al., 1997; Kishi and Macklis, 2005; Shahbazian et al., 2002a). Yet, the two neuromorphological hallmarks of RTT, decreased neuronal arborization and reduced numbers of dendritic spines (Armstrong et al., 1995; Armstrong et al., 1998; Belichenko et al., 1997; Belichenko and Dahlstrom, 1995) are largely restricted to selected subregions of the frontal (FC) and motor cortex (Armstrong et al., 1995; Armstrong et al., 1998; Belichenko et al., 1997; Belichenko and Dahlstrom, 1995), despite the abundance of Mecp2 throughout the brain and spinal cord (Mullaney et al., 2004; Shahbazian et al., 2002a; Tudor et al., 2002). These regional differences are also observed at the molecular level, as expression of many genes in the cerebellum (Ben-Shachar et al., 2009), and particularly the hypothalamus (Chahrour et al., 2008), is decreased, instead of increased in the absence of Mecp2.
FXYD1 is an Mecp2 target gene (Deng et al., 2007; Jordan et al., 2007) regulated by Mecp2 in a region-dependent manner (Deng et al., 2007). FXYD1 encodes phospholemman (PLM, FXYD1), a membrane protein that modulates Na+, K+-ATPase activity (Crambert et al., 2002; Feschenko et al., 2003). FXYD1 is also a major substrate for protein kinase A (PKA), protein kinase C (PKC), myotonic dystrophy protein kinase (DMPK), and never in mitosis (NIMA) kinase (Mounsey et al., 1999; Mounsey et al., 2000; Palmer et al., 1991; Presti et al., 1985; Walaas et al., 1988; Walaas et al., 1994). Although the functions of FXYD1 in the brain are not well understood, it is plausible that FXYD1 integrates cell signaling events initiated by these kinases, and that this integrative function occur in addition to its involvement as a modulator of Na+, K+-ATPase activity (Feschenko et al., 2003). FXYD1 has also been shown to be important in maintaining neuronal excitability (Garcia-Rudaz et al., 2008). Fxyd1 mRNA levels are greater in the cerebellum (CB) and lowest in the FC (Deng et al., 2007) of wild-type mice, with intermediate levels in other brain regions, indicating that basal Fxyd1 expression in brain is region-dependent. Importantly, in the absence of Mecp2, Fxyd1 mRNA levels increase in the FC, but not the CB (Deng et al., 2007), suggesting that the specific regulation of the Fxyd1 gene by Mecp2 is also region-dependent. As in mice, FXYD1 expression is increased in the FC of RTT patients (Deng et al., 2007). The molecular mechanisms underlying this region-specific difference in expression have not been identified.
Alternative splicing of the mRNA primary transcript is believed to provide a mechanism by which gene expression is differentially regulated in different cells or tissues (Graveley, 2001). The 5’ end of the Fxyd1 gene is subjected to alternative splicing events that generate at least 4 transcripts, all of which resulting from splicing of two forms of exon 1 (1a and 1b) to a full-length or 5’ truncated exon 2 (Bogaev et al., 2001). Here we report that, instead of resulting from differential Fxyd1 mRNA splicing, the FC-CB difference in Fxyd1 expression is at least in part the consequence of an epigenetic silencing mechanism involving DNA methylation, enhanced Mecp2 binding, and reduced association of activating histone marks.
MATERIALS AND METHODS
Animals and tissue collection
Heterozygous Mecp2 deficient female mice (JAX: strain B6.129P2c- Mecp2tm1.1Bird/J) were bred on C57BL/6 background and genotypes were determined as previously described (Deng et al., 2007). Mice were housed under a 12:12 h light / dark cycle (lights on at 07.00 h) and given free access to food and water. Animal usage was duly approved by the Institutional Animal Care and Use Committee of the Oregon National Primate Research Center. After inducing unconsciousness by CO2 inhalation, 3-week old male Mecp2-null mice and their wild-type (WT) littermate controls were decapitated and the FC and CB were rapidly dissected and snap frozen on dry ice. Samples were kept at -85°C until RNA extraction.
RNA extraction and qPCR
Total RNA was extracted with the RNeasy mini kit (Invitrogen, Carlsbad, CA) following the manufacturer’s instructions. To remove DNA contamination, RNA samples were treated with DNase I using a DNA-free DNase I kit (Ambion, Austin, TX). RNA concentrations were determined by spectrophotometric trace (Nanodrop, ThermoScientific, Wilmingtom, DE). Four hundred ng of total RNA were reverse transcribed using the Omni RT Kit (Qiagen, Valencia, CA) in the presence of random hexamer primers (15 μM, Invitrogen), as recommended by the manufacturer.
To determine the relative abundance of Fxyd1 mRNA (NM_019503) and its two main alternatively 5’ spliced variants, Fxyd1a and Fxyd1b (Bogaev et al., 2001) (Ensemble release 54, May 2009, Ensembl Transcript ID ENSMUST00000039909 and ENSMUST00000071697, respectively) in WT mice, we used the SYBR GreenER™ qPCR SuperMix system for ABI PRISM® instrument (Invitrogen). Primers for amplification were designed using the OligoPerfect™ Designer webtool (http://tools.invitrogen.com/content.cfm?pageid=9716). To quantify total Fxyd1 mRNA abundance we used primers targeting the Fxyd1 mRNA coding region (Table 1). To quantify Fxyd1a mRNA we used primers (Table 1) that amplify a segment comprised between nucleotide (nt) 90 in exon 1a and 165 in exon 2. The Fxyd1b primers amplify a fragment comprised between nt 71 in exon 1b and 144 in exon 2. The resulting amplicons are 76 and 74 bp in length respectively (Table 1). Real-time PCR reactions were performed in a total volume of 10 μl, each reaction containing 2 μl of diluted cDNA or 2 μl of a standard cDNA (see below), 5 μl of SYBR GreenER™ qPCR SuperMix and 3 μl of primers mix (600 nM of gene specific primers or 10 nM of 18S primers). The real-time PCR program used consisted of an initial annealing period of 2 min at 50°C, followed by 10 min of denaturing at 95°C, and 40 cycles of 15 sec at 95°C and 1 min at 60°C. To confirm the formation of a single SYBR Green-labeled PCR amplicon, the PCR reaction was followed by a three-step melting curve analysis consisting of 15 sec at 95°C, 15 sec at 60°C, and 15 sec at 95°C, as recommended by the manufacturer.
Table 1.
Primers used to amplify Fxyd1 amplicons by Real-Time PCR. Location of each primer in its respective transcript is shown in parenthesis.
| Transcript | Accession number | Forward primer | Reverse primer |
|---|---|---|---|
| Fxyd1 | NM_019503 CDS | CF, 5’-TCCATGGCCAGTGCAGAA-3’ (46-63, Exon 2) | CR, 5’-ATGAAGAGGATCCCAGCGATA-3’ (126-146, Exon 3) |
| Fxyd1a | NM_052992 | 1aF, 5’-GGGACAGCGTGAATGGGAT-3’ (90-108, Exon 1a) | 1aR, 5’-GAGTCAGCCAGGGTCAAGAA-3’ (146-165, Exon 2) |
| Fxyd1b | NM_194321 | 1bF, 5’-AGAGAGACCACTGGTTGAGATCCT-3’ (71-94, Exon 1b) | 1bR, 5’-CAGCCAGGGTCAAGAAATGT-3’ (125-144, Exon 2) |
Relative standard curves were constructed from serial dilutions of one reference sample cDNA (RT of 400ng total RNA from the CB of a wild-type mouse, serially diluted from 1/10 to 1/500). The CTs from each sample was referred to the relative curve to estimate the content of Fxyd1, Fxyd1a and Fxyd1b mRNA/sample. The values obtained were normalized for procedural losses using the content of18S rRNA/sample as the normalizing unit, and were expressed as arbitrary units (AU).
To detect differences in Fxyd1 mRNA abundance between WT and Mecp2 null mice we used the Taqman real-time PCR system. The PCR reactions were performed using an ABI Prism 7900HT Real-Time PCR system; threshold cycles (CTs) were detected by SDS 2.2.1 software (Applied Biosystems, Foster City, CA). The abundance of an Fxyd1 mRNA segment contained within the Fxyd1 coding region was quantitated by real-time PCR, as previously described (Deng et al., 2007). The primers and probe used to detect 18S rRNA were purchased as a kit (TaqMan Ribosomal RNA Control Reagents Kit, Perkin Elmer Applied Biosystems, Foster City, CA). The primers and fluorescent probe, chosen within the Fxyd1 mRNA coding region (accession number :NM_019503), were designed using Primer Express 2.0 software (Applied Biosystems). The forward and reverse primers are listed in Table 1. The internal fluorescent oligodeoxynucleotide probe sequence 5’-ACGATTACCACACCCTGCGGATCG-3’ was covalently linked to the fluorescent dye, FAM, at the 5’-end, and to the quencher dye, TAMRA, at the 3’-end (Applied Biosystems). Real-time PCR reactions were performed in a total volume of 10 μl, each reaction containing 2 μl of diluted cDNA or 2 μl of standard, 5 μl of TaqMan Universal PCR Master Mix (Applied Biosystems) and 3 μl of primers and probes mix (250 nM of mFxyd1 and 18S fluorescent probes, 300 nM of mFxyd1 primers and 10 nM of 18S primer. The real-time PCR program used consisted of an initial annealing period of 2 min at 50°C, followed by 10 min of denaturing at 95°C, and 40 cycles of 15 sec at 95°C and 1 min at 60°C.
Bisulfite Sequencing
Genomic DNA from mouse FC and CB was extracted as described (Chen et al., 2001a), and 1μg DNA from each sample was subjected to bisulfite treatment (Nagane et al., 2000). The converted DNA was used to PCR-amplify fragments of 895 and 633 bp spanning the region containing either exon 1a or 1b of the Fxyd1 gene, respectively, using PuReTaq Ready-To-Go PCR beads (GE Healthcare, Piscataway, NJ)., We used two sequential PCR reactions for each amplification, one with a set of external primers, and another with nested primers (Table 2A). The PCR conditions were 5 min at 94°C, 40 cycles of 1 min at 94°C, 1 min at the indicated annealing temperatures (Table 2A), 1min at 72°C, and a final extension of 10 min at 72°C. The PCR products were gel purified and cloned into pGEM-T Easy vector (Promega, Madison, WI). For each DNA fragment, plasmids DNA from at least 12 clones were purified and sequenced.
Table 2.
A: List of primers used for bisulfite sequencing and pyrosequencing.
| Forward primer | Reverse primer | Annealing °C |
|---|---|---|
| 5’-tggtagaatattgggttagagg-3’ (-474a to -453a) | 5’-tacacacacacacacaaaat-3’ (-315b to -334b) | 52 |
| 5’-gaaagtatttaggttgtgtg-3’ (-441a to -418a) | 5’-caaaaacaaacaacaccctc-3’ (-349b to -368b) | 58 |
| 5’-ggggagagggtgttgtttgtt-3’ (-373b to -347b) | 5’-ttcacccaaaaccatatccc-3’ (+344b to +325b) | 58 |
| 5’-ttgtgtgtgtgtgtgtattttg-3’ (-331b to -312b) | 5’- ccaaaaaaccacaacatacac-3’ (+302b to +282b) | 58 |
| 5’-agtttttggggggggagt-3’ (-71b to -54b) | 5’- biotin-ccacctacccctacacacctca-3’ (+107b to +86b) | 62 |
|
| ||
| B: List of primers used for PCR on ChIP.
| ||
| Forward primer | Reverse primer | Annealing °C |
|
| ||
| 5’-tggcagaacactgggtcagagg-3’ (-474a to -453a) | 5’-gctccacccccgcaggctcc-3’ (+8a to -12a) | 70 |
| 5’-catgctgctcctgggactgtgct-3’ (-162a to -140a) | 5’-tctctaactctcccgcccctgtgc-3’ (+268a to +245a) | 70 |
| 5’-tggcagaacactgggtcagagg-3’ (-474a to -453a) | 5’-ctggactatgagaggacaca-3’ (-177a to -196a) | 58 |
| 5’-gggggtgaggctcagatactcat-3’ (-495b to -473b) | 5’-tctctctgtacccaggccgt-3’ (+77b to +58b) | 62 |
| 5’-gggggtgaggctcagatactcat-3’ (-495b to -473b) | 5’-ctttcacaacaagactttagg-3’ (-206b to -226b) | 56 |
| 5’-tgtagggatgtggctcctggct-3’ (-130b to -108b) | 5’-tctctctgtacccaggccgt-3’ (+77b to +58b) | 68 |
| 5’-tgtagggatgtggctcctggct-3’ (-130b to -108b) | 5’-aggaatttgctgcacacggg-3’ (-20b to -39b) | 68 |
Location of each primer is indicated respectively to the TSS and is shown in parenthesis.
Pyrosequencing
Genomic DNA was isolated from the FC and CB of 4 adult mice as recommended (Chen et al., 2001a). DNA was treated with bisulfite and was purified as described previously (Deng et al., 2007; Nagane et al., 2000). Bisulfite-treated genomic DNA was subjected to a first round of PCR using a set of primers amplifying a segment between nucleotides (nt) -373 and +344 in Fxyd1b (TSS =+1) followed by a nested PCR using a forward primer (-71b to -54b) and a biotinylated reverse primer (nt +107 to +86) (Table 2A). PCR conditions with PuReTaq Ready-To- Go PCR beads (GE Healthcare, Piscataway, NJ) were: 5 min at 94°C, 40 cycles of 40 sec at 94°C, 1 min at the indicated annealing temperature (Table 2A), 1 min at 72°C and a final extension period of 10 min at 72°C. An aliquot of each PCR product was gel-analyzed and the remaining DNA was used for pyrosequencing using a forward primer (nt -60 to -44; 5’-GGGGAGTTGTTGTTATG-3’. The pyrosequencing was performed by EpigenDX, Inc (Worcester, MA).
Chromatin Immunoprecipitation (ChIP) Assays
ChIP assays for Mecp2
These assays were performed as previously described (Deng et al., 2007). Samples of FC and CB were dissected and minced to small pieces, before incubating them in 1% formaldehyde/DMEM for 10 min at 37°C. The medium was removed and the tissues were washed three times with ice-cold PBS containing a protease inhibitor cocktail (Sigma-Aldrich, St Louis, MO) and the histone deacetylase inhibitor sodium butyrate (20 mM, Sigma-Aldrich).
Chromatin was sheared to generate fragments of <400 bp or <800 bp (depending on the fragments targeted in the assay) using the Enzymatic shearing Kit and protocol from Active Motif (Carlsbad, CA); ChIP assays were performed using the chromatin Immunoprecipitation (ChIP) assay protocol from Millipore (Billerica, MA). For pre-clearing and pull down we used Protein A Sepharose (GE Healthcare, Piscataway, NJ) pre-blocked with yeast tRNA and BSA. The antibody used is a rabbit polyclonal anti-Mecp2 from Millipore (Temecula, CA) and for the control a rabbit IgG from Santa Cruz Biotechnology (Santa Cruz, CA).
To analyze the association of Mecp2 to the Fxyd1a and Fxyd1b promoters we performed three series of experiments. In the first series, we targeted a 482 bp segment of the Fxyd1a 5’-flanking region using a forward primer corresponding to nt -474 to -453 with regard to the first nucleotide in exon 1a (considered as +1), and a reverse primer complementary to nt +8 to -12 (Table 2B). We also amplified a 572 bp segment of the Fxyd1b promoter, using a forward primer corresponding to nt -495 to -473 with respect to the first nucleotide of exon 1b (+1) and a reverse primer complementary to nt +77 to +58 (Table 2B). Because the Fxyd1a 5’-flanking region has four methylated CpG dinucleotides (-170, -119, -92 and -4) and the Fxyd1b 5’- flanking region has only two (-37 and -17) we performed a second series of ChIP assays in which we amplified segments comprising a region closer to each TSS that also included part of exon 1a and 1b, respectively. For the Fxyd1a promoter we utilized primers (Table 2B) that amplify a segment of 430 bp comprised between nt -162a and +268a and for the Fxyd1b promoter, the amplified fragment extended from -130b to +77b. Finally, after determining by pyrosequencing that one of the two CpG dinucleotides in the Fxyd1b promoter is preferentially methylated in the FC as compared to the CB, we performed a third series of Mecp2 ChIP assays, utilizing a primer set (Table 2B) that amplifies a 110 bp segment comprised between nt -130b and -20b in the Fxyd1b promoter.
In addition to the standard IgG control for these ChIP assays, we included two other controls. One of them consisted of analyzing an area upstream of Fxyd1a (-474 to -177) that is devoid of methylated CpGs. The other control analyzed a region upstream of Fxyd1b (-495 to -206) that is methylated, but shows no FC-CB differences in methylation status. The primers used for these reactions are listed in Table 2B.
All PCR amplifications were performed using Promega GoTaq polymerase (Promega, Madison, WI). The PCR conditions employed were: 94°C for 4 min followed by 37 cycles of 30 sec at 94°C, 30 sec at annealing temperature (indicated in table 2B) 40 sec at 72°C and a final extension of 5 min at 72°C.
ChIP assays for modified histone 3
The samples were processed as described above and the immunoprecipitations were performed using the following antibodies: rabbit polyclonal anti-H3K9/14ac from Millipore (Temecula, CA), rabbit monoclonal anti-H3K4me3, and rabbit monoclonal anti-H3K27me3 from Cell Signaling (Boston, MA), in addition to rabbit IgG from Santa Cruz (Santa Cruz, CA). A 110 bp segment comprised between nt -130b and -20b in the Fxyd1b promoter was PCR amplified using the primers and conditions described above for the third series of Mecp2 ChIP assays. For all ChIP assays, the PCR products were separated in 1%-agarose gels stained with ethidium bromide; following image capturing, the digitized images were scanned and the relative intensity of the bands was analyzed using NIH ImageJ software, and expressed as arbitrary units (AU) according to the formula: AU = (IP-IgG) / Input, where IP is DNA immunoprecipitated with specific antibodies against Mecp2 or modified histones, and IgG is DNA immunoprecipitated with non-specific IgGs.
Statistics
Before specific analyses were performed, the data were subjected to a normality test. Data passing this test were then analyzed using the 2-tailed Student’s t test to assess differences between 2 groups of animals or independent observations. A p value of <0.05 was considered statistically significant.
RESULTS
Fxyd1 mRNA abundance differs markedly between two structurally and functionally distinct mouse brain regions
Because the 5’-end of the mFxyd1 gene is subjected to alternative splicing (Bogaev et al., 2001), a region-dependent use of these alternative spliced transcripts could contribute to the FC-CB differences in Fxyd1 expression previously reported (Deng et al., 2007; Feschenko et al., 2003). In mice, alternative splicing of the primary Fxyd1 mRNA transcript results in two different forms of exon 1, termed 1a and 1b [(Bogaev et al., 2001) and Ensemble release 54, May 2009]. Similar splicing events occur at the 5’-end of the human gene. When transcribed, the exon termed 1a maps to the 5’ foremost region of the gene; the other, termed 1b (Bogaev et al., 2001), is located downstream from 1a (Fig. 1A). To verify our previous findings, and to determine the pattern of expression of these exon 1 isoforms, we performed quantitative PCR experiments using sets of primers (Fig. 1A, Table 1) that amplify either the mFxyd1 mRNA coding region (Deng et al., 2007), or each of the two main alternatively spliced forms of exon 1. In agreement with our previous findings, the abundance of the common mFxyd1 mRNA was markedly (p<0.001) lower in the FC than in the CB of wild-type mice (Fig. 1B). Although Fxyd1a and Fxyd1b transcripts were detected in both the FC and CB, they were more abundant in the CB (Fig. 1C,D, p<0.05-p<0.01, respectively). This difference was greater for Fxyd1b mRNA (Fig. 1D) than for Fxyd1a mRNA (Fig. 1C; 5-and 2-fold difference, respectively). Consistent with our previous findings (Deng et al., 2007), mFxyd1 mRNA levels were significantly increased in the FC, but not the CB, of Mecp2-null mice compared to their WT littermate controls (Fig. 1E).
Figure 1. Fxyd1 mRNA abundance is greater in the FC than the CB of mice, and increase in the FC, but not the CB of Mecp2-null mice.
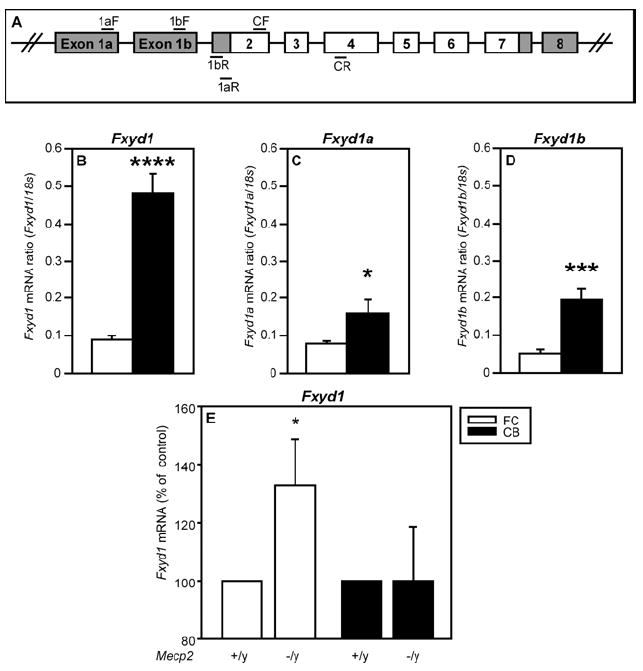
A, Diagram showing the organization of the Fxyd1 gene with exons and introns represented by boxes and lines, respectively. Primers used for qPCR are shown by horizontal bars (aF, bF = exon 1a or 1b forward; aR, bR = exon 1a or 1b reverse; CF = coding region forward; CR = coding region reverse). Panels B-D compare Fxyd1 mRNA levels detected in the FC and CB of WT mice; panel E shows the change in Fxyd1 mRNA content seen in the FC and CB of Mecp2 KO mice in comparison to WT animals. B, Fxyd1 mRNA (coding region). C, Fxyd1a mRNA. D, Fxyd1b mRNA. E, Fxyd1 mRNA levels increase in the FC, but not the CB, of Mecp2-/y mice as compared with Mecp2+/y littermates. Bars are means and vertical lines represent SEM. The number of animals per group is n=6 for 1B-D and n=9 for 1E. B-D, *=p<0.05; ***=p<0.001, FC vs CB. E, *=p<0.05 Mecp2-/y vs. control littermates (Mecp2+/y).
The 5’-flanking region of both Fxyd1a and Fxyd1b is methylated in the FC and CB
To determine if this FC-CB difference in gene expression is related to a different DNA methylation pattern of the Fxyd1 gene in these two brain regions, we performed a bisulfite sequencing analysis. We observed that in both FC and CB there are four methylated CpGs within 170 bp upstream from Fxyd1a, and six methylated CpG within 422 bp of Fxyd1b (Fig. 2A). No methylated CpGs were detected in the sequence immediately upstream from these regions (between nt -441 and -170 in Fxyd1a and between exon 1a and -422 in Fxyd1b). The frequency of methylation appeared to be greater in the FC than in the CB at CpG sites located at position -170, -119, and -92 from the TSS of Fxyd1a (Fig. 2B and C). The methylation pattern of the Fxyd1b promoter was less well-defined. Four sites (-422, -393, -290, and -243 were similarly methylated in the FC and CB, and two sites (-37 and -17) showed FC-CB differences in methylation frequency. These differences were opposite for each site and of small magnitude (4 of 12 CB clones, and 2 of 12 FC clones for site -37; 1 of 12 CB clones and 4 of 12 FC clones for site -17 (Fig. 2B,C).
Figure 2. Bisulfite sequencing of the 5’-flanking regions of exon 1a and 1b of Fxyd1.
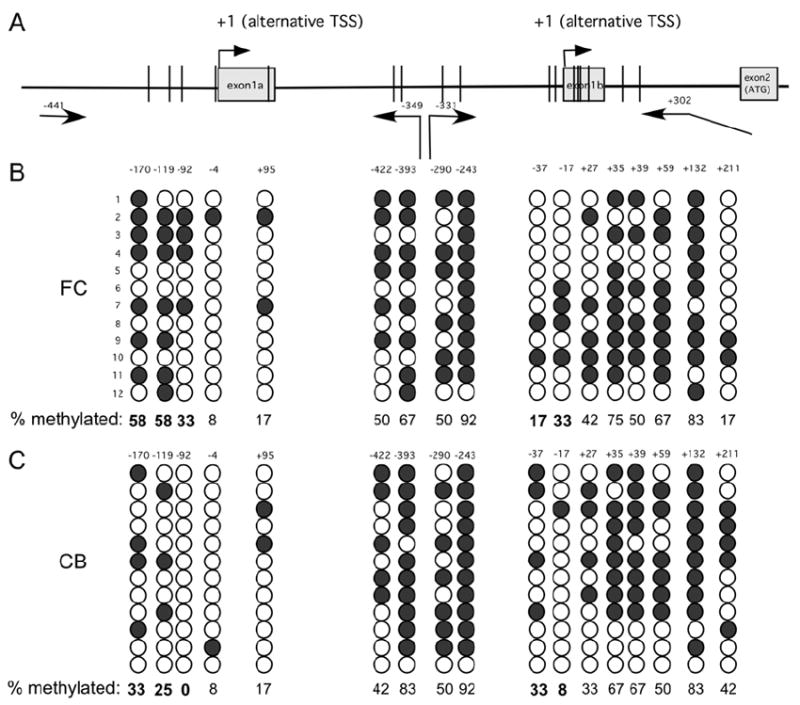
A, Diagram of the 5’-flanking region of Fxyd1a and Fxyd1b showing the approximate location of methylated CpGs (represented by vertical bars). The positions of the primers used for nested PCR are depicted by arrows and numbers. B, Representation of the methylation pattern detected in twelve clones derived from the FC. C, Twelve clones derived from the CB. Open circles = unmethylated CpGs; filled circles = methylated CpGs. The position of each CpG is shown on top of the columns of circles and the frequency of methylated CpGs is shown below as percentage.
Mecp2 is preferentially recruited to the Fxyd1a and Fxyd1b promoters in the FC
To determine if FC-CB differences in Fxyd1a and Fxyd1b expression and in DNA methylation are accompanied by differential recruitment of Mecp2 to the 5’-flanking region of these transcripts, we performed ChIP assays utilizing primers specific for either splice variant (Fig. 3A). We found that Mecp2 recruitment to a broad region located directly upstream from the TSS of Fxyd1a (-474 to +8) is markedly greater in the FC than in the CB (Fig. 3B). When a downstream region of Fxyd1a containing the complete exon 1a and part of the first intron, in addition to 162 bp of the 5’flanking region was analyzed, the FC-CB difference was no longer seen (Fig. 3C), suggesting that Mecp2 binding to DNA segments that include a substantial portion of the gene body, while measurable, is not brain region-dependent. ChIP assays targeting an unmethylated region (-474 to -177) upstream from the methylated region in the Fxyd1a promoter showed negligible Mecp2 binding in both the FC and the CB (Fig. 3D). Targeting either a broad region (-495 to +77) that includes the TSS of Fxyd1b or a narrower segment (-130 to +77) demonstrated that Mecp2 binding to the Fxyd1b promoter is markedly greater in the FC than in the CB (Fig. 3E and F, respectively). ChIP analysis of a region located between -495 and -206 upstream from Fxyd1b that is similarly methylated in the FC and CB demonstrated negligible Mecp2 binding (Fig. 3G). These results indicate that the FC-CB difference in Fxyd1a and Fxyd1b expression is related to a brain region-dependent difference in Mecp2 binding.
Figure 3. ChIP assays showing Mecp2 recruitment to the Fxyd1a and Fxyd1b promoter regions in the FC and CB.

A, Diagram showing the location of methylated CpGs (vertical bars) and the fragments amplified by PCR of DNA immunoprecipitated by Mecp2 antibodies (horizontal lines labeled B-G). Primers used for each PCR reaction are indicated by horizontal arrows and numbers below the arrows refer to the location of each primer in the gene relative to the TSS (+1) in either exon 1a or exon 1b. The sequence and location of [A/T]>4 motifs are shown inside boxes on top of the gene diagram. B, Mecp2 binding to a broad region of the Fxyd1a promoter is higher in the FC than in the CB. C, Association of Mecp2 to a region (nt - 162a to +268a) that, in addition to the proximal Fxyd1a promoter, includes the entire Fxyd1a exon and part of the first intron is similar between the FC and CB. D, Mecp2 recruitment to an unmethylated region upstream from the proximal Fxyd1a promoter is negligible in both the FC and CB. E, Mecp2 binding to a broad region of the promoter of Fxyd1b is substantially greater in the FC than in the CB. F, Mecp2 binding to a region near the TSS of Fxyd1b is also greater in the FC than in the CB. G, Mecp2 does not bind to methylated CpGs located upstream from the Fxyd1b proximal promoter (nt -422 to -243), that shows a methylation frequency similar in the FC and CB. Columns represent the mean of 3-5 ChIP assays, and vertical lines are SEM. * = p<0.05 vs. FC.
Because bisulfite sequencing of the proximal Fxyd1b promoter revealed small and inconsistent differences in methylation frequency (Fig. 2), and yet Mecp2 binds differentially to this region in the FC (Fig. 3), we used pyrosequencing to quantitatively analyze the methylation status of the CpGs within the fragment -130b to +77b. The results show (Fig. 4A,B) an increased frequency of methylation at one of the sites (CpG -37) with a 2.6 fold greater in the FC than in the CB (Fig. 4B), suggesting that increased methylation at this site contributes to the lower Fxyd1b expression observed in the FC than in the CB.
Figure 4. Pyrosequencing analysis of CpG sites in the Fxyd1b promoter and ChIP analysis of Mecp2 binding to the region containing CpG-37 in this promoter.
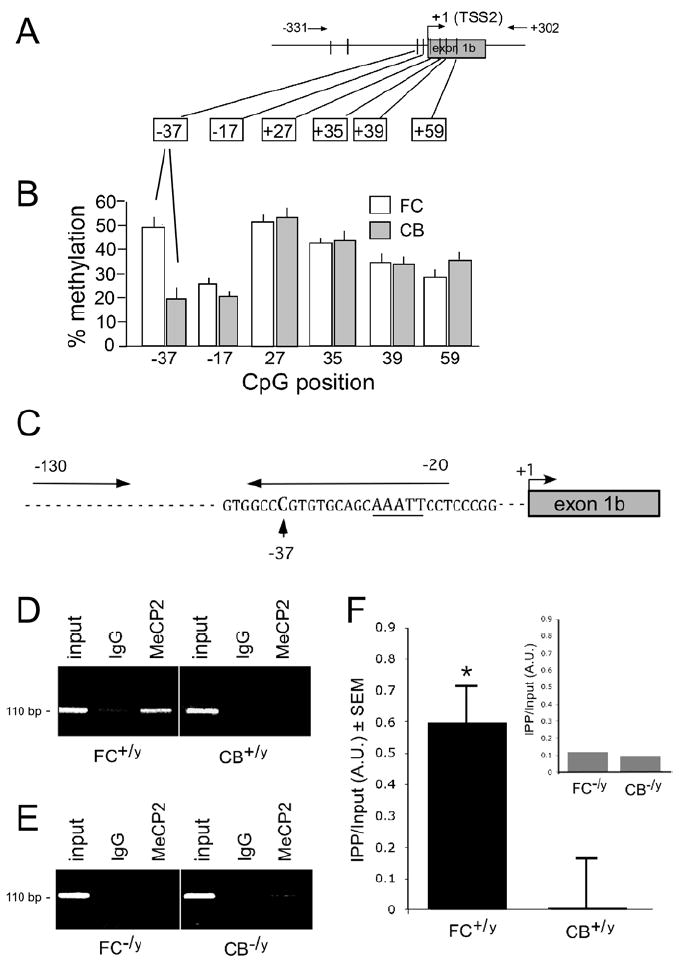
A, Methylated CpG dinucleotides in the 5’-flanking region of Fxyd1b detected by bisulfite sequencing. Methylated sites are represented by vertical bars. The positions of the primers used for the first round of DNA amplification are depicted by numbers on top of diagram; horizontal arrows indicate direction of the PCR amplification. B, Among the six CpG sites analyzed by pyrosequencing (positions shown in boxes, relative to the TSS), only the CpG at - 37 upstream of exon 1b demonstrated a consistently higher frequency of methylation in the FC than in the CB. The percent methylation (Y-axis) is shown for the 6 CpG sites analyzed and their position relative to TSS is shown on the X-axis. C, Primers used to amplify the DNA segment containing CpG -37 after ChIP assay of associated Mecp2. D, ChIP analysis using chromatin from the FC or CB of wild type mice (FC+/yand CB+/y, respectively) and either a rabbit anti-Mecp2 antibody (Mecp2) or normal rabbit IgG (IgG). Note that endogenous Mecp2 associates with this region of the Fxyd1b promoter in the FC but not in the CB. E, No Mecp2 binding is detected in either the FC or CB of Mecp2 null mice (FC-/yand CB-/y). F, Quantification of the results illustrated in D. Inset, Lack of Mecp2 binding to the -37 region in the FC and CB of Mecp2-null mice. The data are from 4 separate experiments and are presented as mean ± SEM.
We then determined if increased methylation at CpG -37 in the mFxyd1b promoter results in greater Mecp2 recruitment to this DNA segment in the FC as compared with CB. ChIP analyses (Fig. 4C) showed that Mecp2 interacts with this segment in the FC but not in the CB (Fig. 4D,F). No Mecp2 interactions were observed in chromatin isolated from Mecp2-null mice (Fig. 4E,F), confirming the specificity of our ChIP assays. These data demonstrate that Mecp2 interacts with a single methylated CpG dinucleotide in the mFxyd1b promoter that is more frequently methylated in the FC than in the CB.
Association of H3K9/14ac and H3K4me3, two activating histone marks, with the Fxyd1b promoter is lower in the FC than in the CB
In addition to DNA methylation, epigenetic information is conveyed via chromatin alterations consisting of posttranslational modifications that alter the N-terminus tails of the so-called core histones (H2A, H2B, H3, and H4) in nucleosomes (Khorasanizadeh, 2004; Kouzarides, 2007). While acetylation is consistently associated with activation of transcription (Dillon, 2006; Kouzarides, 2007), histones methylated at specific lysine residues regulate promoter activity in opposite ways, either repressing or activating transcription. Methylation of H3 at lysine 4 (H3K4me3) is commonly associated with activation of gene transcription (Guttman et al., 2009; Ruthenburg et al., 2007; Wang et al., 2008). Conversely, the most common histone modifications associated with transcriptional repression are trimethylation of H3 at lysine 9 and 27 (H3K9me3 and H3K27me3); these modifications are considered to be a hallmark feature of silenced genes (Guttman et al., 2009; Ruthenburg et al., 2007; Wang et al., 2008). We chose the Fxyd1b promoter (Fig. 5A) to determine if a FC-CB difference in Fxyd1 expression is related to a different complement of H3 marks. While no differences in H3K27me3 association were detected between the FC and the CB (Fig. 5B), a lower (p<0.05) abundance of H3K9/14ac (Fig. 5C), and especially H3K4me3 (p<0.01) (Fig. D), was observed in the FC than in the CB. These results suggest that decreased association of two activating histone marks with the Fxyd1b promoter in the FC contributes to decreasing Fxyd1b expression in the FC as compared to the CB.
Figure 5. Association of modified histones involved in gene activation or silencing to the Fxyd1b promoter in the FC and CB of WT mice.
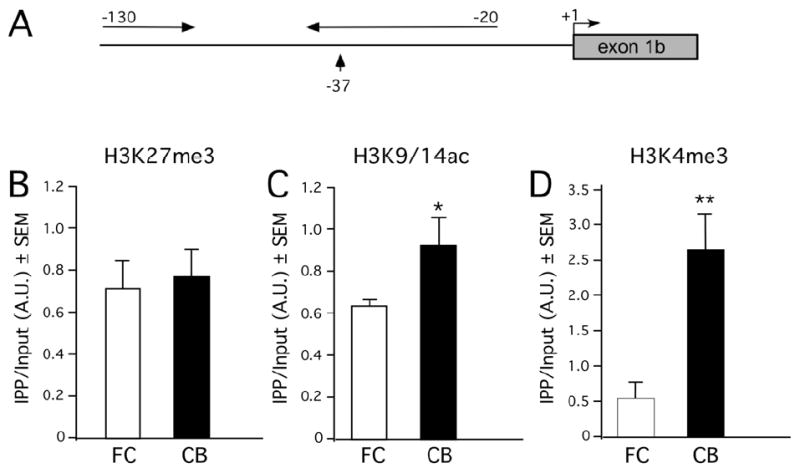
A, Diagram showing the region of the Fxyd1b promoter targeted for PCR amplification of ChIP DNA-H3 complexes. B, Association of H3K27me3, a histone mark involved in gene repression, is similar in the FC and CB. C, Association of H3K9/14ac, a hallmark of gene activation, is lower in the FC than in the CB. D, Association of H3K4me3, an activating mark, is substantially lower in the FC than in the CB. Each bar is the mean of 4-5 independent ChIP assays. * = p<0.05 and ** = p<0.01 vs. CB.
DISCUSSION
The present study demonstrates a large difference in Fxyd1 mRNA abundance between two regions of the mouse brain, with Fxyd1 mRNA levels being several-fold lower in the FC than in the CB. This regional difference in Fxyd1 expression is consistent with earlier reports by two different groups detecting the FXYD1 protein by immunohistochemistry (Feschenko et al., 2003) or western blots (Deng et al., 2007), and the Fxyd1 mRNA coding region by real-time PCR (Deng et al., 2007).
Although different brain regions may use exclusively a given alternative spliced mRNA for regulatory diversity (Graveley, 2001; Kriventseva et al., 2003), our results show the presence of both Fxyd1a and Fxyd1b transcripts, the major alternatively spliced forms of Fxyd1 mRNA, in the FC as well as the CB. This feature notwithstanding, our results also demonstrate that the abundance of both transcripts is lower in the FC than in the CB, and that this difference is greater in the case of Fxyd1b mRNA.
Analyzing the 5’-flanking region of both transcripts by bisulfite sequencing demonstrated the presence of four methylated CpG dinucleotides within 170 bp upstream of Fxyd1a, and showed that three of these four sites are more frequently methylated in the FC than in the CB. The methylation status of the Fxyd1b promoter was more complex in that there were six methylated sites, four between -423 and -242 bp from the TSS and two very near the TSS (-37 and -17). However, only one of the two proximal sites appeared to be significantly differentially methylated in the FC and CB as revealed by pyrosequencing analysis. This methylation pattern, and the greater Mecp2 association to both the Fxyd1a and Fxyd1b promoters in the FC than in the CB, suggests that the lower levels of Fxyd1a and Fxyd1b transcripts in the FC than in the CB are, at least in part, related to a region-specific difference in Mecp2 recruitment. It is interesting to note that none of the CpG sites within exon 1b itself is differentially methylated in the FC vs. the CB. In contrast, such a difference is observed for sites -37 and -17. Because these two sites are only 20 bp apart from each other, it is possible that their methylation frequency varies according to physiological conditions, with at least one of them being always more methylated in the FC than in the CB. This interpretation is consistent with the binding characteristics of Mecp2 (Nan et al., 1993). Although Mecp2 is able to bind only one methylated CpG, recruitment of an additional Mecp2 molecule to form a ternary complex with DNA (and therefore a stronger ability to mediate the physiological effects of DNA methylation) requires that the methylated CpGs be located at least 12 bp apart (Nan et al., 1993).
An additional factor that may contributes to strengthening the Mecp2 association to more frequently methylated CpGs in the proximal Fxyd1a and Fxyd1b promoters is the presence of [A/T]>4 motifs in both cases. One of these motifs is located at -110 from the TSS of Fxyd1a, i.e. between the sites at -119 and -92, which are more frequently methylated in the FC than in the CB. In the case of Fxyd1b, there are two A/T runs (-24 and -2) flanking CpG -17 and -37. Mecp2 binds most efficiently to methylated CpG sites that are within a DNA segment containing a run of A/T bases (Klose et al., 2005); high affinity Mecp2 binding is achieved when the A/T run is more than 4 base pairs in length and is located six to nine base pairs from the methylated site (Klose et al., 2005), as is the case of site -119 in Fxyd1a and -37 in Fxyd1b. These observations suggest that the reduced Fxyd1 mRNA levels seen in the FC as compared to the CB are at least in part related to a greater ability of Mecp2 to recognize more frequently methylated CpGs in the FC, and thus to repress Fxyd1b (and 1a) transcription more efficiently. In a more general sense, our findings are consistent with the concept that methylation-dependent silencing of gene transcription requires methylation of critical sites instead of a more general threshold level of promoter methylation (Chen et al., 2001a).
In an earlier publication, we reported that Fxyd1 was overexpressed in the FC of both RTT patients and Mecp2-null mice (Deng et al., 2007). We further showed, using both real-time PCR and western blots that this deregulation does not occur in the CB. Though confirming our finding showing that Fxyd1 is a Mecp2 target gene, a subsequent study by another group did not see this regional difference (Jordan et al., 2007). Instead of detecting an increased Fxyd1 expression in the FC, these authors found that this deregulation occurred exclusively in the CB. We have now repeated our experiments, using new animals and measuring – as in the original report – Fxyd1 mRNA abundance in Fxyd1-null mice and their WT littermates. Though discrete, as normally seen for genes changing expression in Mecp2-deficient mice (Chahrour et al., 2008; Jordan et al., 2007), we again observed an increase in Fxyd1 mRNA abundance in the FC but not in the CB. We do not have a clear explanation for the different results of Jordan et al (Jordan et al., 2007), but it is possible that the difference is due to the experimental design employed, as we compared each KO animal to a WT littermate.
Although DNA methylation represents a major mechanism of epigenetic regulation, it is also clear that DNA methylation and histone modifications work in concert to regulate gene expression (Cameron et al., 1999; Cedar and Bergman, 2009). While DNA methylation is invariably associated with gene silencing (Bernstein et al., 2007; Bjornsson et al., 2004; Jaenisch and Bird, 2003), H3 acetylation is a typical feature of active genes (Guttman et al., 2009; Koch et al., 2007; Kouzarides, 2007), and is reduced by Mecp2 recruitment to DNA (Skene et al., 2010). Conversely, histone deacetylation is a hallmark of gene silencing (Dillon, 2006; Kouzarides, 2007). H3 trimethylation at lysine 4 (H3K4me3), a feature of active genes (Berger, 2007; Guttman et al., 2009; Wang et al., 2008), inhibits DNA methylation by hampering the access of DNMTs to DNA (Ooi et al., 2007), while H3K9me2/3, a histone modification consistently associated with gene repression (Guttman et al., 2009; Ruthenburg et al., 2007; Wang et al., 2008), facilitates DNMT3a and b recruitment to target genes (Cedar and Bergman, 2009). In the present study, we chose to study some of these associations using the Fxyd1b promoter. This choice was based on several considerations, including the findings that FC-CB differences in Fxyd1b expression are more pronounced than those for Fxyd1a mRNA, that an FC-CB differential DNA methylation status is limited to two CpGs, and that FC-CB differences in Mecp2 binding to the Fxyd1b promoter can be mapped to a discrete region immediately upstream from the TSS. Our results show that association of the activating histone marks, H3K9/14ac and H3K4me3, to the Fxyd1b promoter is lower in the FC than in the CB. The reduced H3K9/14ac association may be, at least in part, a consequence of preferential Mecp2 recruitment to the Fxyd1b promoter in the FC as compared to the CB, because acetylated H3 levels in brain are negatively regulated by Mecp2 (Shahbazian et al., 2002b; Skene et al., 2010). It is, therefore, likely that reduced H3K9/14ac and H3K4me3 association to the Fxyd1 promoters, along with an increased frequency of DNA methylation at specific CpG dinucleotides, contributes to the lower expression of Fxyd1a and Fxyd1b transcripts seen in the FC than in the CB of the mouse brain. It also seems likely that this lower Fxyd1 expression in the FC ultimately results from reduced recruitment of trans-activating factors to the promoter epigenetically tagged for silencing.
We did not detect an FC-CB difference in association of H3K27me3, a bona fide feature of gene silencing (Kouzarides, 2007; Lee and Mahadevan, 2009; Wang et al., 2008), to the Fxyd1b promoter. Because methylation of H3 at K27 is catalyzed by proteins of the Polycomb silencing complex (Schwartz and Pirrotta, 2007), this result suggests that Fxyd1b expression is not under PcG repressive control. Yet, it must be kept in mind that although the promoter region of silenced genes almost invariably contains H3K27me3 (Lee and Mahadevan, 2009; Mikkelsen et al., 2007), DNA domains associated with H3K27me3 may span large regions of the genome in addition to promoter regions (Lee and Mahadevan, 2009). It is, therefore, formally possible that FC-CB differences in H3K27me3 association to other regions of the Fxyd1 gene may exist.
It is possible that the composition and implementation of these epigenetic modifications are ultimately determined by changes in neuronal activity. Consistent with this idea, Mecp2 has been shown to regulate expression of BDNF in an activity-dependent manner (Martinowich et al., 2003), and DNA methylation has been found to be a dynamic process endowed with a previously unsuspected degree of plasticity. Rapid changes in DNA methylation can transiently modify gene expression within hours (Miller and Sweatt, 2007), and even minutes (Kangaspeska et al., 2008; Metivier et al., 2008).
Collectively, our results show the involvement of epigenetic mechanisms in the manifestation of brain region-specific differences in Fxyd1 expression. These data raise the possibility that previously recognized regional differences in the deleterious effect of Mecp2 deficiency (Armstrong et al., 1995; Armstrong et al., 1998; Belichenko et al., 2008; Belichenko et al., 1997; Belichenko and Dahlstrom, 1995; Fukuda et al., 2005; Matarazzo and Ronnett, 2004) may be related to differential patterns of DNA methylation and histone modifications regulating the activity of Mecp2 target genes.
Acknowledgments
Funding: This work was supported by the Northwest Rett Syndrome Foundation (S.R.O.); International Rett Syndrome Association, IRSA20808 (S.R.O.); National Institutes of Health, HD018185 (S.R.O.) and RR000163 (L.S. and S.R.O.); International Rett Syndrome Foundation, IRSF (V.M.); and the Christopher Reeves Paralysis Foundation (L.S.).
Footnotes
Conflict of interest statement. None declared.
References
- Armstrong D, Dunn JK, Antalffy B, Trivedi R. Selective dendritic alterations in the cortex of Rett syndrome. J Neuropathol Exp Neurol. 1995;54:195–201. doi: 10.1097/00005072-199503000-00006. [DOI] [PubMed] [Google Scholar]
- Armstrong DD, Dunn K, Antalffy B. Decreased dendritic branching in frontal, motor and limbic cortex in Rett syndrome compared with trisomy 21. J Neuropathol Exp Neurol. 1998;57:1013–1017. doi: 10.1097/00005072-199811000-00003. [DOI] [PubMed] [Google Scholar]
- Belichenko NP, Belichenko PV, Li HH, Mobley WC, Francke U. Comparative study of brain morphology in Mecp2 mutant mouse models of Rett syndrome. J Comp Neurol. 2008;508:184–195. doi: 10.1002/cne.21673. [DOI] [PubMed] [Google Scholar]
- Belichenko PV, Dahlstrom A. Studies on the 3-dimensional architecture of dendritic spines and varicosities in human cortex by confocal laser scanning microscopy and Lucifer yellow microinjections. J Neurosci Methods. 1995;57:55–61. doi: 10.1016/0165-0270(94)00125-z. [DOI] [PubMed] [Google Scholar]
- Belichenko PV, Hagberg B, Dahlstrom A. Morphological study of neocortical areas in Rett syndrome. Acta Neuropathol (Berl) 1997;93:50–61. doi: 10.1007/s004010050582. [DOI] [PubMed] [Google Scholar]
- Ben-Shachar S, Chahrour M, Thaller C, Shaw CA, Zoghbi Y. Mouse models of MeCP2 disorders share gene expression changes in the cerebellum and hypothalamus. Hum Mol Genet. 2009;18:2431–2442. doi: 10.1093/hmg/ddp181. [DOI] [PMC free article] [PubMed] [Google Scholar]
- Berger SL. The complex language of chromatin regulation during transcription. Nature. 2007;447:407–412. doi: 10.1038/nature05915. [DOI] [PubMed] [Google Scholar]
- Bernstein BE, Meissner A, Lander ES. The mammalian epigenome. Cell. 2007;128:669–681. doi: 10.1016/j.cell.2007.01.033. [DOI] [PubMed] [Google Scholar]
- Bienvenu T, Carrié A, de Roux N, Vinet M-C, Jonveaux P, Cuvert P, Villard L, Arzimanoglou A, Beldjord C, Fontes M, Tardieu M, Chelly J. MECP2 mutations account for most cases of typical forms of Rett syndrome. Hum Mol Genet. 2000;9:1377–1384. doi: 10.1093/hmg/9.9.1377. [DOI] [PubMed] [Google Scholar]
- Bienvenu T, Chelly J. Molecular genetics of Rett syndrome: When DNA methylation goes unrecognized. Nat Rev Genet. 2006;7:415–426. doi: 10.1038/nrg1878. [DOI] [PubMed] [Google Scholar]
- Bjornsson HT, Fallin MD, Feinberg AP. An integrated epigenetic and genetic approach to common human disease. Trends Genet. 2004;20:350–358. doi: 10.1016/j.tig.2004.06.009. [DOI] [PubMed] [Google Scholar]
- Bogaev RC, Jia LG, Kobayashi YM, Palmer CJ, Mounsey JP, Moorman JR, Jones LR, Tucker AL. Gene structure and expression of phospholemman in mouse. Gene. 2001;271:69–79. doi: 10.1016/s0378-1119(01)00497-8. [DOI] [PubMed] [Google Scholar]
- Cameron EE, Bachman KE, Myohanen S, Herman JG, Baylin SB. Synergy of demethylation and histone deacetylase inhibition in the re-expression of genes silenced in cancer. Nat Genet. 1999;21:103–107. doi: 10.1038/5047. [DOI] [PubMed] [Google Scholar]
- Cedar H, Bergman Y. Linking DNA methylation and histone modification: patterns and paradigms. Nat Rev Genet. 2009;10:295–304. doi: 10.1038/nrg2540. [DOI] [PubMed] [Google Scholar]
- Chahrour M, Jung SY, Shaw C, Zhou X, Wong ST, Qin J, Zoghbi HY. MeCP2, a key contributor to neurological disease, activates and represses transcription. Science. 2008;320:1224–1229. doi: 10.1126/science.1153252. [DOI] [PMC free article] [PubMed] [Google Scholar]
- Chahrour M, Zoghbi HY. The story of Rett syndrome: from clinic to neurobiology. Neuron. 2007;56:422–437. doi: 10.1016/j.neuron.2007.10.001. [DOI] [PubMed] [Google Scholar]
- Chang Q, Khare G, Dani V, Nelson S, Jaenisch R. The disease progression of Mecp2 mutant mice is affected by the level of BDNF expression. Neuron. 2006;49:341–348. doi: 10.1016/j.neuron.2005.12.027. [DOI] [PubMed] [Google Scholar]
- Chen C, Yang MC, Yang TP. Evidence that silencing of the HPRT promoter by DNA methylation is mediated by critical CpG sites. J Biol Chem. 2001a;276:320–328. doi: 10.1074/jbc.M007096200. [DOI] [PubMed] [Google Scholar]
- Chen RZ, Akbarian S, Tudor M, Jaenisch R. Deficiency of methyl-CpG binding protein-2 in CNS neurons results in a Rett-like phenotype in mice. Nat Genet. 2001b;327:331. doi: 10.1038/85906. [DOI] [PubMed] [Google Scholar]
- Chen WG, Chang Q, Lin Y, Meissner A, West AE, Griffith eC, Jaenisch R, Greenberg ME. Depression of BDNF transcription involves calcium-dependent phosphorylation of MeCP2. Science. 2003;302:885–889. doi: 10.1126/science.1086446. [DOI] [PubMed] [Google Scholar]
- Crambert G, Füzesi M, Garty H, Karlish S, Geering K. Phospholemman (FXYD1) associates with Na,K-ATPase and regulates its transport properties. Proc Natl Acad Sci U S A. 2002;99:11476–11481. doi: 10.1073/pnas.182267299. [DOI] [PMC free article] [PubMed] [Google Scholar]
- Deng V, Matagne V, Banine F, Frerking M, Ohliger P, Budden S, Pevsner J, Dissen GA, Sherman LS, Ojeda SR. FXYD1 is an MeCP2 target gene overexpressed in the brains of Rett syndrome patients and Mecp2-null mice. Hum Mol Genet. 2007;16:640–650. doi: 10.1093/hmg/ddm007. [DOI] [PubMed] [Google Scholar]
- Dillon N. Gene regulation and large-scale chromatin organization in the nucleus. Chromosome Res. 2006;14:117–126. doi: 10.1007/s10577-006-1027-8. [DOI] [PubMed] [Google Scholar]
- Feschenko MS, Donnet C, Wetzel RK, Asinovski NK, Jones LR, Sweadner KJ. Phospholemman, a single-span membrane protein, is an accessory protein of Na,K-ATPase in cerebellum and choroid plexus. J Neurosci. 2003;23:2161–2169. doi: 10.1523/JNEUROSCI.23-06-02161.2003. [DOI] [PMC free article] [PubMed] [Google Scholar]
- Fukuda T, Itoh M, Ichikawa T, Washiyama K, Goto Y. Delayed maturation of neuronal architecture and synaptogenesis in cerebral cortex of Mecp2-deficient mice. J Neuropathol Exp Neurol. 2005;64:537–544. doi: 10.1093/jnen/64.6.537. [DOI] [PubMed] [Google Scholar]
- Garcia-Rudaz C, Deng V, Matagne V, Ronnekleiv O, Bosch M, Han V, Percy AK, Ojeda SR. FXYD1, a modulator of Na(+),K(+)-ATPase activity, facilitates female sexual development by maintaining GnRH neuronal excitability. J Neuroendocrinol. 2008;21:108–122. doi: 10.1111/j.1365-2826.2008.01812.x. [DOI] [PMC free article] [PubMed] [Google Scholar]
- Graveley BR. Alternative splicing: Increasing diversity in the proteomic world. Trends Genet. 2001;17:100–107. doi: 10.1016/s0168-9525(00)02176-4. [DOI] [PubMed] [Google Scholar]
- Guttman M, Amit I, Garber M, French C, Lin MF, Feldser D, Huarte M, Zuk O, Carey BW, Cassady JP, Cabili MN, Jaenisch R, Mikkelsen TS, Jacks T, Hacohen N, Bernstein BE, Kellis M, Regev A, Rinn JL, Lander ES. Chromatin signature reveals over a thousand highly conserved large non-coding RNAs in mammals. Nature. 2009;458:223–227. doi: 10.1038/nature07672. [DOI] [PMC free article] [PubMed] [Google Scholar]
- Guy J, Hendrich B, Holmes M, Martin JE, Bird A. A mouse Mecp2-null mutation causes neurological symptoms that mimic Rett syndrome. Nat Genet. 2001;27:322–326. doi: 10.1038/85899. [DOI] [PubMed] [Google Scholar]
- Horike S, Cai S, Miyano M, Cheng JF, Kohwi-Shigematsu T. Loss of silent-chromatin looping and impaired imprinting of DLX5 in Rett syndrome. Nat Genet. 2005;37:31–40. doi: 10.1038/ng1491. [DOI] [PubMed] [Google Scholar]
- Jaenisch R, Bird A. Epigenetic regulation of gene expression: how the genome integrates intrinsic and environmental signals. Nat Genet. 2003;33(Suppl):245–254. doi: 10.1038/ng1089. [DOI] [PubMed] [Google Scholar]
- Jordan C, Li HH, Kwan HC, Francke U. Cerebellar gene expression profiles of mouse models for Rett syndrome reveal novel MeCP2 targets. BMC. Med Genet. 2007;8:36. doi: 10.1186/1471-2350-8-36. [DOI] [PMC free article] [PubMed] [Google Scholar]
- Kangaspeska S, Stride B, Metivier R, Polycarpou-Schwarz M, Ibberson D, Carmouche RP, Benes V, Gannon F, Reid G. Transient cyclical methylation of promoter DNA. Nature. 2008;452:112–115. doi: 10.1038/nature06640. [DOI] [PubMed] [Google Scholar]
- Khorasanizadeh S. The nucleosome: from genomic organization to genomic regulation. Cell. 2004;116:259–272. doi: 10.1016/s0092-8674(04)00044-3. [DOI] [PubMed] [Google Scholar]
- Kishi N, Macklis JD. MECP2 is progressively expressed in post-migratory neurons and is involved in neuronal maturation rather than cell fate decisions. Mol Cell Neurosci. 2004;27:306–321. doi: 10.1016/j.mcn.2004.07.006. [DOI] [PubMed] [Google Scholar]
- Kishi N, Macklis JD. Dissecting MECP2 function in the central nervous system. J Child Neurol. 2005;20:753–759. doi: 10.1177/08830738050200091001. [DOI] [PubMed] [Google Scholar]
- Klose RJ, Sarraf SA, Schmiedeberg L, McDermott SM, Stancheva I, Bird AP. DNA binding selectivity of MeCP2 due to a requirement for A/T sequences adjacent to methyl-CpG. Mol Cell. 2005;19:667–678. doi: 10.1016/j.molcel.2005.07.021. [DOI] [PubMed] [Google Scholar]
- Koch CM, Andrews RM, Flicek P, Dillon SC, Karaoz U, Clelland GK, Wilcox S, Beare DM, Fowler JC, Couttet P, James KD, Lefebvre GC, Bruce AW, Dovey OM, Ellis PD, Dhami P, Langford CF, Weng Z, Birney E, Carter NP, Vetrie D, Dunham I. The landscape of histone modifications across 1% of the human genome in five human cell lines. Genome Res. 2007;17:691–707. doi: 10.1101/gr.5704207. [DOI] [PMC free article] [PubMed] [Google Scholar]
- Kouzarides T. Chromatin modifications and their function. Cell. 2007;128:693–705. doi: 10.1016/j.cell.2007.02.005. [DOI] [PubMed] [Google Scholar]
- Kriaucionis S, Paterson A, Curtis J, Guy J, Macleod N, Bird A. Gene expression analysis exposes mitochondrial abnormalities in a mouse model of Rett syndrome. Mol Cell Biol. 2006;26:5033–5042. doi: 10.1128/MCB.01665-05. [DOI] [PMC free article] [PubMed] [Google Scholar]
- Kriventseva EV, Koch I, Apweiler R, Vingron M, Bork P, Gelfand MS, Sunyaev S. Increase of functional diversity by alternative splicing. Trends Genet. 2003;19:124–128. doi: 10.1016/S0168-9525(03)00023-4. [DOI] [PubMed] [Google Scholar]
- Lee BM, Mahadevan LC. Stability of histone modifications across mammalian genomes: implications for ‘epigenetic’ marking. J Cell Biochem. 2009;108:22–34. doi: 10.1002/jcb.22250. [DOI] [PubMed] [Google Scholar]
- Luikenhuis S, Giacometti E, Beard CF, Jaenisch R. Expression of MeCP2 in postmitotic neurons rescues Rett syndrome in mice. Proc Natl Acad Sci U S A. 2004;101:6033–6038. doi: 10.1073/pnas.0401626101. [DOI] [PMC free article] [PubMed] [Google Scholar]
- Martinowich K, Hattori D, Wu H, Fouse S, He F, Hu Y, Fan G, Sun YE. DNA methylation-related chromatin remodeling in activity-dependent Bdnf gene regulation. Science. 2003;302:890–893. doi: 10.1126/science.1090842. [DOI] [PubMed] [Google Scholar]
- Matarazzo V, Ronnett GV. Temporal and regional differences in the olfactory proteome as a consequence of MeCP2 deficiency. Proc Natl Acad Sci U S A. 2004;101:7763–7768. doi: 10.1073/pnas.0307083101. [DOI] [PMC free article] [PubMed] [Google Scholar]
- McGill BE, Bundle SF, Yaylaoglu MB, Carson JP, Thaller C, Zoghbi HY. Enhanced anxiety and stress-induced corticosterone release are associated with increased Crh expression in a mouse model of Rett syndrome. Proc Natl Acad Sci U S A. 2006;103:18267–18272. doi: 10.1073/pnas.0608702103. [DOI] [PMC free article] [PubMed] [Google Scholar]
- Metivier R, Gallais R, Tiffoche C, Le PC, Jurkowska RZ, Carmouche RP, Ibberson D, Barath P, Demay F, Reid G, Benes V, Jeltsch A, Gannon F, Salbert G. Cyclical DNA methylation of a transcriptionally active promoter. Nature. 2008;452:45–50. doi: 10.1038/nature06544. [DOI] [PubMed] [Google Scholar]
- Mikkelsen TS, Ku M, Jaffe DB, Issac B, Lieberman E, Giannoukos G, Alvarez P, Brockman W, Kim TK, Koche RP, Lee W, Mendenhall E, O’Donovan A, Presser A, Russ C, Xie X, Meissner A, Wernig M, Jaenisch R, Nusbaum C, Lander ES, Bernstein BE. Genome-wide maps of chromatin state in pluripotent and lineage-committed cells. Nature. 2007;448:553–560. doi: 10.1038/nature06008. [DOI] [PMC free article] [PubMed] [Google Scholar]
- Miller CA, Sweatt JD. Covalent modification of DNA regulates memory formation. Neuron. 2007;53:857–869. doi: 10.1016/j.neuron.2007.02.022. [DOI] [PubMed] [Google Scholar]
- Mounsey JP, John JEI, Helmke SM, Such EW, Gilbert J, Roses AD, Perrymann MB, Jones LR, Moorman JR. Phospholemman is a substrate for myotonic dystrophy protein kinase. J Biol Chem. 2000;275:23362–23367. doi: 10.1074/jbc.M000899200. [DOI] [PubMed] [Google Scholar]
- Mounsey JP, Lu KP, Patel MK, Chen ZH, Horne LT, John JE, III, Means AR, Jones LR, Moorman JR. Modulation of Xenopus oocyte-expressed phospholemman-induced ion currents by co-expression of protein kinases. Biochim Biophys Acta. 1999;1451:305–318. doi: 10.1016/s0167-4889(99)00102-0. [DOI] [PubMed] [Google Scholar]
- Mullaney BC, Johnston MV, Blue ME. Developmental expression of methyl-CpG binding protein 2 is dynamically regulated in the rodent brain. Neuroscience. 2004;123:939–949. doi: 10.1016/j.neuroscience.2003.11.025. [DOI] [PubMed] [Google Scholar]
- Nagane Y, Utsugisawa K, Tohgi H. PCR amplification in bisulfite methylcytosine mapping in the GC-rich promoter region of amyloid precursor protein gene in autopsy human brain. Brain Res Protocols. 2000;5:167–171. doi: 10.1016/s1385-299x(00)00008-8. [DOI] [PubMed] [Google Scholar]
- Nan X, Meehan RR, Bird A. Dissection of the methyl-CpG binding domain from the chromosomal protein MeCP2. Nucleic Acids Res. 1993;21:4886–4892. doi: 10.1093/nar/21.21.4886. [DOI] [PMC free article] [PubMed] [Google Scholar]
- Nuber UA, Kriaucionis S, Roloff TC, Guy J, Selfridge J, Steinhoff C, Schulz R, Lipkowitz B, Ropers HH, Holmes MC, Bird A. Up-regulation of glucocorticoid-regulated genes in a mouse model of Rett syndrome. Hum Mol Genet. 2005;14:2247–2256. doi: 10.1093/hmg/ddi229. [DOI] [PubMed] [Google Scholar]
- Ooi SK, Qiu C, Bernstein E, Li K, Jia D, Yang Z, Erdjument-Bromage H, Tempst P, Lin SP, Allis CD, Cheng X, Bestor TH. DNMT3L connects unmethylated lysine 4 of histone H3 to de novo methylation of DNA. Nature. 2007;448:714–717. doi: 10.1038/nature05987. [DOI] [PMC free article] [PubMed] [Google Scholar]
- Palmer CJ, Scott BT, Jones LR. Purification and complete sequence determination of the major plasma membrane substrate for cAMP-dependent protein kinase and protein kinase C in myocardium. J Biol Chem. 1991;266:11126–11130. [PubMed] [Google Scholar]
- Peddada S, Yasui DH, LaSalle JM. Inhibitors of differentiation (ID1, ID2, ID3 and ID4) genes are neuronal targets of MeCP2 that are elevated in Rett syndrome. Hum Mol Genet. 2006;15:2003–2014. doi: 10.1093/hmg/ddl124. [DOI] [PMC free article] [PubMed] [Google Scholar]
- Presti DF, Jones LR, Lindemann JP. Isoproterenol-induced phosphorylation of a 15-kilodalton sarcolemmal protein in intact myocardium. J Biol Chem. 1985;260:3860–3867. [PubMed] [Google Scholar]
- Ruthenburg AJ, Li H, Patel DJ, Allis CD. Multivalent engagement of chromatin modifications by linked binding modules. Nat Rev Mol Cell Biol. 2007;8:983–994. doi: 10.1038/nrm2298. [DOI] [PMC free article] [PubMed] [Google Scholar]
- Schwartz YB, Pirrotta V. Polycomb silencing mechanisms and the management of genomic programmes. Nat Rev Genet. 2007;8:9–22. doi: 10.1038/nrg1981. [DOI] [PubMed] [Google Scholar]
- Shahbazian MD, Antalffy B, Armstrong DL, Zoghbi HY. Insight into Rett syndrome: MeCP2 levels display tissue- and cell-specific differences and correlate with neuronal maturation. Hum Mol Genet. 2002a;11:115–124. doi: 10.1093/hmg/11.2.115. [DOI] [PubMed] [Google Scholar]
- Shahbazian MD, Young JI, Yuva-Paylor LA, Spencer CM, Antalffy BA, Noebels JL, Armstrong DL, Paylor R, Zoghbi HY. Mice with truncated MeCP2 recapitulate many Rett syndrome features and display hyperacetylation of histone H3. Neuron. 2002b;35:243–254. doi: 10.1016/s0896-6273(02)00768-7. [DOI] [PubMed] [Google Scholar]
- Skene PJ, Illingworth RS, Webb S, Kerr AR, James KD, Turner DJ, Andrews R, Bird AP. Neuronal MeCP2 is expressed at near histone-octamer levels and globally alters the chromatin state. Mol Cell. 2010;37:457–468. doi: 10.1016/j.molcel.2010.01.030. [DOI] [PMC free article] [PubMed] [Google Scholar]
- Tudor M, Akbarian S, Chen RZ, Jaenisch R. Transcriptional profiling of a mouse model for Rett syndrome reveals subtle transcriptional changes in the brain. Proc Natl Acad Sci U S A. 2002;99:15536–15541. doi: 10.1073/pnas.242566899. [DOI] [PMC free article] [PubMed] [Google Scholar]
- Walaas SI, Czernik AJ, Olstad OK, Sletten K, Walaas O. Protein kinase C and cyclic AMP-dependent protein kinase phosphorylate phospholemman, an insulin and adrenalin-regulated membrane phosphoprotein, at specific sites in the carboxy terminal domain. Biochem J. 1994;304:635–640. doi: 10.1042/bj3040635. [DOI] [PMC free article] [PubMed] [Google Scholar]
- Walaas SI, Horn RS, Albert KA, Adler A, Walaas O. Phosphorylation of multiple sites in a 15,000 dalton proteolipid from rat skeletal muscle sarcolemma, catalyzed by adenosine 3’,5’-monophosphate-dependent and calcium/phospholipid-dependent protein kinases. Biochim Biophys Acta. 1988;968:127–137. doi: 10.1016/0167-4889(88)90052-3. [DOI] [PubMed] [Google Scholar]
- Wan M, Lee SS, Zhang X, Houwink-Manville I, Song HR, Amir RE, Budden S, Naidu S, Pereira JL, Lo IF, Zoghbi HY, Schanen NC, Francke U. Rett syndrome and beyond: recurrent spontaneous and familial MECP2 mutations at CpG hotspots. Am J Hum Genet. 1999;65:1520–1529. doi: 10.1086/302690. [DOI] [PMC free article] [PubMed] [Google Scholar]
- Wang Z, Zang C, Rosenfeld JA, Schones DE, Barski A, Cuddapah S, Cui K, Roh TY, Peng W, Zhang MQ, Zhao K. Combinatorial patterns of histone acetylations and methylations in the human genome. Nat Genet. 2008;40:897–903. doi: 10.1038/ng.154. [DOI] [PMC free article] [PubMed] [Google Scholar]