Abstract
Background
T2-weighted cardiac magnetic resonance (CMR) is useful in diagnosing acute inflammatory myocardial diseases such as myocarditis and tako-tsubo cardiomyopathy (TTCM). We hypothesized that quantitative T2 mapping could better delineate myocardial involvement in these disorders vs. T2-weighted imaging.
Methods and Results
Thirty patients with suspected myocarditis or TTCM referred for CMR who met established diagnostic criteria underwent myocardial T2 mapping. T2 values were averaged in involved and remote myocardial segments, both defined by a reviewer blinded to T2 data. In myocarditis, T2 was 65.2±3.2ms in the involved myocardium vs. 53.5±2.1 in remote myocardium (p<0.001). In TTCM, T2 was 65.6±4.0ms in the involved myocardium vs. 53.6±2.7ms in remote segments (p<0.001). T2 values were similar across remote myocardial segments in patients and all myocardial segments in controls (p>0.05 for all). T2 maps provided diagnostic data even in patients with difficulty breath-holding. A T2 cutoff of 59ms identified areas of myocardial involvement with sensitivity and specificity of 94% and 97%, respectively. T2 mapping revealed regions of abnormal T2 beyond those identified by wall motion abnormalities or LGE-positivity. Conventional T2-weighted short tau inversion recovery (T2W-STIR) images were uninterpretable in 7 patients due to artifact and unremarkable in 2 who had elevated T2 values. T2-prepared steady state free precession (T2p-SSFP) images showed areas of signal hyperintensity in only17/30 patients.
Conclusions
Quantitative T2 mapping reliably identifies myocardial involvement in patients with myocarditis and TTCM. T2 mapping delineated greater extent of myocardial disease in both conditions compared to that identified by wall motion abnormalities, T2W-STIR, T2p-SSFP or LGE. Quantitative T2 mapping warrants consideration as a robust technique to identify myocardial injury in patients with acute myocarditis or TTCM.
Keywords: myocarditis, tako-tsubo cardiomyopathy, T2-weighted imaging, T2-mapping, cardiac magnetic resonance imaging
Cardiac magnetic resonance imaging (CMR) plays an important role in the diagnosis of acute myocarditis and tako-tsubo cardiomyopathy (TTCM)1-4. T2-weighted (T2W) imaging is an essential technique to make the correct diagnosis3, 4, particularly in cases where late gadolinium enhancement shows no apparent injury. Unfortunately, traditional T2W-CMR techniques have limitations that affect diagnostic utility with increased artifacts in patients with irregularities in cardiac rhythm or difficulties with breathholding5. Surface coil intensity variation requires specialized normalization methods, bright signal from stagnant blood impairs recognition of adjacent myocardial T2 signal increase and image interpretation remains mostly subjective. Semi-quantitative approaches have been developed for T2W-CMR that, for instance compute signal intensity relative to unaffected remote myocardium or adjacent skeletal muscle; however, these approaches perform poorly when there is diffuse myocardial involvement. Furthermore, these may be insensitive when there is concomitant skeletal muscle involvement, which has been reported in myocarditis3.
Our group has developed a quantitative T2-mapping approach that overcomes many of these limitations6. In this work, we sought to apply this technique to 1) assess its utility and establish myocardial T2 cutoffs for diagnosis of acute myocarditis and TTCM, and 2) compare its diagnostic performance with traditional T2W-short tau inversion recovery (T2W-STIR) imaging and T2-prepared steady state free precession (T2p-SSFP) imaging.
Methods
Study Population
Consecutive patients referred for CMR assessment of acute myocarditis or TTCM between December 2009 and April 2011 who met established diagnostic criteria were prospectively enrolled for participation in an Institutional Review Board (IRB)-approved human subject protocol. In addition, 30 healthy volunteers (control group) without prior cardiovascular history were recruited from advertisements for an ongoing IRB-approved CMR technique development protocol to undergo myocardial T2 mapping in a single mid-ventricular short axis slice. For myocarditis, the following traditional diagnostic criteria were used: 1) symptoms and signs suggestive of cardiac disease (chest pain, dyspnea, palpitations), 2) evidence of myocardial injury as defined by electrocardiogram (ECG) changes (ST-segment changes, conductions defects) and elevated serum markers such as creatine kinase (CK) or troponin-I, and 3) exclusion of coronary artery disease by angiography and/or clinical criteria3. For TTCM the proposed modified Mayo Clinic criteria were used 7, 8: 1) transient wall motion abnormality (WMA) of the LV mid segments with or without apical involvement; WMA beyond single coronary distribution; usually preceded by stressful trigger; 2) absence of obstructive coronary disease; 3) new ECG abnormalities or modest troponin elevation (reference upper normal limit: 0.11); 4) absence of pheochromocytoma and myocarditis. Exclusion criteria included contraindications to CMR, hemodynamic instability, previous myocardial infarction, and previous episode of myocarditis. At the time of enrollment medical history, ECG and results of clinically-obtained procedures such as cardiac catheterization and serological markers were recorded.
CMR examination
All CMR studies were performed on a 1.5 Tesla scanner (Avanto, Siemens Healthcare, Erlangen, Germany) using a 12-channel phased array coil (6 anterior elements plus 6 spine coil elements). The following CMR protocols were used (typical parameters for the sequences are outlined in Table 1).
Table 1.
CMR acquisition parameters
| Sequence | B-SSFP CINE | T2W-STIR | T2-MAPS | LGE | ||
|---|---|---|---|---|---|---|
| Breath-hold | Yes (segmented) | No (real-time cines)† | Yes | Yes | Yes (segmented) | No (single-shot) † |
| Parallel acceleration | GRAPPA rate 2 | TSENSE rate 3 | GRAPPA rate 2 | GRAPPA rate 2 | None | GRAPPA rate 2 |
| In-plane resolution (mm) | 1.5 × 1.5 | 3.5 × 2.1 | 2.2 × 1.5 | 2.2 × 2.8 | 2.2 × 2 | 2.5 × 1.9 |
| Slice thickness (mm) | 8 | 8 | 8 | 8 | 8 | 8 |
| TR / TE (ms) | 3 / 1.3 | 2.3 / 1 | 2 × R-R /60 | 3 × R-R / 0, 24, 55 | 1 × R-R / 4.2 | 2.8 /1.1 |
| Bandwidth (Hz/pixel) | 930 | 1630 | 930 | 1445 | 130 | 1150 |
| Flip angle (°) | 65 | 74 | 90 | 40 | 25 | 40 |
Performed in patients with limited respiratory capacity; B-SSFP: balanced steady-state free precession imaging; T2W-STIR: T2 weighted short tau inversion-recovery; LGE: late gadolinium-enhancement
Balanced steady-state free precession (SSFP) cine imaging in 3 long axis planes (horizontal, vertical, and three-chamber) and 8-12 contiguous short axis (SAX) planes to cover the LV. Real time imaging with a TSENSE acceleration factor of 3 was employed for subjects unable to breath-hold.
T2 maps were acquired in basal, mid, and apical SAX and 3 long axis (horizontal, vertical and three-chamber) planes using a T2-prepared single-shot SSFP sequence as previously described6. Briefly, three T2-prepared (T2P) SSFP images, each image with a different T2P time (0ms, 24ms, and 55ms respectively; TR = 3 × R-R, total acquisition time of 7 heartbeats) were acquired. All images were acquired with attempted breath-hold. To correct for residual cardiac and respiratory motion between images, a fast variational non-rigid registration algorithm was used, aligning all T2-prepared frames to the center frame9. Finally, T2 maps were generated from these motion-corrected images by fitting a mono-exponential decay curve at each pixel.
T2-weighted STIR images10 were obtained in basal, mid, and apical SAX and 3 long axis planes.
Late gadolinium-enhancement (LGE) imaging was performed in the same planes as SSFP cines using a segmented inversion-recovery gradient-echo sequence 10 minutes after intravenous 0.2mmol/kg gadolinium-DTPA administration. Inversion time was adjusted to null the myocardium. Non-breath-held single-heartbeat LGE imaging was performed for patients unable to breathhold11.
General Image Analysis
Left ventricular end-diastolic and systolic volumes were measured using the Simpson’s method and indexed to body surface area. A standardized 17-segment model12 was used to evaluate regional LV wall motion (1-normal, 2-hypokinesis, 3-akinesis, 4-dyskinesis, 5-anuerysmal); the wall motion score index was calculated as the sum of the segmental scores divided by 17.
Regional myocardial function was also assessed by analyzing peak circumferential and radial strain in each segment including basal, mid, and apical short axis breath-held SSFP cines using a vector-based feature tracking software (Vector Velocity Imaging, Siemens, Mountain View, CA) that has been previously described13-16. Briefly, contours were drawn along the LV endocardial and epicardial borders and automatically propagated through all frames. The ventricle is divided into 6 segments at each short axis view. By tracking the features within each voxel throughout the cardiac cycle (similar to speckle tracking in echocardiography), circumferential and radial strain values were obtained. Six basal, 6 mid-ventricular and 4 apical segments were analyzed yielding strain values for a total of 16 segments.
T2W-STIR and T2p-SSFP (55ms T2 prep image from the T2 mapping sequence) images were independently evaluated by two experienced reviewers (SVR, PT for T2W-STIR and SVR, SG for T2p-SSFP) and rated by consensus as negative, segmental or global for edema, or inadequate. In order to classify patients as having global edema, the signal intensity was visually compared to adjacent skeletal muscle. Late gadolinium hyperenhancement of each myocardial segment was rated visually as none, subepicardial, midwall, subendocardial or transmural.
T2 Maps Image Analysis
One experienced reviewer (MW) blinded to the results of T2 mapping and regional strain analysis reviewed only cine and LGE images to label each of 16 LV segments as either affected if wall motion was abnormal and/or LGE was positive (involved myocardium) or spared (remote myocardium). Subsequently, strain values were averaged for the affected and remote myocardial segments for comparison.
T2 values were recorded from quantitative T2 maps for 16 LV segments by drawing regions of interest encompassing each myocardial segment; the apical apex (segment 17) was avoided due to inherently thin myocardium precluding accurate delineation of myocardium without partial volume error. In order to ensure that the ROI were within the myocardium and did not include epicardial fat or pericardial effusion, SSFP short axis cine and LGE images from the identical slice positions as the T2P SSFP images were reviewed concurrently to help delineate the myocardial borders.
Initial clinical experience afforded recognition of visually-apparent increased T2 in regions beyond abnormal wall motion and LGE in patients with both myocarditis and TTCM. Such apparent regions of increased T2 signal intensity identified beyond a segment denoted as abnormal by the blinded reviewer were considered involved myocardium as well. The T2 of ‘involved myocardium’ was the average of the affected segments defined by the blinded reviewer as well as additional areas of visual T2 abnormality not identified by abnormal wall motion or LGE by the blinded reviewer. The T2 of ‘remote myocardium’ was the average of values in the remote segments defined by the blinded reviewer that also lacked visually-apparent T2 abnormality.
Statistical Analysis
Continuous data with normal distribution are expressed as mean ± SD, and non-normally distributed data as median and interquartile range. Categorical data are expressed as frequency or percentage. Paired or unpaired t tests as appropriate were used or comparison of normally distributed data. One way ANOVA with Bonferroni post hoc analysis was used for comparison of T2 values between controls and both remote and involved segments in patients with myocarditis and TTCM. Receiver operating characteristic curves were used to identify the cutoff values of T2 values to differentiate abnormal myocardial segments from that of control or remote myocardial segments as defined above. Interobsever agreement was tested by Bland-Altman analysis. Statistical significance was set at a two-tailed probability of p < 0.05. All statistical analysis was performed using MedCalc (ver 11. 5.0.0).
Results
Clinical and serological findings
The baseline characteristics of the 30 patients (20 with acute myocarditis, 10 with TTCM) are summarized in Table 2. Additionally, T2 maps were acquired in 18 male and 12 female healthy volunteers age 28 ± 6 years. None of the patients had a history of previous cardiovascular disease. The peak troponin-I level averaged 16.3 ± 14.1 mg/dL in patients with myocarditis and 3.4 ± 2.8 mg/dL in patients with TTCM. Seventeen out of 20 patients with myocarditis and all patients with TTCM underwent invasive coronary angiography prior to CMR; all angiograms showed absence of significant coronary stenosis. The three patients who did not have coronary angiography were under 25 years of age. The cause of myocarditis was found to be viral by serologies in 4 subjects, giant cell myocarditis by endomyocardial biopsy in 1 subject, and a cause was not identified in 15.
Table 2.
Baseline characteristics and general CMR findings of the study population
| Myocarditis | TTCM | |
|---|---|---|
| N | 20 | 10 |
| Age (years) | 38 ± 16 | 60 ± 10 |
| Male : Female | 9 : 11 | 0: 10 |
| Caucasian | 65% | 90% |
| BMI (kg/m2) | 29.0 ± 6.8 | 27.2 ± 6.0 |
| Cardiac risk factors* | 35% | 70% |
| Time between admission and CMR (days) | 1.6 ± 2.0 | 1.8 ± 1.3 |
| Peak troponin-I (mg/dL)† | 16.3 ± 14.1 | 3.4 ± 2.8 |
| Length of stay (days), median (range) | 3 (1 – 25) | 3.5 (1 – 23) |
| LV end-diastolic volume index (mL/m2) | 80.2 ± 14.4 | 77.3 ± 9.1 |
| LV end-systolic volume index (mL/m2) | 41.1 ± 11.0 | 45.6 ± 7.5 |
| LV ejection fraction (%) | 50 ± 9 | 40 ± 9 |
| LV mass index (mg/m2) | 61.1 ± 7.1 | 60.5 ± 10.4 |
| Wall motion score index (median/IQR) | 1.3 (1.1-1.6) | 2.0 (1.8-2.1) |
| LGE hyperenhancement (HE) present | 75% | 0% |
| LGE distribution when HE present | 95% epicardial and/or mid-myocardial, 5% transmural | - |
Cardiac risk factors included diabetes, hypertension, hypercholesterolemia, or smoking history; TTCM, tako-tsubo cardiomyopathy; LV, left ventricle; IQR, interquartile range; LGE, late gadolinium enhancement
The laboratory’s high-sensitivity troponin-I assay deemed normal as <0.11 mg/dL.
CMR findings: LV function and LGE
CMR was performed at 1.7 ± 1.8 days (median = 1 day, range = 0 to 7 days) after admission to the hospital. All patients and controls were in sinus rhythm as the time of CMR examination. Routine CMR findings in the study population are summarized in Table 2. Among patients with myocarditis, real-time cines and/or single-heartbeat LGE imaging were used in 3 patients due to difficulty with breath-holding. LV systolic function overall was mildly reduced with LVEF averaging 50 ± 9%. Wall motion abnormality involving at least one segment was present in 80% of myocarditis patients. There was no apparent myocardial hyperenhancement by LGE in one-fourth of myocarditis patients. In the remaining LGE-positive myocarditis patients, hyperenhancement was typically subepicardial or midmyocardial and most commonly involved the inferior and inferolateral walls. As expected, peak troponin values in patients with LGE-positivity were higher than those who were LGE-negative (18.4 ± 13.7 versus 4.8 ± 7.6, p=0.003). No patient had subendocardial hyperenhancement on LGE consistent with absence of coronary disease-related myocardial infarction.
In the patients with TTCM, LVEF averaged 40 ± 9%. Real-time cine and/or single-heartbeat LGE imaging were necessary in 2 patients. All patients had at least one LV segment with abnormal wall motion. LGE showed no hyperenhancement in all TTCM patients.
CMR findings: regional strain
In the subset of patients with myocarditis and TTCM who had breath-held SSFP cines and had at least 1 completely normal myocardial segment (n=23), the mean peak circumferential systolic strain in the involved segments was -13.7 ± 6.3% versus -23.3 ± 5.8% in the remote segments (p < 0.001) and radial strain in the involved myocardial segments was 16.8 ± 7.6% versus 38.5 ± 6.7% in the remote segments (p<0.001).
CMR findings: T2 mapping
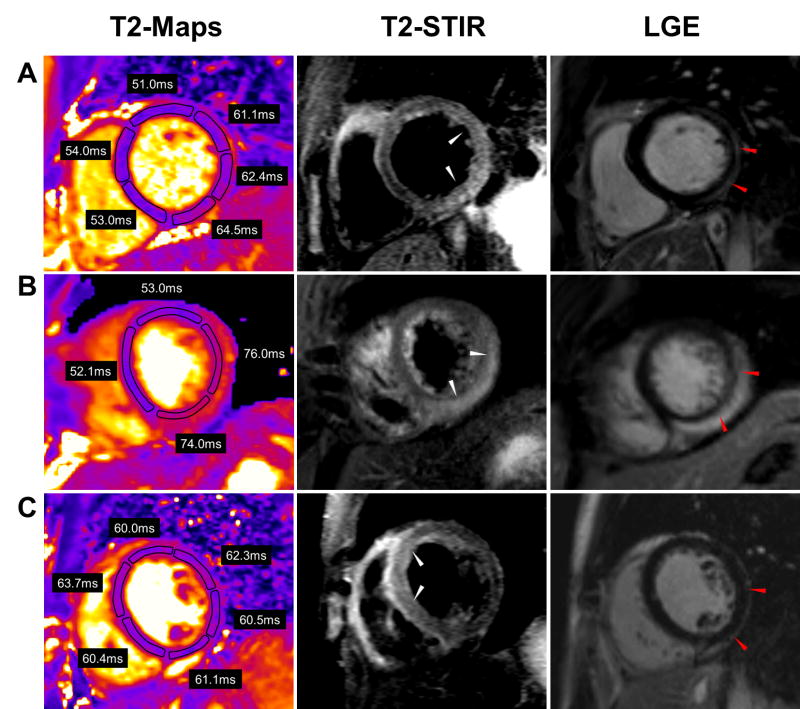
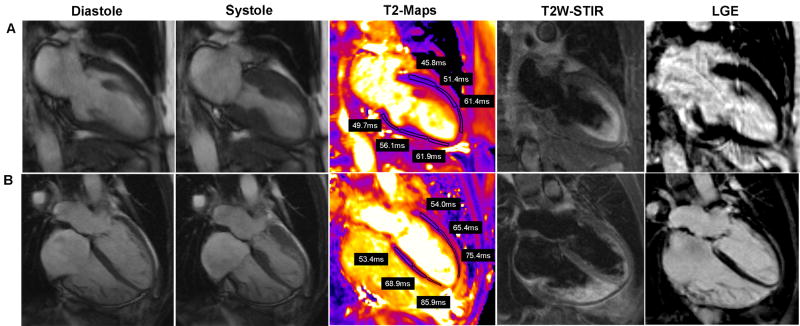
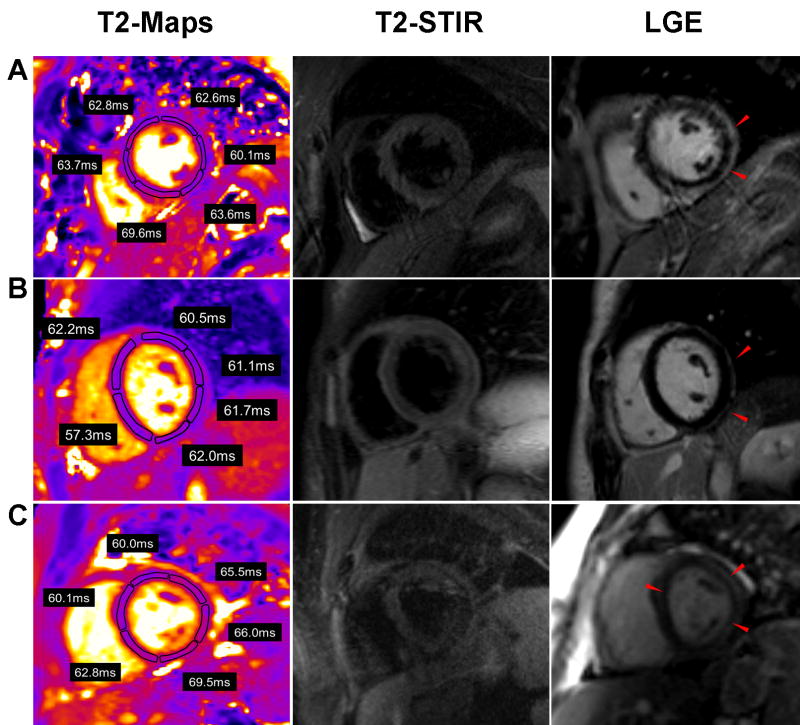
The quantitative results of T2 mapping are illustrated in Figure 1. The mean T2 measured in the involved myocardium in patients with myocarditis was 65.2 ± 3.2ms compared to 53.5 ± 2.1ms in the remote segments (p < 0.001). The mean T2 measured in the involved myocardium in patients with TTCM was 65.6 ± 4.0ms compared to 53.6 ± 2.7ms in remote myocardium. Myocardial T2 in controls was 54.5 ± 2.2ms. There was no significant difference in T2 values in the involved myocardium between patients with myocarditis and TTCM (p>0.05, Bonferroni post hoc analysis) or between the T2 values of controls and that of the remote myocardium in patients with myocarditis or TTCM (p=0.6, ANOVA). Typical T2 maps vs. other CMR techniques are shown in Figure 2 for myocarditis and Figure 3 for TTCM.
Figure 1.
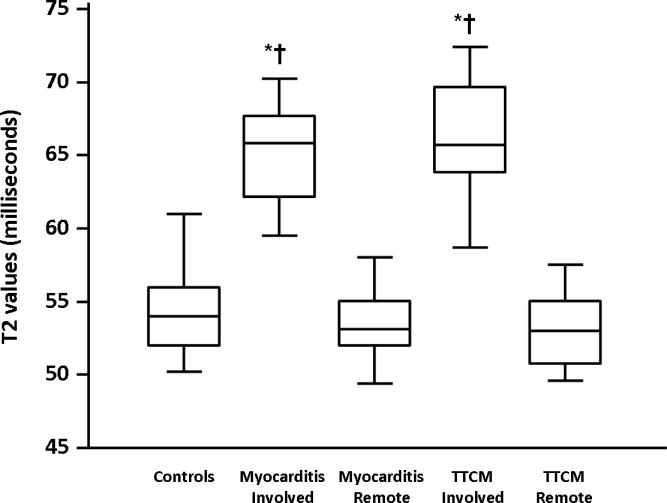
Averaged T2 values in the involved and remote segments in patients with myocarditis (N=20) and TTCM (N=10) and controls (N=30) are shown. The centerline in each box represents the median, while the lower and upper limits of each box represent 25th and 75th percentiles, respectively. *p<0.001 for comparison to controls (ANOVA with Bonferroni post hoc analysis), †p<0.001 for comparison to remote segments.
Figure 2.
T2 maps, T2W-STIR, and LGE images in 3 representative patients with myocarditis. (A) A 25 year-old male presented with gastrointestinal symptoms with ST elevations and a troponin of 31.1mg/dL. Three involved and 3 remote segments are shown. (B) A 29 year-old male presented with chest pain worse with inspiration and lying flat. He had diffuse ST elevations with a peak troponin of 17.3mg/dL. Two involved and two remote segments are shown (C) A 24 year old male who presented with syncope. Peak troponin was 4.5mg/dL. All illustrated segments show elevated T2 values.
Figure 3.
SSFP diastolic and systolic images, T2 maps, and LGE images in 2 patients with TTCM. (A)72 year old female presented with shortness of breath, found to have normal coronaries. (B) 49 year old female presented with chest pain, found to have normal coronaries. CMR images show apical ballooning of both left and right ventricle. In both cases, the T2 maps show elevated T2 values in the mid and/or apical segments with normal values involving the basal segments
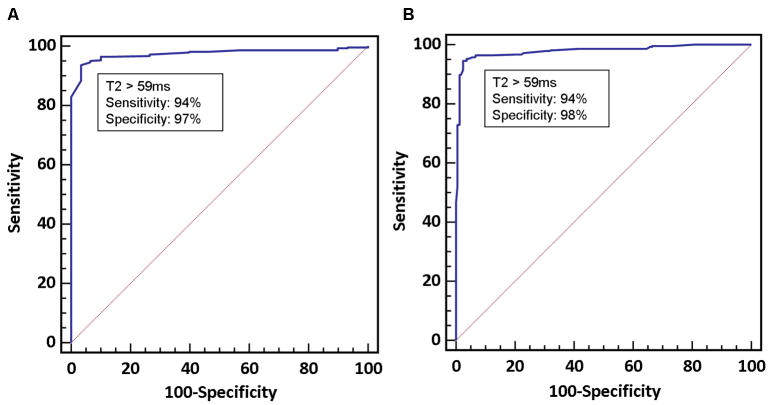
Figures 4a and 4b illustrates the ROC curves for T2 values to identify segments of myocardium involved with myocarditis or TTCM when compared with controls or remote myocardial segments. A cutoff value of >59ms had a sensitivity of 94% (95% CI: 91 – 97%) and specificity of 98% (95% CI: 94 - 99%) to differentiate involved myocardium in patients from myocardium of healthy controls. When compared to remote segments, the same cutoff had a sensitivity of 94% (95% CI: 90 – 96%) and specificity of 97% (95% CI: 83-100%). We performed a power calculation to assess the use of 59ms to differentiate remote from involved myocardial segments in patients with myocarditis or TTCM. The following parameters were used: mean T2 of remote myocardium (μ0) = 53.5ms, SD = 2.1ms, T2 cut-off value tested = 59ms (μ1), sample size =30 patients, and α = 0.05. This provided a power of >95% to differentiate abnormal myocardial segments from remote segments
Figure 4.
ROC curves. (A) Comparison of involved myocardial segments in either myocarditis or TTCM in comparison to healthy controls. (B) Comparison of involved myocardial segments with remote segments in the same patients.
Among all patients studied, 17 of 30 had myocardial segments identified as abnormal based on visual inspection of T2 maps beyond regions identified as abnormal by the blinded reviewer (i.e. beyond areas of LGE hyperenhancement and wall motion abnormality). On average, 2.1 additional segments (range 1-12 segments) were identified as abnormal in these patients. The mean T2 value for these segments alone was 64.5 ± 2.4ms (p < 0.001 compared to remote myocardium and controls). Among these patients, 13 had segmented SSFP cines with at least 1 completely normal myocardial segment. Despite normal wall motion, the mean radial strain for these segments was abnormally reduced (27.1 ± 8.3% vs. 38.7 ± 5.6% for the remote segments in the same patients, p = 0.002). The mean circumferential strain was -19.7 ± 6.2% versus -25.0 ±. 5.9% for the remote segments (p=0.013). These findings underscore greater sensitivity of strain analysis for regional myocardial dysfunction, which occurred in regions with measurably abnormal myocardial T2, compared to visual appreciation of abnormal wall motion.
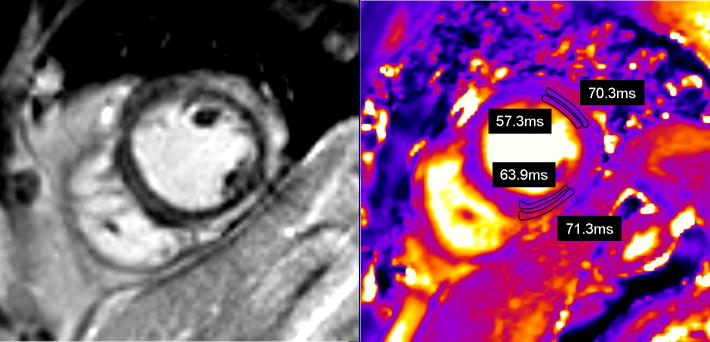
In the 14 patients with myocarditis whose LGE showed epicardial or mid-myocardial hyperenhancement, T2 values were measured in the regions of myocardial hyperenhancement and in the subendocardial myocardium of the same segments (Figure 5). The average T2 in LGE-positive regions was 67.7 ± 7.3ms vs. 57.8 ± 3.6ms in the adjacent subendocardial myocardium (p < 0.001).
Figure 5.
T2 values measured in an area of myocardium with epicardial delayed enhancement versus subendocardial myocardium in the same regions. (A) Short axis delayed enhancement image, (B) short axis T2 image from the same slice position.
T2 mapping: influence of heart rate
There were 5 patients in whom measured T2 values were lower than the mean values for the remote and involvement myocardial segments for the overall population, with remote segments having values as low as 47ms and involved segments with values as low as 54ms. These patients were also included in our analysis. Upon further review, these were all patients with heart rates between 92 and 105 beats per minute during T2 mapping. This is consistent with tachycardia preventing adequate T1 recovery and therefore affecting T2 measurement. Four out of these 5 patients had diagnostic quality T2-STIR images that also showed regional areas of increased signal intensity.
T2W-STIR and T2p-SSFP versus T2 mapping
T2W-STIR imaging was successfully completed in 14 of 30 patients (47%). In the remaining patients, diagnostic images could not be obtained or were uninterpretable (Figure 6c) because of respiratory motion artifact arising from patients’ inability to breath-hold or due to cardiac arrhythmia. In the 14 patients who had successful T2W-STIR imaging, myocardial edema was detected as areas of signal hyperintensity in 12. In 2 patients with negative T2W-STIR, both showed myocardial hyperenhancement by LGE and one had corresponding wall motion abnormalities; myocardial T2 values were elevated in multiple segments in both patients (Figure 6a, b).
Figure 6.
T2 maps, T2W-STIR, and LGE images in 3 representative patients with myocarditis with no obvious edema on T2 STIR imaging. (A) 44 year old male with chest pain and a peak troponin of 33.3mg/dL. T2 values in the involved and remote segments were 65 and 54ms respectively. (B) 20 year old female with shortness of breath and chest pain with a peak troponin of 4.0mg/dL. T2 values in the involved and remote segments were 66 and 56ms respectively. (C) 39 year old male with gastrointestinal symptoms and fever with a peak troponin of 12.4mg/dL. Involved and remote segments T2 values were 67 and 45ms respectively.
In independent review of T2p time =55 ms SSFP images from all 30 patients, myocardial edema was detected as areas of signal hyperintensity in 17 (Figure 7). T2 mapping from the affected regions of patients with visually-negative SSFP cases averaged 65.3 ± 2.7 ms compared to 53.6 ± 2.1 in remote regions in these cases. 8 of 13 visually-negative T2p-SSFP images showed myocardial hyperenhancement by LGE.
Figure 7.
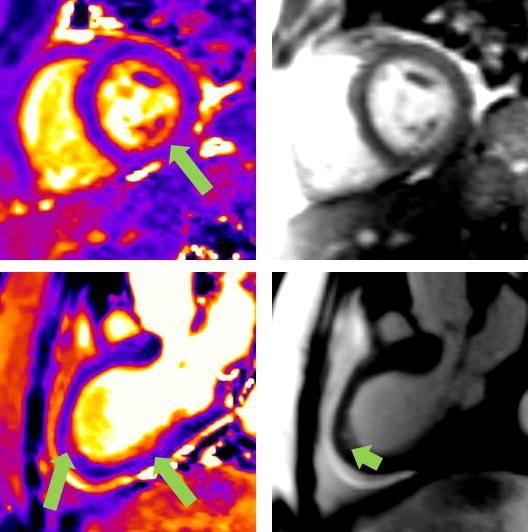
Comparison between T2 maps and T2p-SSFP images is shown. The upper left panel shows the T2 map from a patient with tako-tsubo cardiomyopathy and negative LGE imaging; the affected region (arrow) had an abnormally elevated T2 of 65.9 ms compared to 53.0 ms in the remote myocardium. The same patient’s T2p-SSFP image (upper right panel) was visually rated as normal by two expert reviewers. The bottom left panel shows the T2 map from a patient with myocarditis whose LGE showed epicardial hyperenhancement in the inferolateral and apical segments; these segments were also abnormal by T2 mapping (T2 = 67.0 in the affected region vs. 53.0 ms in the remote myocardium). The apical region was identified as abnormal by visual assessment of the T2p-SSFP image (bottom right panel, arrow).
Interobserver agreement
Inter-observer variability analysis was performed for all patients and controls by two independent observers who measured T2 values in each of the 16 myocardial segments. The T2 values for the involved and remote myocardium (as defined previously) were then averaged separately and compared between the two observers. For the controls, the T2 values were measured by drawing an ROI to include the entire mid ventricular short axis slice by the same two observers and the T2 values were compared. Bland-Altman analysis showed good inter- and intra-observer agreement in the measured T2 values for the affected myocardium, remote myocardium, and in controls (Figure 8). The mean difference in T2 between the two readers was 0.2 ± 0.8ms in involved myocardium, -0.1 ± 1.2ms in remote myocardium, and 0.4 ± 1.2ms in control myocardium (p = 0.38, 0.63, and 0.08 respectively).
Figure 8.
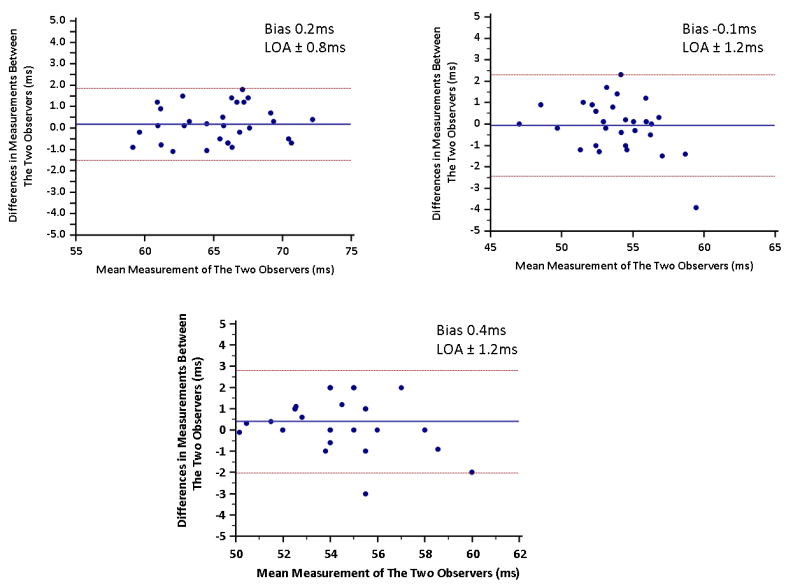
Bland-Altman plots for interobserver agreement in the measurement of T2 values for patients with myocarditis or TTCM. (A) Involved myocardial segments, (B) remote myocardial segments, and for (C) controls. LOA, level of agreement 1 standard deviation.
Discussion
In patients with the inflammatory conditions of myocarditis and tako-tsubo cardiomyopathy, we found elevated myocardial T2 values using quantitative T2 mapping that readily delineated presence and extent of myocardial involvement. Current CMR protocols in these conditions have focused on detecting wall motion abnormalities, myocardial hyperenhancement by LGE, and increased signal intensity by subjectively-interpreted STIR images. Such an approach may be problematic for limitations related to each of the techniques. First, wall motion abnormalities may not be visually apparent, particularly in segments adjacent to those with grossly impaired contractile function. Second, LGE may not identify mild involvement in myocarditis and may be particularly insensitive to tissue abnormalities in TTCM. Third, the use of STIR imaging to consistently identify myocardial edema is known to be limited by numerous factors. In this cohort, T2 maps were of diagnostic quality in all patients including those with difficulty breath-holding or cardiac arrhythmia. Conversely, T2-STIR images were non-diagnostic in one-third of patients and normal in cases where myocardial T2 values were clearly abnormal by T2 mapping. Visual assessment of T2p-SSFP fared better than T2-STIR, providing adequate images for review in all patients but without evident abnormality in just under half of patients in this cohort.
Our finding suggest that not only is T2 mapping robust in patients with inflammatory myocardial diseases, but is also adds insights into the extent of myocardial involvement in these conditions. Abnormal T2 was shown to extend beyond areas of wall motion abnormalities and LGE-positivity in over half of patients. The clinical significance of abnormal T2 values beyond segments of LGE and wall motion is unknown. It is intriguing to consider that distinguishing those with vs. those without abnormal T2 values beyond areas of LGE-positivity and wall motion abnormality may provide additional prognostic information, as a subset of patients with myocarditis progress to dilated cardiomyopathy17. Further investigations may determine whether or not greater extent of abnormal T2 portends higher risk of subsequent persistent LV dysfunction and adverse remodeling.
None of our patients with TTCM had hyperenhancement by LGE. There has been some recent literature suggesting that LGE-positivity may be seen in TTCM18. Given variable findings on LGE in TTCM, greater specificity of increased myocardial T2 in a typical pattern of involved segments may be a more useful criterion than LGE-negativity to diagnose TTCM. In patients with myocarditis and TTCM, we identified 59ms as a sensitive and specific cutoff to detect abnormal myocardium by quantitative T2 mapping using this specific T2-mapping sequence. The mean difference in T2 values between affected segments and remote myocardium in patients with acute myocarditis was 11.7ms, while in patients with TTCM it was 12.0ms. This large difference along with a narrow distribution around the mean resulted in minimal overlap between involved and remote myocardial segments (Figure 1). As such, quantitative mapping allowed differentiation of segments with vs. those without myocardial involvement in all patients in this study, and our data support use of a 59 ms cutoff for clinical decision-making. Rapid acquisition, lack of breath-holding requirement and excellent inter-observer agreement in T2 measurement all make this approach appealing for clinical use to diagnose myocarditis and TTCM.
Globally reduced T2 values were observed in the T2 maps of 5 patients; upon further review, it was found that all of these patients had high heart rates (92 to 105 bpm) during T2 map acquisition. At such high heart rates, the TR of 3RR intervals is insufficient for T1 recovery of magnetization between the three T2-prepared acquisitions, leading to an underestimation of myocardial T2 values. We suggest based on our experience from agarose phantom studies (unpublished work), a TR > 2300 ms is necessary for consistent T2 estimation, and we have accordingly modified our implementation of T2 mapping pulse sequence for future studies. In this study, this limitation was overcome by differential analysis of T2 values between remote and involved myocardial segments. It is therefore prudent to not only to adjust the sequence timing to allow for at least 2300 ms between images, but also to compare T2 values between remote and involved myocardial segments. While this may not be possible in patients with diffuse myocardial involvement, our experience suggests that even in these patients a segment of “normal” myocardium comprised of at least 15 pixels can usually be identified.
The detection of myocardial edema using T2W-STIR has been shown to be feasible in patients with acute myocarditis and TTCM3, though the routine clinical use of T2W-STIR imaging has been challenged by widely-recognized limitations19, 20. The relative insensitivity of the T2 mapping technique to motion artifacts is a result of its use of a single-shot image acquisition and automatic correction of motion between images. This strategy has been described previously and is an important benefit especially in patients with acute cardiopulmonary disease6, 9. While motion artifacts are also reduced in the T2p-SSFP technique, global increase in T2 signal may be difficult to appreciate visually in any T2-weighted image, whereas globally elevated T2 values are easily recognized. Although our study demonstrated a clear advantage of T2 quantification over T2W STIR and T2p-SSFP, we did not compare with T2-ACUTE, another recently introduced method for T2 weighted imaging of myocardium. Based on results in the literature, we expect the performance of this technique to be similar to that of T2p-SSFP21, 22. In nearly three-fourths of myocarditis patients with hyperenhancement on LGE, T2 mapping identified abnormal T2 values beyond the myocardial segments deemed abnormal by LGE alone. Among all myocarditis and TTCM patients, T2 mapping identified areas of abnormality in segments beyond those with LGE or wall motion abnormality in 57% (17 of 30). Radial and circumferential strain measured in abnormal T2 segments with visually-normal wall motion was lower than strain measured in remote myocardium, consistent with contractile dysfunction accompanying elevated myocardial T2.
Study Limitations
The relatively small sample size, albeit comparable to those of several previous publications assessing the use of T2W-STIR imaging in patients with acute myocarditis and TTCM, reflects the uncommon nature of the conditions studied 2, 3, 23. In 30 patients with inflammatory myocardial disease, T2 mapping readily distinguished regions of involved myocardium from remote and normal myocardium, resulting in highly significant results. Also, there was a wider distribution of T2 values in regions of myocardial involvement. This may reflect heterogeneity in tissue changes, just as there is an epicardial predominance of injury by late gadolinium enhancement. We combined patients with acute myocarditis and TTCM in our study; while the inciting mechanisms of these diseases may differ, they likely share inflammatory pathways leading to tissue injury24, 25 such that increased myocardial T2 reveals sequelae of a common pathophysiological construct. Of note, both typically present with chest pain, elevated biomarkers of myocardial injury and no significant coronary stenosis, and both may have diffuse myocardial involvement; thus, validation of T2 mapping in myocarditis and TTCM is an important step towards routine clinical use in accurately distinguishing these conditions from ACS26. We did not use early post-gadolinium imaging, another technique used in some laboratories for diagnosis of myocardial inflammation. While subsequent work may explore T2 mapping’s performance amidst such techniques, the goal of the study was to establish numeric cutoffs for myocardial involvement using T2 mapping and to compare its utility to T2-weighted myocardial imaging in myocarditis and TTCM. The implementation of T2 mapping in this work used TR = 3RR intervals, a choice based on our earlier experience with healthy subjects and ACS patients16. This strategy is suboptimal for patients with elevated heart rates, where 3RR intervals are not sufficient for the magnetization to recover; the resulting T1-weighting in the raw images caused a reduction in the calculated T2. However, in these patients, a significant difference in T2 values still existed between involved and remote myocardium. Finally the T2p-SSFP sequence used was a single shot acquisition; the performance of a segmented acquisition would likely be better due to higher spatial resolution and coil intensity correction.
Conclusions
T2 mapping is a robust alternative to T2W-STIR and T2p-SSFP to detect myocardial involvement in patients with acute myocarditis and TTCM. Relative insensitivity to cardiac and respiratory motion affords successful detection of acute myocarditis and TTCM with this approach even in patients with difficulty breath-holding. T2 mapping in both myocarditis and TTCM identifies more extensive myocardial involvement than that suggested by late gadolinium enhancement, cine imaging, and T2W-STIR.
Acknowledgments
Sources of Funding Supported in part by NIH R01HL095563 and R01HL102450 to Drs. Raman and Simonetti.
Disclosures Drs. Raman and Simonetti receive research support from Siemens.
References
- 1.Eitel I, Behrendt F, Schindler K, Kivelitz D, Gutberlet M, Schuler G, Thiele H. Differential diagnosis of suspected apical ballooning syndrome using contrast-enhanced magnetic resonance imaging. Eur Heart J. 2008;29:2651–2659. doi: 10.1093/eurheartj/ehn433. [DOI] [PubMed] [Google Scholar]
- 2.Abdel-Aty H, Cocker M, Friedrich MG. Myocardial edema is a feature of Tako-Tsubo cardiomyopathy and is related to the severity of systolic dysfunction: insights from T2-weighted cardiovascular magnetic resonance. Int J Cardiol. 2009;132:291–293. doi: 10.1016/j.ijcard.2007.08.102. [DOI] [PubMed] [Google Scholar]
- 3.Abdel-Aty H, Boye P, Zagrosek A, Wassmuth R, Kumar A, Messroghli D, Bock P, Dietz R, Friedrich MG, Schulz-Menger J. Diagnostic performance of cardiovascular magnetic resonance in patients with suspected acute myocarditis: comparison of different approaches. J Am Coll Cardiol. 2005;45:1815–1822. doi: 10.1016/j.jacc.2004.11.069. [DOI] [PubMed] [Google Scholar]
- 4.Friedrich MG, Sechtem U, Schulz-Menger J, Holmvang G, Alakija P, Cooper LT, White JA, Abdel-Aty H, Gutberlet M, Prasad S, Aletras A, Laissy JP, Paterson I, Filipchuk NG, Kumar A, Pauschinger M, Liu P. Cardiovascular magnetic resonance in myocarditis: A JACC White Paper. J Am Coll Cardiol. 2009;53:1475–1487. doi: 10.1016/j.jacc.2009.02.007. [DOI] [PMC free article] [PubMed] [Google Scholar]
- 5.Pennell D. Myocardial salvage: retrospection, resolution, and radio waves. Circulation. 2006;113:1821–1823. doi: 10.1161/CIRCULATIONAHA.105.618942. [DOI] [PubMed] [Google Scholar]
- 6.Giri S, Chung YC, Merchant A, Mihai G, Rajagopalan S, Raman SV, Simonetti OP. T2 quantification for improved detection of myocardial edema. J Cardiovasc Magn Reson. 2009;11:56. doi: 10.1186/1532-429X-11-56. [DOI] [PMC free article] [PubMed] [Google Scholar]
- 7.Eitel I, Lucke C, Grothoff M, Sareban M, Schuler G, Thiele H, Gutberlet M. Inflammation in takotsubo cardiomyopathy: insights from cardiovascular magnetic resonance imaging. Eur Radiol. 2010;20:422–431. doi: 10.1007/s00330-009-1549-5. [DOI] [PubMed] [Google Scholar]
- 8.Prasad A, Lerman A, Rihal CS. Apical ballooning syndrome (Tako-Tsubo or stress cardiomyopathy): a mimic of acute myocardial infarction. Am Heart J. 2008;155:408–417. doi: 10.1016/j.ahj.2007.11.008. [DOI] [PubMed] [Google Scholar]
- 9.Giri S, Xue H, Shah S, Dharmakumar R, Verhaert D, Guehring J, Zuehlsdorff S, Raman S, Simonetti O. Inline non-rigid motion-corrected t2 mapping of myocardium. Journal of Cardiovascular Magnetic Resonance. 2010;12:P229. [Google Scholar]
- 10.Simonetti OP, Finn JP, White RD, Laub G, Henry DA. “Black blood” T2-weighted inversion-recovery MR imaging of the heart. Radiology. 1996;199:49–57. doi: 10.1148/radiology.199.1.8633172. [DOI] [PubMed] [Google Scholar]
- 11.Sievers B, Elliott MD, Hurwitz LM, Albert TS, Klem I, Rehwald WG, Parker MA, Judd RM, Kim RJ. Rapid detection of myocardial infarction by subsecond, free-breathing delayed contrast-enhancement cardiovascular magnetic resonance. Circulation. 2007;115:236–244. doi: 10.1161/CIRCULATIONAHA.106.635409. [DOI] [PubMed] [Google Scholar]
- 12.Cerqueira MD, Weissman NJ, Dilsizian V, Jacobs AK, Kaul S, Laskey WK, Pennell DJ, Rumberger JA, Ryan T, Verani MS. Standardized myocardial segmentation and nomenclature for tomographic imaging of the heart: a statement for healthcare professionals from the Cardiac Imaging Committee of the Council on Clinical Cardiology of the American Heart Association. Circulation. 2002;105:539–542. doi: 10.1161/hc0402.102975. [DOI] [PubMed] [Google Scholar]
- 13.Hor KN, Gottliebson WM, Carson C, Wash E, Cnota J, Fleck R, Wansapura J, Klimeczek P, Al-Khalidi HR, Chung ES, Benson DW, Mazur W. Comparison of magnetic resonance feature tracking for strain calculation with harmonic phase imaging analysis. JACC Cardiovasc Imaging. 2010;3:144–151. doi: 10.1016/j.jcmg.2009.11.006. [DOI] [PubMed] [Google Scholar]
- 14.Bansal M, Cho GY, Chan J, Leano R, Haluska BA, Marwick TH. Feasibility and accuracy of different techniques of two-dimensional speckle based strain and validation with harmonic phase magnetic resonance imaging. J Am Soc Echocardiogr. 2008;21:1318–1325. doi: 10.1016/j.echo.2008.09.021. [DOI] [PubMed] [Google Scholar]
- 15.Pirat B, Khoury DS, Hartley CJ, Tiller L, Rao L, Schulz DG, Nagueh SF, Zoghbi WA. A novel feature-tracking echocardiographic method for the quantitation of regional myocardial function: validation in an animal model of ischemia-reperfusion. J Am Coll Cardiol. 2008;51:651–659. doi: 10.1016/j.jacc.2007.10.029. [DOI] [PMC free article] [PubMed] [Google Scholar]
- 16.Verhaert D, Thavendiranathan P, Giri S, Mihai G, Rajagopalan S, Simonetti OP, Raman SV. Direct t2 quantification of myocardial edema in acute ischemic injury. JACC Cardiovasc Imaging. 2011;4:269–278. doi: 10.1016/j.jcmg.2010.09.023. [DOI] [PMC free article] [PubMed] [Google Scholar]
- 17.Sole MJ, Liu P. Viral myocarditis: a paradigm for understanding the pathogenesis and treatment of dilated cardiomyopathy. J Am Coll Cardiol. 1993;22:99A–105A. doi: 10.1016/0735-1097(93)90470-l. [DOI] [PubMed] [Google Scholar]
- 18.Rolf A, Nef HM, Mollmann H, Troidl C, Voss S, Conradi G, Rixe J, Steiger H, Beiring K, Hamm CW, Dill T. Immunohistological basis of the late gadolinium enhancement phenomenon in tako-tsubo cardiomyopathy. Eur Heart J. 2009;30:1635–1642. doi: 10.1093/eurheartj/ehp140. [DOI] [PubMed] [Google Scholar]
- 19.Arai AE. Using magnetic resonance imaging to characterize recent myocardial injury: utility in acute coronary syndrome and other clinical scenarios. Circulation. 2008;118:795–796. doi: 10.1161/CIRCULATIONAHA.108.797373. [DOI] [PMC free article] [PubMed] [Google Scholar]
- 20.Eitel I, Friedrich MG. T2-weighted cardiovascular magnetic resonance in acute cardiac disease. J Cardiovasc Magn Reson. 2011;13:13. doi: 10.1186/1532-429X-13-13. [DOI] [PMC free article] [PubMed] [Google Scholar]
- 21.Aletras AH, Kellman P, Derbyshire JA, Arai AE. ACUT2E TSE-SSFP: a hybrid method for T2-weighted imaging of edema in the heart. Magn Reson Med. 2008;59:229–235. doi: 10.1002/mrm.21490. [DOI] [PubMed] [Google Scholar]
- 22.Kellman P, Aletras AH, Mancini C, McVeigh ER, Arai AE. T2-prepared SSFP improves diagnostic confidence in edema imaging in acute myocardial infarction compared to turbo spin echo. Magn Reson Med. 2007;57:891–897. doi: 10.1002/mrm.21215. [DOI] [PMC free article] [PubMed] [Google Scholar]
- 23.Friedrich MG, Strohm O, Schulz-Menger J, Marciniak H, Luft FC, Dietz R. Contrast media-enhanced magnetic resonance imaging visualizes myocardial changes in the course of viral myocarditis. Circulation. 1998;97:1802–1809. doi: 10.1161/01.cir.97.18.1802. [DOI] [PubMed] [Google Scholar]
- 24.Nef HM, Mollmann H, Kostin S, Troidl C, Voss S, Weber M, Dill T, Rolf A, Brandt R, Hamm CW, Elsasser A. Tako-Tsubo cardiomyopathy: intraindividual structural analysis in the acute phase and after functional recovery. Eur Heart J. 2007;28:2456–2464. doi: 10.1093/eurheartj/ehl570. [DOI] [PubMed] [Google Scholar]
- 25.Cooper LT, Virmani R, Chapman NM, Frustaci A, Rodeheffer RJ, Cunningham MW, McNamara DM. National Institutes of Health-sponsored workshop on inflammation and immunity in dilated cardiomyopathy. Mayo Clin Proc. 2006;81:199–204. doi: 10.4065/81.2.199. [DOI] [PubMed] [Google Scholar]
- 26.Stensaeth KH, Fossum E, Hoffmann P, Mangschau A, Klow NE. Clinical characteristics and role of early cardiac magnetic resonance imaging in patients with suspected ST-elevation myocardial infarction and normal coronary arteries. Int J Cardiovasc Imaging. 2010;27:355–365. doi: 10.1007/s10554-010-9671-7. [DOI] [PMC free article] [PubMed] [Google Scholar]


