

Abstract
The abnormal vasculature of the tumor microenvironment supports progression and resistance to treatment. Judicious application of anti-angiogenic therapy may normalize the structure and function of the tumor vasculature, promoting improved blood perfusion. However, there has been a lack of direct clinical evidence for improvements in blood perfusion after anti-angiogenic therapy. In this study, we used MRI to assess tumor blood perfusion in 30 recurrent glioblastoma patients who were undergoing treatment with cediranib, a pan-VEGF receptor tyrosine kinase inhibitor. Tumor blood perfusion increased durably for more than one month in 7 of 30 patients where it was associated with longer survival. Together, our findings offer direct clinical evidence in support of the hypothesis that vascular normalization promotes tumor regression and longer patient survival.
Keywords: Glioblastoma, anti-VEGF, vascular normalization, blood perfusion, survival
INTRODUCTION
Bevacizumab, a vascular endothelial growth factor (VEGF)-specific antibody, was conditionally approved in 2009 for treatment of patients with recurrent glioblastoma (rGBM), based on two phase II trials showing notable anti-tumor activity alone or in combination with adjuvant chemotherapy1,2. However, whether bevacizumab treatment leads to longer survival in rGBM patients in a phase III trial is not known, nor are the precise mechanisms of survival benefit. A recent pre-clinical study has shown that anti-VEGF therapy reduces tumor blood perfusion and increases invasiveness in GBM, casting doubt on any survival benefit3. In contrast, a number of pre-clinical studies have shown that judicious application of anti-VEGF agents can transiently “normalize” the abnormal tumor vessels, and this normalization can reduce vascular permeability, edema and hypoxia as well as improve the delivery and efficacy of various therapies4–7. Indeed, a phase II trial showed that cediranib, a pan-VEGF receptor tyrosine kinase inhibitor, can normalize the blood vessels of rGBM8, and more crucially, the extent of vascular normalization by day 1 correlated with both progression-free survival (PFS) and overall survival (OS)9. Furthermore, serial MR spectroscopy showed that cediranib also had a direct metabolic effect on rGBM in patients who survived longer10.
Although the first human evidence for vascular normalization in rectal carcinomas11, increased vessel maturation and decreased interstitial fluid pressure, was followed by further evidence for normalization in rGBMs by less permeable and more normal-sized vessels and reduced edema8, direct evidence for increased blood perfusion in human tumors - a potential consequence of vascular normalization - is not yet available. Glioblastomas have inefficient, irregular vessels that are leaky and dilated with haphazard pattern of interconnection and their baseline blood perfusion rate on average is lower than that of the surrounding normal brain5,6.
As depicted in Figure 1, anti-angiogenic therapy might affect tumor vessels in three different ways: no effect at all; excessive destruction of blood vessels and reduction in perfusion leading to increased hypoxia, necrosis and/or invasion; or after pruning of some abnormal vessels the structure of remaining tumor vessels might become closer to normal vessels potentially resulting in an increase in absolute blood perfusion5. To this end, we measured the changes in tumor blood perfusion during the course of treatment with cediranib using advanced MRI methods in 30 rGBM patients, and show for the first time that tumor blood perfusion indeed increased in a subset of patients undergoing VEGF-treatment and that these patients survived approximately 6-months longer than patients whose tumor blood perfusion did not increase.
Figure 1. Vascular Normalization Hypothesis.

Schematic of the effects of anti-angiogenic therapy on tumor vascular structure and blood perfusion5. Compared to normal vessels (left), the tumor vasculature (center) is less efficient. After anti-angiogenic therapy, the tumor vasculature might become “normalized”, resulting in increased blood perfusion (top right); or not respond to therapy (center right); or be markedly pruned leading to decreased blood perfusion (bottom right).
METHODS
Patient Population
We included 30 subjects with confirmed rGBM in this prospective study of cediranib (AstraZeneca) sponsored by the NCI (NCT00035656)12. The study was approved by the institutional Review Board and informed consent was obtained from all patients. After study termination, 9 of the 30 patients received one subsequent cycle of salvage chemotherapy, 8 patients received two cycles, 1 patient received three cycles, 2 patients had undisclosed information and 1 patient received stereotactic radiosurgery.
MR Imaging
Our MRI protocol including (1H-MRS) spectroscopy has previously been described8–10. In addition, arterial spin-labeling (ASL) perfusion images (QUIPSS II13) were acquired with repetition-time=2.0s, echo-time=12ms, resolution=3.44mm/3.44mm/5mm, matrix-size=64/64, 6/180 slices/volumes and inversion-times=700ms/1800ms. Metabolitic concentrations of N-acetylaspartate (NAA), choline (Cho) and normal-side creatine (norCre) were assessed to derive ratios for NAA/Cho, NAA/norCre and Cho/norCre and normalized to healthy tissue10.
Volumetrics, Permeability maps and Perfusion analysis
Tumor regions-of-interests were drawn by an experienced neuroradiologist on FLAIR- and contrast-enhanced T1-weighted images8,9. The DCE data were processed to create Ktrans maps8, a measure of the permeability-surface area product. Blood perfusion and blood volume were calculated using established models on the DSC data in nordicICE and corrected for contrast- agent leakage14. Also, to minimize T1-shortening effects, the contrast-agent pre-dose from DCE was used to saturate leaky tissue from blood-brain barrier breakdown or resection. Patient-specific variations were reduced by automatic arterial input function selection and partial volume correction before normalized to normal-appearing gray- and white-matter tissue14. Blood perfusion by ASL were derived in Matlab as previously described13 - including quantitative T1 mapping.
Statistical analysis
Changes in perfusion after therapy onset were assessed by applying a highly conservative threshold in which changes in the tumor-to-reference tissue perfusion ratios had to be higher or lower than the 95% confidence interval of the variations across patients [98%–107%; baseline set to 100%], derived from the within-patient percent perfusion changes between the two baseline time points. Also, a perfusion increase or decrease had to be consistent for two or more consecutive time points equal to one month of imaging or more. We used paired Wilcoxon test, with Holm-Bonferroni corrections for multiple comparisons, to assess changes over time. Groups were compared using Mann-Whitney tests, log-rank test, and Wald test in Cox regression analysis of survival data. P-values <0.05 were considered statistically significant.
RESULTS
The median PFS and OS from time of enrollment for the 30 patients were 111 days (95% confidence-interval; 71–140days) and 220 days (168–285days), respectively, with 23.3% alive and progression free at six months12. Figure 2A show example serial anatomic MRI of a patient with increased perfusion (Figure 2B) compared to perfusion in reference tissue (Figure 2C). Correspondingly, supplementary Figure S1A show serial anatomic MRI of a patient with decreased perfusion (supplementary Figure S1B) compared to perfusion in reference tissue (supplementary Figure S1C). Here, baseline alterations and especially changes in blood perfusion were neither subtle nor limited to regions of contrast enhancement. Importantly, the changes occurred even when the conventional imaging showed signs of tumor response, with decreasing contrast enhancement and mass effect (supplementary Figure S2A), decreasing peritumoral vasogenic edema (supplementary Figure S2B) and decreasing permeability (supplementary Figure S2C).
Figure 2. Increased Perfusion.

Representative example of a patient with perfusion increase. (A) Anatomic MRI showing decrease in the contrast enhanced tumor area with blue ovals indicating tumor region. (B) Blood perfusion maps showing increasing perfusion. (C) Histogram analysis of enhancing tumor showing increase and normalization of perfusion compared to reference tissue.
Durable increase in tumor perfusion of at least one month duration was seen in 7 patients (supplementary Figure S3A), stable perfusion in 12 patients (supplementary Figure S3B) and durable decrease in tumor perfusion in 11 patients (supplementary Figure S3C). Figure 3A shows the group means over time, also showing that all groups tended to eventually exhibit increased perfusion, or reverse and return to pre-treatment perfusion values, after one or two months of imaging8. Compared to pretreatment values, patients with an increase in perfusion showed an average increase in perfusion of >5% (day +1), >10% (days +28 and +56) and >15% (day +112). Individual time courses for all patients are shown in supplementary Figure S3. These perfusion-metrics focus on capillary-level (microvessel) blood perfusion, but similar, supporting results are present for total (macrovessel) blood perfusion (supplementary Figure S4A and using microvessel perfusion groups in supplementary Figure S4B) and ASL (macrovessel perfusion groups; supplementary Figure S5A and microvessel perfusion groups; supplementary Figure S5B). Test-retest (supplementary Figure S6A) and between baseline (supplementary Figure S6B) reproducibility analysis showed minimal variability of the microvessel blood perfusion technique.
Figure 3. Perfusion Response to Treatment and Survival analysis.

(A) Three types of perfusion response to anti-angiogenic treatment are evident: perfusion increase, stable perfusion or perfusion decrease. Figure show log-scaled averaged values (±SEM) and P-values from Kruskal-Wallis tests (Holm-Bonferroni corrected). Values at day −1 were set as 100%. (B) Kaplan-Meier analysis for progression-free survival. (C) Kaplan-Meier analysis for overall survival. Patients with an increase in tumor perfusion had prolonged PFS compared patients with stable perfusion, and prolonged OS compared to patients with stable and decreased perfusion (Mann-Whitney; P<0.01, Holm-Bonferroni corrected). Differences between PFS and OS may be attributed to the inherent uncertainty of the PFS estimate by the Macdonald criteria – since anti-VEGF agents decrease vascular permeability resulting in decreased contrast in the absence of an anti-tumor effect4.
An increase in tumor perfusion was associated with prolonged PFS (Figure 3B) and OS (Figure 3C). Patients with increased tumor blood perfusion had a median OS of 348 days, as compared to those with decreased tumor blood perfusion (213 days) and stable tumor perfusion (169 days) (Mann-Whitney; P<0.01, supplementary Table S1). Using Cox regression with time dependent covariates, the effect of increased blood perfusion remained a significant predictor of PFS and OS after adjusting for T1-weighted and FLAIR tumor volume changes during treatment as well as salvage chemotherapy and stereotactic radiosurgery after study termination (P<0.05). Potential prognostic factors for outcome9, including age, pretreatment T1-weighted tumor volume, extent of resection, neurological performance and mental status were not statistically significant in Cox regression that included perfusion changes. Tested against a vascular normalization index (VNI) - reflecting decreases in permeability and microvessel blood volume and increase in circulating collagen IV levels – an early predictor of PFS and OS after one day of anti-angiogenic treatment9, patients with an increase in microvessel perfusion showed significantly higher VNI values (0.48±0.24 mean±SEM) compared to patients with stable (−0.44±0.13) or decreased perfusion (−0.51±0.26) (Mann-Whitney; P<0.05) (Figure 4). Furthermore, for patients with increased perfusion and compared to pretreatment ratios, tumor metabolic ratios of NAA/norCre were significantly higher at days +28 (1.89±0.28) and +56 (1.38±0.51) and at day +28 (1.52±0.37) for Cho/norCre (Wilcoxon signed-rank; P<0.05) (supplementary Figure S7).
Figure 4. Relationship Between Microvessel Perfusion and a Vascular Normalization Index (VNI).
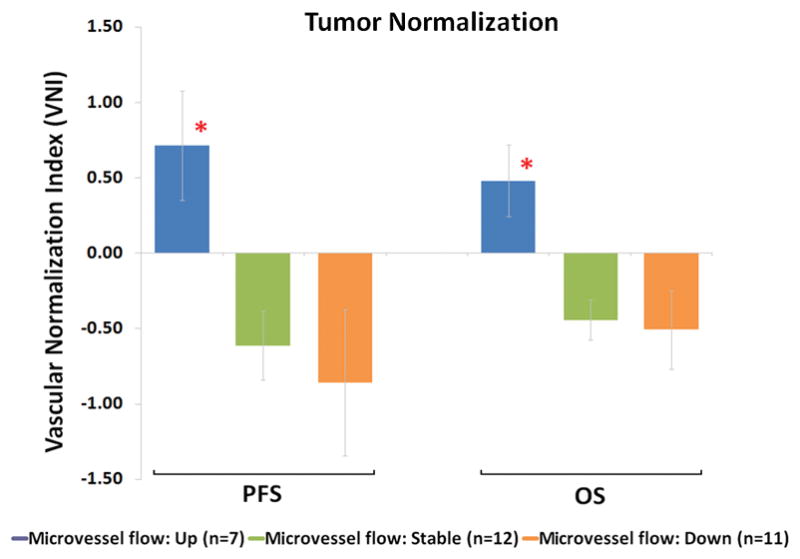
Patients with an increase in perfusion showed significantly higher VNI values compared to patients with stable or decreased perfusion for PFS and OS (*Mann-Whitney; P<0.05, Holm-Bonferroni corrected). A higher VNI value is also associated with increased PFS and OS9. Although perfusion and blood volume are inherently associated, but not identical, the relationship between perfusion changes and VNI indicate that increased perfusion could be a result of decreased vascular permeability.
DISCUSSION
The advent of anti-angiogenesis therapy has been a welcome advance in cancer treatment, yet it has been associated with some controversy. The initially proposed mechanism of benefit, namely, starving the cancer by elimination or reduction of tumor vasculature, does not seem to fit with clinical observations, particularly the of lack of a clear dose-response relationship and the lack of benefit in the absence of concomitant cytotoxic therapy5,6,8,9. Theoretically, administration of anti-VEGF should reduce the effect of chemotherapy by reducing the supply of drug via elimination of blood vessels. Additionally, the resulting hypoxia should reduce the effectiveness of drugs5,6. Yet, no anti-VEGF trial in patients with metastatic disease has shown a decline in OS compared to chemotherapy alone6. One possible explanation for these findings is vascular normalization whereby anti-VEGF treatments, when used in judicious doses, can normalize abnormal vessel structures, potentially leading to increased blood perfusion. In fact, a number of pre-clinical studies have shown that anti-angiogenic agents can improve oxygenation and/or drug delivery6. However, human data on increased blood perfusion, oxygenation or drug levels are lacking.
To this end, our data provide three key insights. First, vascular changes in rGBM after anti-angiogenic therapy, including increased perfusion, clearly occur and occur durably. Importantly, perfusion does not increase in all patients, only in about one quarter of the patients. Second, vascular changes occur not only in regions most traditionally associated with rGBM – that is, in the area of blood-brain barrier breakdown – but also in surrounding areas. Third, and most provocative, this increase in blood perfusion is associated with prolonged survival.
The most straightforward explanation for these observations is that the increased tumor blood perfusion is simply a result of decreased permeability of normalized blood vessels – as the patient group with increased tumor blood perfusion had the highest VNI. This is consistent with a mathematical model showing that high vascular permeability can lead to perfusion stasis, and conversely, a decrease in permeability can increase perfusion15 and another model showing that the decreased permeability also leads to a reduction in edema16. We have previously shown in pre-clinical data that edema reduction alone by cediranib can account for increased survival without affecting tumor growth4. However, edema control alone does not fully explain the improved survival – as we also observed direct metabolic effects of cediranib in rGBMs in some of the longer surviving patients10. There are two potential explanations for this metabolic response.
First, since cediranib is a multi-receptor tyrosine kinase inhibitor and some of these receptors are present on GBM cells8, it is conceivable that the normalized vessels permit a better delivery of cediranib to the GBM cells leading to a better anti-tumor effect. Killing of cancer cells surrounding blood vessels can open up compressed blood vessels, and in turn, also increase blood perfusion17. Thus cediranib acts as a combined vascular normalizing agent and anti-cancer agent both contributing to increased tumor blood perfusion. Consequently, the patients with increased blood perfusion - and a higher VNI - benefit from both better anti-edema and anti-cancer effects. This could potentially explain why some patients with decreased blood perfusion had no OS gain - despite decreased vascular permeability and edema – suggesting a lack of anti-cancer effect by cediranib in these patients.
A second explanation might be that vascular remodeling and resulting increased perfusion and delivery improve the innate immune response18,19, an emerging and compelling concept. A recent study offers evidence that targeting abnormal polarization of tumor-associated macrophages (TAMs) can normalize tumor vessels and also enhance antitumor immunity19. Also, a more even distribution of blood perfusion with a subsequent reduction in areas of hypoxia and acidosis6 can further increase immune response as hypoxia and also low pH compromise the cytotoxic functions of tumor-infiltrating immune cells20. Thus, patients whose tumor blood perfusion did not increase did not benefit from immunostimulation resulting from reduced hypoxia.
In summary, our data are consistent with the vascular normalization hypothesis, and suggest that improvement in survival in response to anti-VEGF therapy may be mediated by mechanisms other than vascular pruning and tumor “starvation”. Whether bevacizumab has similar effects in glioblastoma remains to be determined and is a high-priority research question for the field.
Supplementary Material
Acknowledgments
Financial support
USPHS grants R21CA117079, S10RR023401, S10RR019307, S10RR019254, S10RR023043, S10RR021110, R01CA137254, R01CA129371, 5R01NS060918, K24CA125440, P01CA80124. Saic-Frederick Inc. grant 26XS263
Norwegian Research Council grant 191088/V50
Harvard Catalyst grant M01-RR-01066
This work was conducted with support from Harvard Catalyst | The Harvard Clinical and Translational Science Center (NIH Award #UL1 RR 025758, M01-RR-01066 and financial contributions from Harvard University and its affiliated academic health care centers). The content is solely the responsibility of the authors and does not necessarily represent the official views of Harvard Catalyst, Harvard University and its affiliated academic health care centers, the National Center for Research Resources, or the National Institutes of Health.
Footnotes
Conflicts of interest
AGS: Grant support; National Cancer Institute, National Institutes of Health. Consultant/Advisory boards; ACR-Image Metrix, BayerScheringPharma, Bristol Meyers Squibb, BiogenIdec, Merrimack Pharmaceuticals, Olea Medical, Mitsubishi Pharma, GE Healthcare, Regeneron, Novartis, Roche, Siemens Medical, Takeda, AstraZeneca, National Institutes of Health, Kit, Inc.
KEE: Grant support; Norwegian Research Council
PYW: Research Support: Merck, Sanofi-Aventis, Genentech, Novartis, Medimmune, AstraZeneca, Amgen, Vascular Biogenics, Genzyme
TTB: Consultant/Advisory boards; Merck, Roche/Genentech, Amgen, Spectrum, Exelixis. Grant support: Millennium, AstraZeneca, Pfizer
RKJ: Grant support; National Cancer Institute, Dyax, MedImmune, Roche. Consultant/Advisory boards; Dyax, Noxxon, SynDevRx, Xtuit.
References
- 1.Friedman HS, Prados MD, Wen PY, Mikkelsen T, Schiff D, Abrey LE, et al. Bevacizumab alone and in combination with irinotecan in recurrent glioblastoma. J Clin Oncol. 2009;27:4733–40. doi: 10.1200/JCO.2008.19.8721. [DOI] [PubMed] [Google Scholar]
- 2.Kreisl TN, Kim L, Moore K, Duic P, Royce C, Stroud I, et al. Phase II trial of single-agent bevacizumab followed by bevacizumab plus irinotecan at tumor progression in recurrent glioblastoma. J Clin Oncol. 2009;27:740–5. doi: 10.1200/JCO.2008.16.3055. [DOI] [PMC free article] [PubMed] [Google Scholar]
- 3.Keunen O, Johansson M, Oudin A, Sanzey M, Rahim SA, Fack F, et al. Anti-VEGF treatment reduces blood supply and increases tumor cell invasion in glioblastoma. Proc Natl Acad Sci U S A. 2011;108:3749–54. doi: 10.1073/pnas.1014480108. [DOI] [PMC free article] [PubMed] [Google Scholar]
- 4.Kamoun WS, Ley CD, Farrar CT, Duyverman AM, Lahdenranta J, Lacorre DA, et al. Edema control by cediranib, a vascular endothelial growth factor receptor-targeted kinase inhibitor, prolongs survival despite persistent brain tumor growth in mice. J Clin Oncol. 2009;27:2542–52. doi: 10.1200/JCO.2008.19.9356. [DOI] [PMC free article] [PubMed] [Google Scholar]
- 5.Jain RK. Normalizing tumor vasculature with anti-angiogenic therapy: a new paradigm for combination therapy. Nat Med. 2001;7:987–9. doi: 10.1038/nm0901-987. [DOI] [PubMed] [Google Scholar]
- 6.Goel S, Duda DG, Xu L, Munn LL, Boucher Y, Fukumura D, et al. Normalization of the vasculature for treatment of cancer and other diseases. Physiological Reviews. 2011;91:1071–121. doi: 10.1152/physrev.00038.2010. [DOI] [PMC free article] [PubMed] [Google Scholar]
- 7.Winkler F, Kozin SV, Tong RT, Chae SS, Booth MF, Garkavtsev I, et al. Kinetics of vascular normalization by VEGFR2 blockade governs brain tumor response to radiation: role of oxygenation, angiopoietin-1, and matrix metalloproteinases. Cancer Cell. 2004;6:553–63. doi: 10.1016/j.ccr.2004.10.011. [DOI] [PubMed] [Google Scholar]
- 8.Batchelor TT, Sorensen AG, di Tomaso E, Zhang WT, Duda DG, Cohen KS, et al. AZD2171, a pan-VEGF receptor tyrosine kinase inhibitor, normalizes tumor vasculature and alleviates edema in glioblastoma patients. Cancer Cell. 2007;11:83–95. doi: 10.1016/j.ccr.2006.11.021. [DOI] [PMC free article] [PubMed] [Google Scholar]
- 9.Sorensen AG, Batchelor TT, Zhang WT, Chen PJ, Yeo P, Wang M, et al. A “vascular normalization index” as potential mechanistic biomarker to predict survival after a single dose of cediranib in recurrent glioblastoma patients. Cancer Res. 2009;69:5296–300. doi: 10.1158/0008-5472.CAN-09-0814. [DOI] [PMC free article] [PubMed] [Google Scholar]
- 10.Kim H, Catana C, Ratai EM, Andronesi OC, Jennings DL, Batchelor TT, et al. Serial magnetic resonance spectroscopy reveals a direct metabolic effect of cediranib in glioblastoma. Cancer Res. 2011;71:3745–52. doi: 10.1158/0008-5472.CAN-10-2991. [DOI] [PMC free article] [PubMed] [Google Scholar]
- 11.Willett CG, Boucher Y, di Tomaso E, Duda DG, Munn LL, Tong RT, et al. Direct evidence that the VEGF-specific antibody bevacizumab has antivascular effects in human rectal cancer. Nat Med. 2004;10:145–7. doi: 10.1038/nm988. [DOI] [PMC free article] [PubMed] [Google Scholar]
- 12.Batchelor TT, Duda DG, di Tomaso E, Ancukiewicz M, Plotkin SR, Gerstner E, et al. Phase II study of cediranib, an oral pan-vascular endothelial growth factor receptor tyrosine kinase inhibitor, in patients with recurrent glioblastoma. J Clin Oncol. 2010;28:2817–23. doi: 10.1200/JCO.2009.26.3988. [DOI] [PMC free article] [PubMed] [Google Scholar]
- 13.Wong EC, Buxton RB, Frank LR. Implementation of quantitative perfusion imaging techniques for functional brain mapping using pulsed arterial spin labeling. NMR Biomed. 1997;10:237–49. doi: 10.1002/(sici)1099-1492(199706/08)10:4/5<237::aid-nbm475>3.0.co;2-x. [DOI] [PubMed] [Google Scholar]
- 14.Bjornerud A, Emblem KE. A fully automated method for quantitative cerebral hemodynamic analysis using DSC-MRI. J Cereb Blood Flow Metab. 2010;30:1066–78. doi: 10.1038/jcbfm.2010.4. [DOI] [PMC free article] [PubMed] [Google Scholar]
- 15.Netti PA, Roberge S, Boucher Y, Baxter LT, Jain RK. Effect of transvascular fluid exchange on pressure-flow relationship in tumors: a proposed mechanism for tumor blood flow heterogeneity. Microvasc Res. 1996;52:27–46. doi: 10.1006/mvre.1996.0041. [DOI] [PubMed] [Google Scholar]
- 16.Jain RK, Tong RT, Munn LL. Effect of vascular normalization by antiangiogenic therapy on interstitial hypertension, peritumor edema, and lymphatic metastasis: insights from a mathematical model. Cancer Res. 2007;67:2729–35. doi: 10.1158/0008-5472.CAN-06-4102. [DOI] [PMC free article] [PubMed] [Google Scholar]
- 17.Padera TP, Stoll BR, Tooredman JB, Capen D, di Tomaso E, Jain RK. Pathology: cancer cells compress intratumour vessels. Nature. 2004;427:695. doi: 10.1038/427695a. [DOI] [PubMed] [Google Scholar]
- 18.Huang Y, Snuderl M, Jain RK. Polarization of tumor-associated macrophages: a novel strategy for vascular normalization and antitumor immunity. Cancer Cell. 2011;19:1–2. doi: 10.1016/j.ccr.2011.01.005. [DOI] [PMC free article] [PubMed] [Google Scholar]
- 19.Rolny C, Mazzone M, Tugues S, Laoui D, Johansson I, Coulon C, et al. HRG inhibits tumor growth and metastasis by inducing macrophage polarization and vessel normalization through downregulation of PlGF. Cancer Cell. 2011;19:31–44. doi: 10.1016/j.ccr.2010.11.009. [DOI] [PubMed] [Google Scholar]
- 20.Ganss R, Arnold B, Hammerling GJ. Mini-review: overcoming tumor-intrinsic resistance to immune effector function. Eur J Immunol. 2004;34:2635–41. doi: 10.1002/eji.200425474. [DOI] [PubMed] [Google Scholar]
Associated Data
This section collects any data citations, data availability statements, or supplementary materials included in this article.