Abstract
There is significant interest in the development of methods with the potential to increase access to ‘the interactome’ for both experimental and clinical applications. Immunoprecipitation detected by flow cytometry (IP-FCM) is a robust, biochemical method that can be used for measuring physiologic protein-protein interactions (PPI) in multiprotein complexes (MPC) with high sensitivity. Because it is based on antibody-mediated capture of protein complexes onto microspheres, IP-FCM is potentially compatible with a multiplex platform that could allow simultaneous assessment of many physiologic PPI. Here, we consider the principles of ambient analyte conditions (AAC) and inter-bead independence, and provide a template set of experiments showing how to convert singleplex IP-FCM to multiplex IP-FCM, including assays to confirm the validity of the experimental conditions for data acquisition. We conclude that singleplex IP-FCM can be successfully upgraded to multiplex format, and propose that the unique strengths of multiplex IP-FCM make it a method that is likely to facilitate the acquisition of new PPI data from primary cell sources.
Keywords: Protein-protein interaction, multiprotein complex, multiplex, flow cytometry, IP-FCM
1. Introduction
Biological processes are initiated and carried out by biochemical interactions between molecular components, and the summation of all such possible interactions is collectively termed “the interactome” (1). As a field of study, Interactomics represents an exciting frontier in which progress is currently limited by both assay and analytical tools, to a degree beyond that which applies to Genomics or Proteomics (2). Whereas these latter fields focus mostly on the identity and expression level of molecular species, the output information of these sciences is the input information for Interactomics. A complete Interactomic profile, which does not yet exist, would measure all possible combinations of interactions between molecules as reported by other ‘omics’ methods, and add exponential matrix-level interaction complexity that is even more data intensive than its Genomics/Proteomics parent sciences. To progress in this direction, there is great interest in the generation of assay and analytical tools that improve the accessibility of the interactome to experimentation, diagnosis, pharmacology, and medicine.
We and others have described immunoprecipitation detected by flow cytometry (IP-FCM) as a useful method for assessing the physiologic protein-protein interactions (PPI) within multiprotein complexes (MPC) (3–12). IP-FCM represents a candidate approach to PPI analysis relying on the use of immunoprecipitation (IP) antibodies (Ab) coupled to polystyrene latex microspheres to immunoprecipitate proteins (primary analytes) from cell lysates; subsequently, fluorochrome-conjugated Abs probe interacting proteins (secondary analytes) for identification and quantification of proteins present in shared complexes. Strengths of the IP-FCM method include: (i) it allows a robust, quantitative or semi-quantitative biochemical assessment of native PPI with up to attomole sensitivity; (ii) no genetic engineering, epitope tagging, or radioactive labeling is required, allowing application to samples from wild-type subjects and clinical patients; (iii) it is compatible with multi-well plate-based high-throughput formatting; (iv) it is effective for assessing transmembrane as well as cytosolic/secreted proteins. Additionally, because both commercial and academic organizations are attempting to generate monoclonal Abs specific for all open reading frames of the human genome (13), we predict that IP-FCM could eventually be used to provide access to a significant portion of the interactome.
Converting IP-FCM from single- to multiplex format will help achieve this goal, allowing measurement of many PPI simultaneously. In technological terms, similar bead-based multiplex assays are already available from commercial and academic sources as robust laboratory developed tests (LDT), which typically measure the expression level of 5–30 analytes per sample (14, 15). However, there are two assay conditions that are often assumed in common multiplex bead assays, which are absolutely critical for multiplex bead-based PPI experimentation and must be directly monitored: (i) inter-bead independence, and (ii) analyte non-depletion. To illustrate by contrast, in a multiplex bead array for cytokines, an analyte such as IL-2 is measured on one bead type only, and is not expected to be present on beads assessing other cytokines; however, in a multiplex PPI experiment, a hypothetical analyte “A” might be expressed in complexes with several different proteins, and could thus be co-immunoprecipitated on several bead types within the multiplex set. Inter-bead independence is achieved when measurement of analyte “A” on one bead does not affect its measurement on another bead, allowing all beads to provide accurate data. One common way to fail to meet this criterion is if protein capture on the multiplex bead set causes analyte depletion from the sample, such that the assay itself decreases the analyte(s) that must be measured, erroneously lowering detection levels. In other words, “ambient analyte” conditions (AAC) must be met for all analytes involved in multiplex IP-FCM experimentation. Recent careful work by Joos (16, 17), Kelso (18) and their colleagues have highlighted this idea with microsphere-based assays, reminding the field of early work by Ekins (19, 20) who enunciated the concept of AAC.
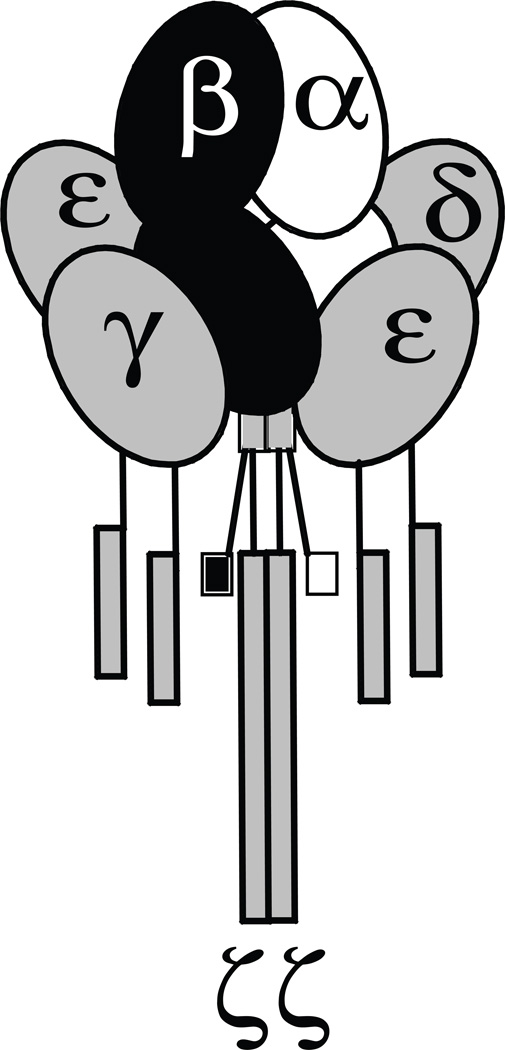
Using the T cell antigen receptor (TCR) as a biomedically relevant model of a stable, membrane resident MPC (Fig. 1 and Ref. (21)), we demonstrate how to convert singleplex to multiplex IP-FCM. First, we illustrate the basic methods involved in microsphere coupling, assay design, and implementation. Second, we demonstrate how to determine lysate and assay conditions that are predicted to fulfill inter-bead independence and AAC criteria under multiplex conditions. Third, independence of each bead class in the multiplex array is confirmed. Fourth, AAC is confirmed under multiplex conditions. Thus, the current work provides a strategy to first predict and subsequently confirm valid multiplex PPI assay conditions for multiplex IP-FCM, using a work-flow intended to serve as a pattern that could be followed for other collections of physiologic PPI or MPC of interest.
Figure 1.
The T cell antigen receptor (TCR) complex serves as a model to study PPI in a stable, membrane-resident multiprotein complex (MPC). Each subunit depicted is part of the constitutively associated TCR complex. Extracellular domains are depicted as ovals, transmembrane domains as vertical lines, and intracellular domains as rectangles. α, TCRα; β, TCRβ; ε, CD3ε; δ, CD3δ; γ, CD3γ; ζ, CD3ζ.
2. Materials and Methods
2.1 Materials
The materials previously described for singleplex IP-FCM (6–8) were used here, with some additions. The following Abs were purchased from BD in purified and/or phycoerythrin (PE)-conjugated format: H57 (Anti-mouse TCRβ), B20.1 (Anti-mouse TCR Vα2), 30-H12 (Anti-mouse Thy1.2). Abs purified from hybridoma supernatant included: 2C11 (Anti-mouse CD3ε, binds both CD3εγ and εδ heterodimers), 17A2 (Anti-mouse CD3εγ), 7D6 (Anti-mouse CD3εγ). White carboxylate-modified polystyrene latex (CML) beads were purchased from Interfacial Dynamics Corp. (now part of Invitrogen). MagPlex-C Microspheres were purchased from Luminex. Sulfo-N-hydroxysulfosuccinimide (S-NHS) was purchased from Thermo Scientific. Cell lysates were obtained from TOT-1 cells, a spontaneous murine T cell lymphoma harvested from an OT-1 TCR transgenic mouse in our laboratory.
Magnetic IP Beads were washed using the BioPlex Pro II wash station and BioPlex Pro 96-well flat-bottom plates, with TopSeal-A seals from Perkin Elmer. IP beads were analyzed using Luminex X-map technology available in the BioPlex200 system from BioRad. The BioPlex200 system was calibrated with the BioPlex Calibration Kit and validated with the BioPlex validation kit. Multiplex IP-FCM data was analyzed using the BioPlex Manager 6.0 software from BioRad.
2.2 Methods
2.2.1 Singleplex IP-FCM
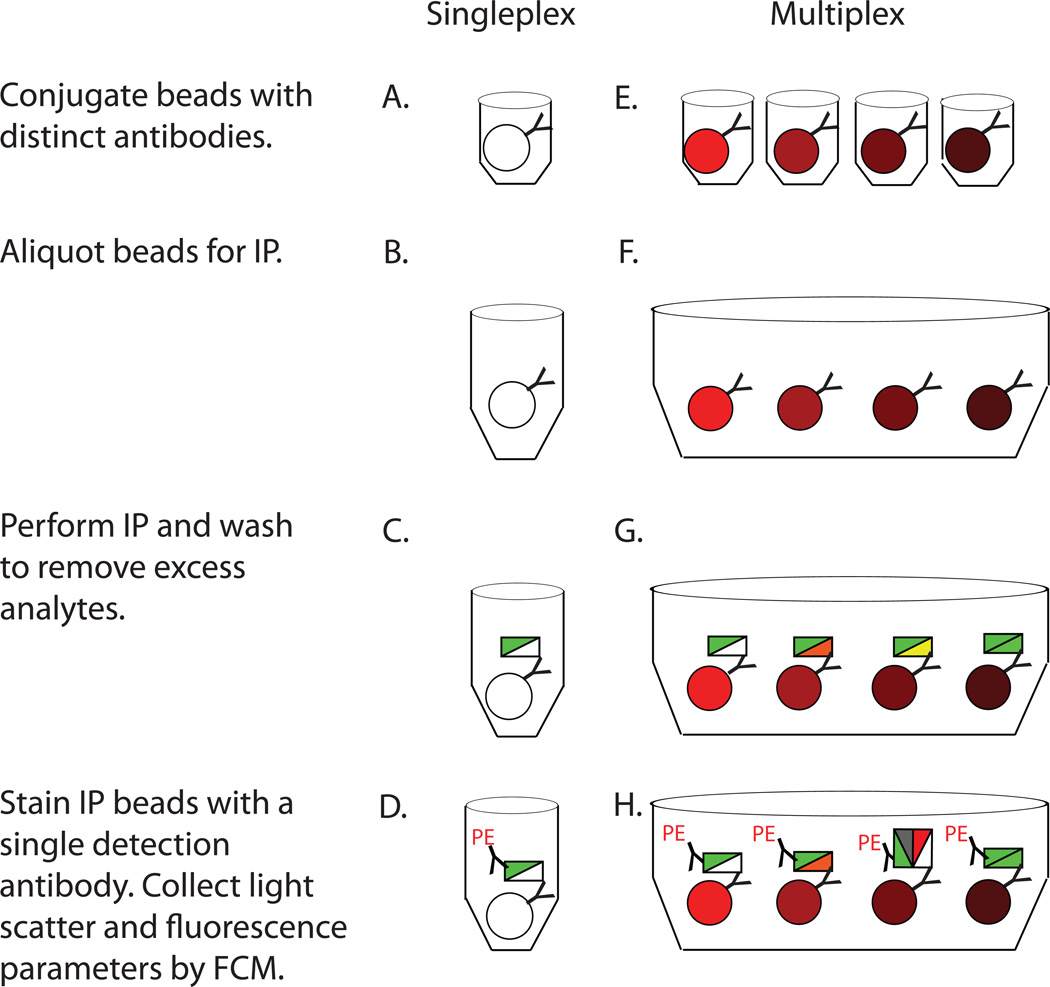
The technical protocol for IP-FCM has been described previously in singleplex format (6–8), which is outlined in general in Figure 2A–D. Briefly, IP beads were generated by conjugating monoclonal Abs to CML microspheres (or “beads”) using the zero-carbon-length crosslinker EDAC and the optional ingredient S-NHS (5 mg/mL, Pierce). Although it does not increase the maximum capture capacity of IP beads, inclusion of S-NHS in the coupling procedure can allow enhanced Ab coupling for low-concentrations of Ab (Supplemental Fig. 1).
Figure 2.
Schematic for singleplex IP-FCM (A–D) and multiplex IP-FCM (E–H). First, beads are conjugated with distinct Abs (A, E). Singleplex IP-FCM (A) involves a single bead type conjugated to a single Ab clone. Multiplex IP-FCM (E) involves multiple distinct Ab-conjugated beads, each with a unique bead classification and Ab specificity. Next, singleplex IP beads are stored (B), while for multiplex, individually conjugated beads are combined into a single tube (F). Next, IP is performed and capture beads are washed to remove excess lysate material. Singleplex IP-FCM (C) allows for direct IP of one primary analyte, depicted as a white triangle, with co-associated protein(s) depicted in green. Multiplex IP-FCM (G) allows direct IP of multiple analytes, depicted as multiple colored triangles, with co-associated protein(s). Finally, IP beads are stained with a single detection Ab, denoted with PE label. The detection Ab stains a single analyte, depicted in green, potentially part of multiple distinct complexes. Singleplex IP-FCM (D) measures a single direct or indirect PPI whereas multiplex IP-FCM (H) measures multiple direct or indirect PPIs. Light scatter and fluorescence parameters are analyzed by FCM.
To capture physiologic TCR complexes, IP-beads were incubated with TOT-1 cell lysate and washed to remove excess lysate (Fig. 2C) as previously described (6, 7). Next, IP beads were stained with a detection Ab specific for the primary or secondary analyte (Fig. 2D). Finally, IP beads were analyzed by flow cytometry (FCM).
2.2.2 Multiplex IP-FCM
Beads internally labeled with specific, unique fluorescent dye combinations (termed bead ‘addresses’ or ‘classes’), were obtained from Luminex. Each bead class was conjugated to a unique Ab specific for a subunit of the TCR complex to create a multiplex set (schematically depicted in Fig. 2E). These IP beads were combined (Fig. 2F) into one tube and distributed into multiple wells of a plate. Multiplex IP was performed (Fig. 2G) with TOT-1 cell lysate, and afterwards excess lysate was washed away. IP beads and co-precipitated analytes were stained with detection Abs, specific for potentially co-associated analytes, using a single probe Ab per well (Fig. 2H). Finally, data from different IP-probe combinations performed in parallel wells were compared. Multiplex IP beads together with co-associated analytes and probes were analyzed using the Bio-Plex 200 flow cytometry system.
2.2.3 Singleplex IP-FCM Analysis
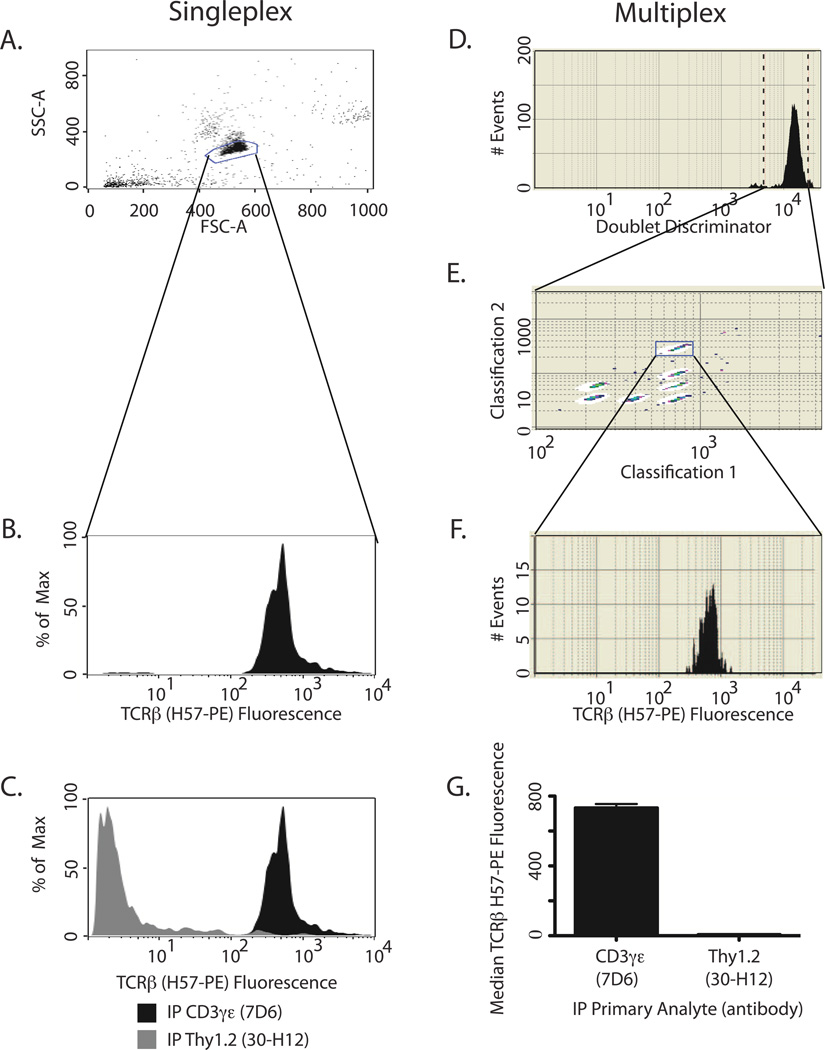
Figure 3A–C presents singleplex IP-FCM data collected on a BD FACSCalibur cytometer and analyzed using FlowJo software. Forward light scatter (FSC) and side light scatter (SSC) were used to identify the singlet bead population (Fig. 3A). PE fluorescence was plotted for the gated IP beads, displaying the amount of co-analyte, TCRβ, associated with the primary analyte, CD3γε (Fig. 3B). To demonstrate the specificity of this interaction, IP for Thy1.2, a highly expressed membrane protein that is not associated with TCR, showed lack of TCR:Thy1.2 interaction (Fig. 3C). Notably, this important negative control requires its own positive control: Thy1.2 can be detected by IP-FCM when it is directly immunoprecipitated itself (Supplemental Fig 2A,B). Therefore, it can be concluded that absence of Thy1.2 in TCR immunoprecipitations demonstrates physical exclusion from the complex, while CD3γε and TCRβ interact with specificity. The Thy1.2 control is useful in either IP or probe format, since IP for TCRβ was also negative when probed with anti-Thy1.2-PE (Supplemental Fig 2C). Together these data demonstrate that IP-FCM detects proteins that interact with specificity, while extraneous proteins are appropriately excluded. In terms of assay sensitivity, we have found that IP-FCM can detect protein interactions within the TCR complex when isolated from only a few hundred cells (Ref. (6) and Supplemental Fig 2 D,E).
Figure 3.
Sample analysis for singleplex IP-FCM (A–C) or multiplex IP-FCM (D–G). First, beads are gated based on light scatter. Singleplex IP-FCM (A) using a BD flow cytometer allows for gating on both forward (FSC) and side (SSC) scatter parameters. Multiplex IP-FCM (D) with BioPlex200 uses the ‘doublet discriminator’ as a light-scatter based gating parameter. Next, beads are gated based on classification for multiplex only (E). Bead fluorescence is then plotted in histogram format to view singleplex (B) or multiplex (F) data. Finally, multiple samples are compared. Singleplex analysis on a BD cytometer (C) allows users to overlay histograms to compare samples, whereas multiplex analysis on a BioPlex200 (G) provides median fluorescence intensity.
2.2.4 Multiplex IP-FCM Analysis
Figure 3D–G illustrates the data analysis steps for multiplex IP-FCM using data collected on the BioPlex200 and analyzed with BioManager software. Multiplex light scatter gating uses the ‘doublet discriminator’ parameter (Fig. 3D). Importantly, the multiplex IP beads are gated a second time using the colorimetric dye combination (Fig. 3E, bead ‘address’ or ‘class’ unique to the multiplex system). PE fluorescence was plotted for the gated IP beads (Fig. 3F), and represents the amount of co-analyte detected in complex with the primary analyte. Sample comparison in the BioPlex system is depicted as median PE fluorescence intensity (Fig. 3G) rather than histogram overlays (Fig. 3C). Negative control IP for Thy1.2 is depicted (Fig. 3G) to demonstrate signal specificity as was described above (section 2.2.3).
3. Results
The data in Figure 3 demonstrated that singleplex IP-FCM could be translated to multiplex-compatible, magnetic beads for use in IP-FCM while retaining high sensitivity and specificity for PPI of the TCR complex. We next wished to perform multiplex IP-FCM using IP Abs specific for several different subunits of the TCR complex. For the data to be accurate, we sought to determine the experimental conditions compatible with inter-bead independence and AAC criteria as described above (section 1, Introduction).
3.1 Titration of bead:lysate ratio to predict AAC compatible assay conditions
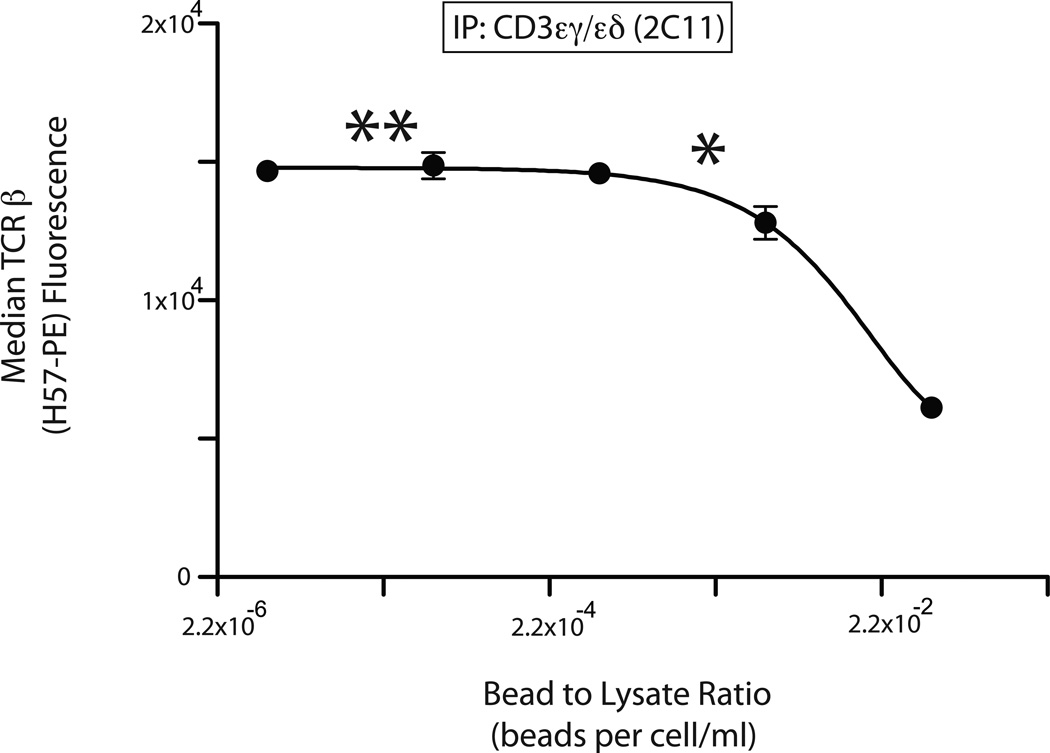
Singleplex IP-FCM was performed using TOT-1 lysate incubated with IP beads specific for CD3εγ/εδ (2C11) and probe-Ab specific for TCRβ (H57-PE). The IPs were performed with titrated bead numbers under conditions of invariant lysate concentration and volume, and a composite number that reflected these conditions was calculated (beads per cells/mL, x-axis Fig. 4). We found that lower numbers of IP beads were able to capture greater average quantities of complexes per bead when compared to higher IP bead numbers; this was presumably because IP with low bead numbers allowed captured complexes to be spread across fewer beads (Fig. 4). We also found that the binding curve displayed a plateau as decreasing IP bead numbers showed maximal protein capture per bead. The prediction is that this plateau region of the curve represents AAC, because decreasing IP beads will capture ever fewer complexes from the lysate, eliminating the opportunity for detectable analyte depletion (16–18). For this particular capture-detection Ab pair, the plateau was from approximately 5 × 10⁻⁶ to 2.2 × 10⁻³ beads per cells/mL within the scale of the experimental measurements. We estimated a ‘one-star point’ (*) as that which represents the maximum beads per lysate on the plateau, and predicted that this * point (2.2 × 10⁻³ beads per cells/mL) would likely fulfill AAC criteria for singleplex experiments.
Figure 4.
Determining maximum signal conditions to predict AAC. Anti-CD3εγ/εδ (2C11) was used to IP TCR complexes from TOT-1 cell lysate using a range of bead to lysate ratios. Complexes captured on the IP beads were stained for co-associated TCRβ using H57-PE. The lowest (rightmost) signal was achieved by incubating 2 × 10⁶ beads with cell lysate consisting of 4 × 10⁶ cells/0.1 mL volume (5 × 10⁻² beads per cells/mL); parallel IPs were performed using bead numbers that were serially diluted by a factor of 10 while maintaining constant the number of cells lysed per total volume. X-axis, bead to lysate ratio (beads per cells/mL). Y-axis, H57 PE fluorescence. (*), maximum bead to lysate ratio predicted to correspond to AAC. (**), bead to lysate ratio predicted to meet AAC for 100-plex experiments involving IPs of similar capture capacity to the 2C11 beads.
For multiplex experiments, however, we may wish to use up to 100 bead classes simultaneously in each tube or well. Therefore we defined a ‘two-star point’ (**) as 2.2 × 10⁻⁵ beads per cells/mL, which identifies 100-fold fewer beads per lysate than the one-star point (*). The prediction is that a 100-plex experiment involving IP beads with equivalent capture capacity to the 2C11 beads, would fulfill AAC criteria and constitute a valid multiplex PPI experiment. Because of these predictions, we performed experiments close to the ** point, 2.3 ×10⁻⁵ beads per cells/mL, for subsequent five-plex IP-FCM analysis in the experiments that follow.
3.2 Inter-bead independence
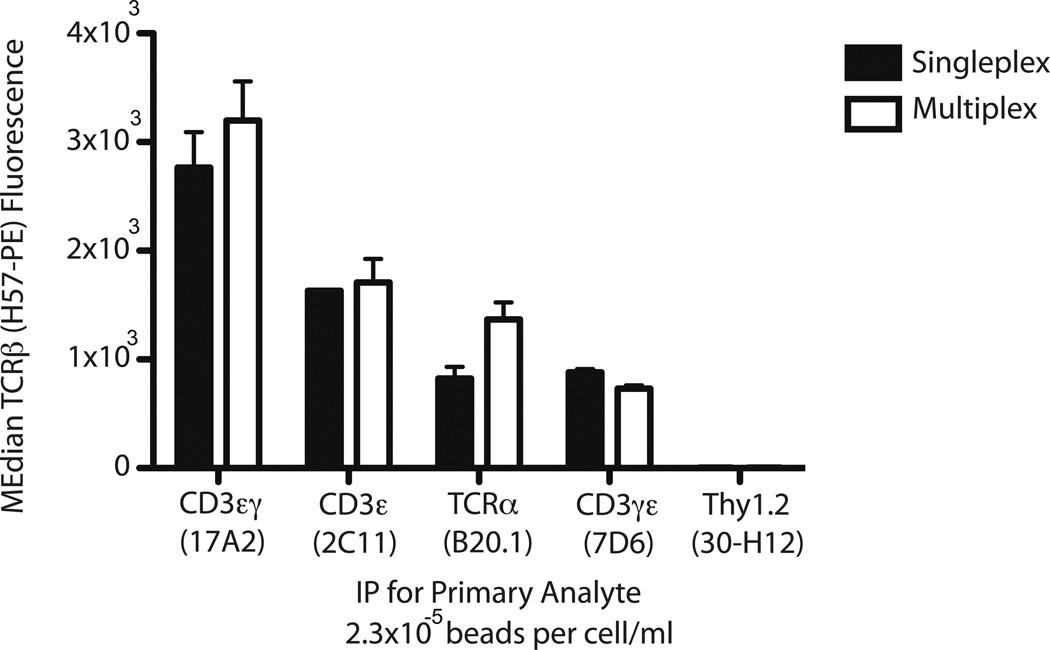
It was possible that the separate bead types composing a multiplex set might interfere with each other and artificially decrease PPI detection. Thus, inter-bead independence was tested by directly comparing single- and multiplex IP-FCM. If the PPI measurements obtained in singleplex were equivalent to those obtained under multiplex conditions, then the various IP beads would demonstrate independence from each other. Figure 5 compares five separate singleplex IPs to one five-plex IP set, where all IPs were performed using parallel identical samples of TOT-1 lysate, under the predicted AAC-compatible conditions determined above (section 3.1). The five IP Abs were specific for CD3εγ (17A2), CD3εγ/εδ (2C11), TCRα (B20.1), CD3εγ (7D6), and Thy1.2 (30-H12), and each was conjugated to a distinct Luminex bead class. Whereas singleplex IP-FCM was performed separately with each lone IP bead type, the five-plex contained all five IP bead types for simultaneous multiplex IP. Thus, several subunits of the complex (CD3εγ, CD3εγ/εδ, and TCRα) were simultaneously immunoprecipitated in one multiplex experiment. Following IP, the beads were stained with H57-PE to measure TCRβ association with each primary analyte (CD3εγ, CD3εγ/εδ, or TCRα). The negative control Ab 30-H12 specific for Thy1.2 confirmed lack of non-specific Thy1.2:TCRβ interactions. Importantly, the multiplex data (Fig. 5, white bars) showed no decrease when compared to the singleplex data (Fig. 5, black bars). Therefore, we conclude that the IP bead combination in this five-plex meets the criterion of inter-bead independence.
Figure 5.
Inter-bead independence is evident by comparing single- to multiplex IP-FCM. IP beads specific for the primary analyte indicated on the x-axis were incubated with TOT-1 cell lysate. For this experiment, 2 × 10³ beads were incubated with cell lysate consisting of 1.75 × 10⁶ cells/0.02 mL lysis volume (2.3 × 10⁻⁵ beads per cells/mL). Captured TCR complexes were stained for co-associated TCRβ, with resulting fluorescence depicted on the y-axis. Black bars, IP-FCM performed in singleplex using the single IP bead indicated. White bars, IP-FCM performed in multiplex using the combination of the five IP beads listed.
3.3 Confirmation of AAC, analyte non-depleting conditions
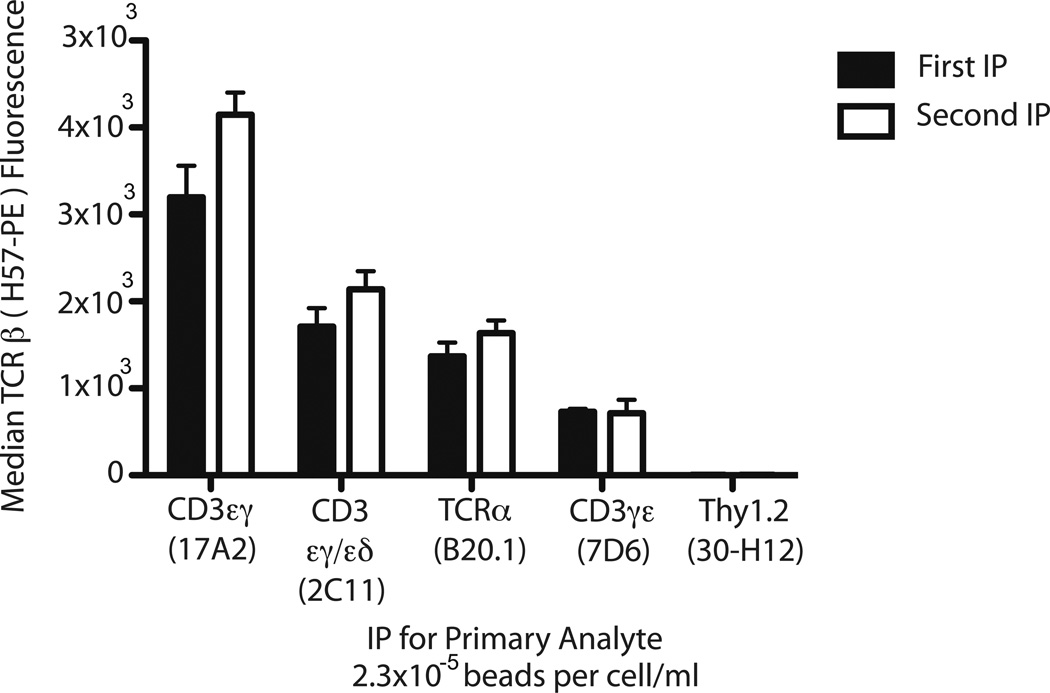
To test for analyte depletion, multiplex IP-FCM was performed with the five-plex bead set described above (section 3.2), and after IP (Fig. 6, black bars, ‘first IP’), each post-IP lysate was transferred to a subsequent identical multiplex IP set (Fig. 6, white bars, ‘second IP’). Both first and second multiplex IP bead sets were stained for TCRβ using H57-PE detection Ab. We observed that the second IP did not display significantly less PPI detection compared to the first IP in the case of each IP bead type, indicating that the first IP occurred without analyte depletion (Fig. 6). In contrast, when IP is performed under other conditions where analyte depletion is favored (2.5 × 10⁻² to 2.5 × 10⁻¹ beads per cells/mL), sequential IP-FCM detects depletion of the TCR complex (Supplemental Fig 3). We conclude that the AAC, analyte non-depleting conditions predicted above (section 3.1) were confirmed in this multiplex PPI analysis of the TCR complex.
Figure 6.
Confirmation of AAC via analyte non-depletion using sequential multiplex IP-FCM. A multiplex IP bead set specific for the primary analytes indicated on the x-axis were incubated with TOT-1 cell lysate. For this experiment, 2 × 10³ beads were incubated with cell lysate consisting of 1.75 × 10⁶ cells/0.02 mL lysis volume (2.3 × 10⁻⁵ beads per cells/mL). After this first IP (black bars), the post-IP lysate was then subjected to a second round of IP with fresh multiplex IP-FCM beads (white bars). Captured TCR complexes were stained for co-associated TCRβ, with resulting fluorescence depicted on the y-axis.
4. Discussion
4.1 Summary
This work presents physiologic PPI analysis using microsphere-based multiplex IP-FCM. Multiplex PPI analysis was applied to the stable, membrane resident, multiprotein TCR complex. We propose three experimental steps that help insure that multiplex PPI experiments generate accurate data. First, IP beads can be titrated in the presence of fixed lysate concentration and volume to determine the bead:lysate ratios that are predicted to fulfill AAC. Second, inter-bead independence can be verified for the experimental conditions of interest by observing equivalent data from both single- and multiplex IP-FCM data. Third, equivalent data obtained from sequential rounds of multiplex IP-FCM verifies that analyte non-depleting conditions, and thus AAC, have been fulfilled. We followed this procedure to predict AAC-compatible conditions for an example PPI, CD3ε:TCRβ. Using those conditions, we verified inter-bead independence and analyte non-depletion of TCR complexes using five-plex format. We conclude that analysis of physiologic PPI using multiplex formatting that meets these criteria can produce accurate data. Future work will focus on using these principles to extend the reach of multiplex IP-FCM by increasing the number of IPs in the multiplex set to acquire access to a greater number of physiologic PPI from cell lysates.
4.2 Recommendations to the user
For each new PPI of interest, the user is encouraged to carefully interpret the fluorescence readout. IP-FCM is capable of measuring the amount of the IP protein, directly interacting proteins, and indirectly interacting proteins, and thus detection of a protein in a shared complex does not indicate the mechanism by which its inclusion in the complex is mediated. In addition to the previously described technical recommendations (6, 7), multiplex users are advised to meet the criteria described here: find the experimental conditions that predict AAC, and test the validity of this prediction by measuring inter-bead dependence and analyte depletion. Following these recommendations allows for successful transition from singleplex to multiplex format using valid experimental conditions for PPI data acquisition.
5. Troubleshooting
In addition to the previously published troubleshooting guidelines (6, 7), we highlight the following points:
Inconsistent bead counts are most often caused by bead settling. Therefore, follow the manufacturers instructions to vortex before aliquotting beads, even if the beads have settled for only approximately one minute. To favor singlet bead suspension, some microsphere guidelines can be found that suggest sonicating beads prior to use: however, currently, we do not sonicate the beads, as we have found that sonication can cause bead sheering, clumping, and loss of product.
For multiplex analysis, small numbers of beads can be carried over from one well to the next, which can potentially alter mean fluorescence intensities reported by analysis software. We recommend that the user monitor bead carry-over, minimize it by sufficient washing steps and optimal machine maintenance, and emphasize median, mode, or geometric mean as central values (not arithmetic mean) during analysis of fluorescence intensity.
6. Potential Applications
IP-FCM allows quantitative or semi-quantitative measurement of physiologic PPI and requires very small amounts of sample material. We demonstrate the ability to detect PPI using only 300–400 cells using singleplex IP-FCM (Ref. (6) and Supplemental Fig 2). This important advantage allows PPI testing for rare cellular subsets (9) where relatively little biomaterial is available. Bead-based platforms are also amenable to recombinant protein analysis (5, 22, 23) for assessment of protein binding domain function in mediating PPI.
Multiplex IP-FCM offers the advancement of collecting PPI for multiple proteins in shared complexes from a single sample. By analogy, transition from plate-bound ELISA to multiplex bead-array ELISA (24) has significantly amplified the cytokine expression information gleaned from a single patient sample. Multiplex bead array ELISA clinical LDTs are rapidly approaching widespread usage and meet a growing demand for multicytokine expression analyses. Our hope and intent is that multiplex IP-FCM will likewise expand the translational researcher’s toolbox by providing increased access to the protein interactome.
Both single- and multiplex IP-FCM may be well-suited for high-throughput screening, where many different PPIs could potentially be screened per well. Such experiments could be performed in conjunction with antibody libraries (25) and/or small molecule libraries (26) to seek PPI inhibitors using strategies similar to those reported for other multiplex bead-based techniques (22).
Other methodologies in addition to IP-FCM, such as affinity purification mass spectrometry (AP-MS) and Forster’s resonance energy transfer (FRET) can potentially assess PPI from primary cell sources. AP-MS represents an excellent non-candidate approach to identifying novel PPI, although currently this technique has some limitations regarding quantitative analysis of membrane-resident proteins (27, 28). FRET and IP-FCM offer candidate approaches to PPI assessment, and are both amenable to high throughput formatting; however, FRET-based techniques often utilize genetic engineering for expression of fluorescently tagged analytes, and focus analysis on immediately juxtaposed proteins. Clearly, the various methods of PPI assessment possess distinctive strengths and merit continued attention and development to facilitate their ever broader application. We propose that multiplex IP-FCM represents a unique tool for measuring PPI from physiologic biosources, with significant potential to increase access to the interactome for basic and clinical science.
Supplementary Material
Acknowledgements
This work was funded by National Institutes of Health grant 1R56AI084861, a Fraternal Order of Eagles Pilot Project grant, a generous philanthropic gift for research directed toward Alopecia Areata by Mr. Bernard Fineman, and Mayo Foundation. For technical advice and support, we thank Tessa Davis, Robert Stiles, and the Mayo Flow Cytometry and Optical Morphology (FCOM) core facility.
Abbreviations
- AAC
ambient analyte conditions
- Ab
antibody
- AP-MS
affinity-purification mass spectrometry
- CML
carboxylate-modified latex
- FCM
flow cytometry
- FRET
Forster’s resonance energy transfer
- FSC
forward light scatter
- IP
immunoprecipitation
- IP-FCM
immunoprecipitation detected by flow cytometry
- LTD
laboratory developed test
- MPC
multiprotein complex
- PE
phycoerythrin
- PPI
protein-protein interaction
- S-NHS
Sulfo-N-hydroxysulfosuccinimide
- SSC
side light scatter
- TCR
T cell antigen receptor
Footnotes
Publisher's Disclaimer: This is a PDF file of an unedited manuscript that has been accepted for publication. As a service to our customers we are providing this early version of the manuscript. The manuscript will undergo copyediting, typesetting, and review of the resulting proof before it is published in its final citable form. Please note that during the production process errors may be discovered which could affect the content, and all legal disclaimers that apply to the journal pertain.
References
- 1.Rual JF, Venkatesan K, Hao T, Hirozane-Kishikawa T, Dricot A, Li N, Berriz GF, Gibbons FD, Dreze M, Ayivi-Guedehoussou N, Klitgord N, Simon C, Boxem M, Milstein S, Rosenberg J, Goldberg DS, Zhang LV, Wong SL, Franklin G, Li S, Albala JS, Lim J, Fraughton C, Llamosas E, Cevik S, Bex C, Lamesch P, Sikorski RS, Vandenhaute J, Zoghbi HY, Smolyar A, Bosak S, Sequerra R, Doucette-Stamm L, Cusick ME, Hill DE, Roth FP, Vidal M. Nature. 2005;437:1173–1178. doi: 10.1038/nature04209. [DOI] [PubMed] [Google Scholar]
- 2.Morell M, Aviles FX, Ventura S. Curr Med Chem. 2009;16:362–379. doi: 10.2174/092986709787002709. [DOI] [PubMed] [Google Scholar]
- 3.Lund-Johansen F, Davis K, Bishop J, de Waal Malefyt R. Cytometry. 2000;39:250–259. doi: 10.1002/(sici)1097-0320(20000401)39:4<250::aid-cyto2>3.0.co;2-s. [DOI] [PubMed] [Google Scholar]
- 4.Teixeiro E, Daniels MA, Hausmann B, Schrum AG, Naeher D, Luescher I, Thome M, Bragado R, Palmer E. Immunity. 2004;21:515–526. doi: 10.1016/j.immuni.2004.08.014. [DOI] [PubMed] [Google Scholar]
- 5.Gil D, Schrum AG, Alarcon B, Palmer E. J Exp Med. 2005;201:517–522. doi: 10.1084/jem.20042036. [DOI] [PMC free article] [PubMed] [Google Scholar]
- 6.Schrum AG, Gil D, Dopfer EP, Wiest DL, Turka LA, Schamel WW, Palmer E. Sci STKE. 2007;2007:pl2. doi: 10.1126/stke.3892007pl2. [DOI] [PMC free article] [PubMed] [Google Scholar]
- 7.Schrum AG. Curr Protoc Immunol. 2009 doi: 10.1002/0471142735.im0509s87. Chapter 5, Unit5 9. [DOI] [PMC free article] [PubMed] [Google Scholar]
- 8.Davis TR, Schrum AG. J Vis Exp. 2010 doi: 10.3791/2066. [DOI] [PMC free article] [PubMed] [Google Scholar]
- 9.Mirza N, Duque MA, Dominguez AL, Schrum AG, Dong H, Lustgarten J. J Immunol. 2010;184:5466–5474. doi: 10.4049/jimmunol.0903561. [DOI] [PMC free article] [PubMed] [Google Scholar]
- 10.Nagaraj S, Schrum AG, Cho HI, Celis E, Gabrilovich DI. J Immunol. 2010;184:3106–3116. doi: 10.4049/jimmunol.0902661. [DOI] [PMC free article] [PubMed] [Google Scholar]
- 11.Bridgeman JS, Blaylock M, Hawkins RE, Gilham DE. Cytometry. 2010;A 77:338–346. doi: 10.1002/cyto.a.20840. [DOI] [PubMed] [Google Scholar]
- 12.Yang J, Reth M. FEBS Lett. 2010;584:4872–4877. doi: 10.1016/j.febslet.2010.09.045. [DOI] [PubMed] [Google Scholar]
- 13.Tyers M, Mann M. Nature. 2003;422:193–197. doi: 10.1038/nature01510. [DOI] [PubMed] [Google Scholar]
- 14.Yurkovetsky ZR, Kirkwood JM, Edington HD, Marrangoni AM, Velikokhatnaya L, Winans MT, Gorelik E, Lokshin AE. Clin Cancer Res. 2007;13:2422–2428. doi: 10.1158/1078-0432.CCR-06-1805. [DOI] [PubMed] [Google Scholar]
- 15.Lee YJ, Scofield RH, Hyon JY, Yun PY, Lee HJ, Lee EY, Lee EB, Song YW. Rheumatology (Oxford) 2010;49:1747–1752. doi: 10.1093/rheumatology/keq121. [DOI] [PMC free article] [PubMed] [Google Scholar]
- 16.Poetz O, Luckert K, Herget T, Joos TO. Anal Biochem. 2009;395:244–248. doi: 10.1016/j.ab.2009.08.002. [DOI] [PubMed] [Google Scholar]
- 17.Poetz O, Henzler T, Hartmann M, Kazmaier C, Templin MF, Herget T, Joos TO. Mol Cell Proteomics. 2010;9:2474–2481. doi: 10.1074/mcp.M110.002709. [DOI] [PMC free article] [PubMed] [Google Scholar]
- 18.Parpia ZA, Kelso DM. Anal Biochem. 2010;401:1–6. doi: 10.1016/j.ab.2009.03.050. [DOI] [PMC free article] [PubMed] [Google Scholar]
- 19.Ekins R, Chu F, Micallef J. J Biolumin Chemilumin. 1989;4:59–78. doi: 10.1002/bio.1170040113. [DOI] [PubMed] [Google Scholar]
- 20.Ekins RP. J Pharm Biomed Anal. 1989;7:155–168. doi: 10.1016/0731-7085(89)80079-2. [DOI] [PubMed] [Google Scholar]
- 21.Smith-Garvin JE, Koretzky GA, Jordan MS. Annu Rev Immunol. 2009;27:591–619. doi: 10.1146/annurev.immunol.021908.132706. [DOI] [PMC free article] [PubMed] [Google Scholar]
- 22.Roman DL, Ota S, Neubig RR. J Biomol Screen. 2009;14:610–619. doi: 10.1177/1087057109336590. [DOI] [PMC free article] [PubMed] [Google Scholar]
- 23.Blazer LL, Roman DL, Muxlow MR, Neubig RR. Curr Protoc Cytom. 2010;11:1–15. doi: 10.1002/0471142956.cy1311s51. Chapter 13, Unit 13. [DOI] [PMC free article] [PubMed] [Google Scholar]
- 24.Vignali DA. J Immunol Methods. 2000;243:243–255. doi: 10.1016/s0022-1759(00)00238-6. [DOI] [PubMed] [Google Scholar]
- 25.Colwill K, Persson H, Jarvik NE, Wyrzucki A, Wojcik J, Koide A, Kossiakoff AA, Koide S, Sidhu S, Dyson MR, Pershad K, Pavlovic JD, Karatt-Vellatt A, Schofield DJ, Kay BK, McCafferty J, Mersmann M, Meier D, Mersmann J, Helmsing S, Hust M, Dubel S, Berkowicz S, Freemantle A, Spiegel M, Sawyer A, Layton D, Nice E, Dai A, Rocks O, Williton K, Fellouse FA, Hersi K, Pawson T, Nilsson P, Sundberg M, Sjoberg R, Sivertsson A, Schwenk JM, Takanen JO, Hober S, Uhlen M, Dahlgren LG, Flores A, Johansson I, Weigelt J, Crombet L, Loppnau P, Kozieradzki I, Cossar D, Arrowsmith CH, Edwards AM, Graslund S. Nat Methods. 2011 [Google Scholar]
- 26.Boger DL, Desharnais J, Capps K. Angew Chem Int Ed Engl. 2003;42:4138–4176. doi: 10.1002/anie.200300574. [DOI] [PubMed] [Google Scholar]
- 27.Lukas RJ, Tubbs KA, Krivoshein AV, Bieber AL, Nelson RW. Anal Biochem. 2002;301:175–188. doi: 10.1006/abio.2001.5491. [DOI] [PubMed] [Google Scholar]
- 28.Han CL, Chien CW, Chen WC, Chen YR, Wu CP, Li H, Chen YJ. Mol Cell Proteomics. 2008;7:1983–1997. doi: 10.1074/mcp.M800068-MCP200. [DOI] [PubMed] [Google Scholar]
Associated Data
This section collects any data citations, data availability statements, or supplementary materials included in this article.


