

Abstract
The capsid (core antigen, HBcAg) is one of three major antigens present in patients infected with Hepatitis B Virus. The capsids are icosahedral particles, whose most prominent features are spikes that extend 25 Å out from the contiguous “floor”. At the spike tip are two copies of the “immunodominant loop”. Previously, the epitopes of seven murine monoclonal antibodies have been identified by cryo-EM analysis of Fab-labeled capsids. All but one are conformational and all but one map around the spike tip. The exception, which is also the tightest-binder, straddles an inter-molecular interface on the floor. Seeking to relate these observations to the immunological response of infected humans, we isolated anti-cAg antibodies from a patient, prepared Fabs, and analyzed their binding to capsids. A priori, one possibility was that many different Fabs would give an undifferentiated continuum of Fab-related density. In fact, the density observed was highly differentiated and could be reproduced by modeling with just five Fabs, three binding to the spike and two to the floor. These results show that epitopes on the floor, far (~ 30 Å) from the immunodominant loop, are clinically relevant and that murine anti-cAg antibodies afford a good model for the human system.
INTRODUCTION
Applications of Fab fragments in structural biology
The tightness and specificity with which antibodies bind to protein complexes has led to many fruitful applications in structural biology. In X-ray crystallography, Fab fragments have been found to form robust crystallizable complexes with macromolecules that are otherwise too unstable or aggregation-prone for structure determination (e.g. Venturi and Hunte, 2003; Huber et al., 2007; Stahl et al., 2010). In structural cell biology, antibodies coupled with electron-dense gold markers are used to map the distributions of proteins in cells by “immuno-gold” EM (e.g. Roth, 1996; Perkins and McCaffery, 2007; Lucocq, 2008). In EM studies of isolated macromolecular complexes, Fab labeling is used to localize particular components. This approach was pioneered by Ueli Aebi and co-workers in analyses of negatively stained arrays of bacteriophage T4 capsid proteins, enhanced by image filtration to separate co-projected layers and improve the signal-to-noise ratio (Aebi et al., 1977a; Aebi et al., 1977b; Buhle and Aebi, 1984).
The scope of Fab-labeling EM studies was greatly expanded by two innovations: (i) the development of monoclonal antibodies; and (ii) the advent of cryo-EM and three-dimensional image reconstruction, whereby direct interpretation of labeled specimens is possible (Wang et al., 1992). Thus, the “footprint” of a bound Fab on the antigen surface may be delineated by comparison with an unlabeled control structure. With nominal resolutions in the 20 – 25 Å range, the centroid of the footprint may be localized to within a few Å units on the surface of the complex; with resolutions in the 10 Å range, the uncertainty sharpens to within about 1 Å in each dimension (Belnap et al., 2003). The reason for such high precision is the same as in “super-resolution” light microscopy: i.e. a structure is not being resolved; rather, a center-of-mass location is being determined. If a crystal structure is available for the complex, more detailed interpretation of Fab-labeling experiments may be undertaken with the help of molecular modeling. A generic Fab structure may be taken from the Protein Data Bank and fitted into the corresponding density in the labeled reconstruction to identify the motif(s) that constitute the epitope.
This approach has been particularly productive in studies of viral capsids, many of whose principal epitopes are conformational and cannot be identified by immuno-chemical approaches such as Western blotting of denatured proteins (e.g. Trus et al., 1992; Smith et al., 1993; Hewat and Blaas, 2001; Smith, 2003). Capsids present many copies of the same epitope and their icosahedral geometry is conducive to 3D reconstruction (Crowther, 1971). A potential complication may arise through the mutual proximity of neighboring copies of the same epitope in that binding of a Fab to one epitope may occlude a neighbor. In such cases, the distribution of Fab-associated density in the reconstruction does not represent a discrete set of separate molecules but, rather, a continuum of density from overlapping Fabs. Nevertheless, the modeling procedure may be refined to closely simulate the observed density and thus identify the epitope.
Antigenic character of hepatitis B virus core antigen (capsids)
In the HBV virion, a capsid containing the viral genome is enclosed within a lipo-protein envelope. Two of the three major antigens expressed in HBV-infected humans are related to the capsid. Core antigen (cAg) is assembled capsids: these are icosahedrally symmetric particles of two sizes, corresponding to T- numbers of 4 (120 dimers) and 3 (90 dimers), respectively. e-antigen (eAg) is a secreted, unassembled, form of the same protein that retains a 10-residue fragment of its propeptide. Antibodies directed against these two antigens are not neutralizing but their presence is of diagnostic significance (Milich and Liang, 2003). cAg has been the subject of extensive structural studies by cryo-EM (Böttcher et al., 1997; Conway et al., 1997) and X-ray crystallography (Wynne et al., 1999; Packianathan et al., 2010). The availability of a crystal structure for the T=4 capsid has allowed detailed analysis of cryo-EM density maps in a series of studies of capsids labeled with monoclonal Fab fragments. They have led to the following conclusions.
All but one recognize conformational epitopes. The exception is Mab 312 (Conway et al., 1998) which binds to the immunodominant loop at the spike tip. The reason for the predominance of conformational epitopes is the relatively small size of the capsid protein subunit compared with a Fab, so that the footprints of bound Fabs tend to extend across inter-subunit boundaries.
Given the relatively large size of a Fab, the corrugated topography of the capsid restricts binding sites to two regions: either on a spike or on the contiguous floor region around the symmetry axes (Wynne et al., 1999). Of seven epitopes mapped, six are on the spike and one, Mab 3120 (Conway et al., 2003), is on the floor.
The two capsids present a total of seven quasi-equivalent versions of each epitope: four on the T=4 capsid and three on the T=3 capsid. In most cases, the occupancies of quasi-equivalent versions of the same epitope vary markedly, reflecting differing affinities for the antibody in question (Belnap et al., 2003; Watts et al., 2008).
More than one antibody can bind to a given epitope. For example, Mabs 842 and F11A4 both bind, albeit with quite different geometries, to essentially the same epitope (Harris et al., 2006).
It has been estimated that there are about 20 independent epitopes (Harris et al., 2006).
However, these studies were all performed with murine monoclonal antibodies. In the present study, we have addressed their relevance to the immunological response of HBV-infected humans by performing a similar analysis of capsids labeled with polyclonal Fabs prepared from the serum of a patient. We find that both classes of antibody previously characterized - spike binders and floor binders - are present in this sample.
MATERIALS AND METHODS
Preparation of antibodies
Plasma was obtained from a single HBV-positive patient. IgGs were precipitated from clarified serum by the addition of 40% ammonium sulfate. Capsid-binding antibodies were immunoprecipitated with recombinant HBcAg (Cp183) produced in E. coli (Wingfield et al., 1995). (Cp183 is residues 1 to 183, the full-length protein). The procedure for purification and fragmentation is summarized in Figure 1A. In brief, following dissociation of the immune complexes with 3 M MgCl2, 25% ethylene glycol, 100 mM Tris chloride, pH 7.4 (Ben-David and Firer, 1996) and centrifugation to remove capsids, the soluble IgG-containing fraction was digested with immobilized papain (Pierce). The resulting Fc and Fab fragments were resolved by chromatography on a Protein A column (Fabs do not bind and were recovered in the column flow–through). The UV spectrum (not shown) showed the protein to be free of nucleic acids and SDS-PAGE showed the Fab to be essentially pure (Figure 1B).
Figure 1.

(A) outlines the steps used in the protocol used to prepare Fabs from total HBV capsid-specific antibodies from a clinical sample. (B) SDS-PAGE in the presence of reductant of protein samples from successive steps of this procedure, stained with Coomassie Blue. Cut = protein fraction precipitated with 40% (NH4)2SO4; immunoprecipitate = serum proteins with precipitated by Cp183 capsids; supernatant and pellet are fractions obtained following dissociation of the immunoprecipitate. The supernatant contains IgG plus minor contaminants whereas the pellet contains Cp183 and antibody; concentrated IgG was used for papain digestion. (C) Papain cleavage of anti-cAg IgGs. Selected mass markers (kDa) are labeled in Standards lanes. H and L refer to the heavy and light chains of IgGs.
Cryo-electron microscopy and image reconstruction
Fab was mixed with Cp149 capsids (Wingfield et al., 1995, Steven et al., 2005) in the ratio of one Fab per monomer of Cp149. (Cp149 is residues 1 to149, and lacks the protamine domain). Fab binding to capsids was confirmed by negative staining EM. The Fab-labeled capsids were concentrated by ultrafiltration to ~ 2.6 mg/ml (with respect to capsid protein) and then vitrified in thin films suspended over holey carbon films and observed with a Philips CM200 FEG microscope operating at 120 keV (Cheng et al., 2002). Focal pairs of micrographs were recorded under low-dose conditions (~ 10 e−/Å2 per exposure) on Kodak SO-163 film at a magnification of 50,000X. The first exposures were recorded at defocus values of −0.9 to −1.2 μm, such that the first zero of the contrast transfer function (CTF) was at frequencies of (17 Å)−1– (20 Å) −1. For the far-from-focus micrographs, the defocus was increased by 0.6 μm, putting the first zeros at (23 Å) −1– (25 Å) −1.
Fifteen focal pairs were digitized at a sampling rate corresponding to 1.4 Å/pixel at the specimen. Image processing was done using Bsoft (Heymann, 2001). Totals of 1773 and 1464 particles respectively were picked manually for the T=4 and T=3 capsids. Initial origins and orientations were determined by using as reference density maps of unlabeled Cp149 HBV capsids (Conway et al., 1997). PFT2 and EM3DR2 (Baker and Cheng, 1996; Belnap et al, 2003) were then applied iteratively to calculate reconstructions until no further improvement in resolution was observed. The final reconstructions included all particles with correlation coefficients above a threshold calculated by decreasing the mean value by one standard deviation (SD) for T=4 and by one half-SD for T=3. This resulted in 1324 particles for T=4 and 1231 particles for T=3. Density maps were calculated with phase-flipped particles. The final resolutions were determined by the frequencies at which the Fourier shell correlation coefficients fell below 0.5.
Modeling Fab molecules into cryo-EM density
First, the dimer structure of capsid protein (PDB code 1QGT) was fitted into the density maps of T=4 and T=3 reconstructions. Then, the crystal structures of several Fab molecules including various heavy and light chain types were attempted to find the Fab that fitted best into the Fab-associated densities in the reconstructions. The Fab structure was docked into the map by maintaining a general orientation of the Fab CDR loops towards the capsid surface, which also is of the highest occupancy. Of the structures that gave best and similar fitting, the thyroid peroxidase autoantibody, TR1.9, from human, with a IgG1 heavy chain and a kappa light chain (PDB code 1VGE) was chosen. All fitting procedures were performed manually using Chimera (Goddard et al., 2005). Estimates of fractional Fab occupancies were obtained by identifying the highest Fab-associated densities in a given (fitted) region and calibrating them relative to the highest capsid-associated density, taken to represent 100% occupancy. The coordinates of Fabs and the dimer of the capsid protein as modeled into an asymmetric unit were converted to density and icosahedrally symmetrized using Bsoft. The Fab occupancies were refined by comparing visually the cross-sections of simulated densities with those of the corresponding reconstructions.
RESULTS
Preparation of Fabs and cryo-EM of labeled capsids
Plasma was drawn by plasmopheresis from a 43 year old Asian male with untreated active chronic Hepatitis B. The polyclonal HBcAg-specific antibodies were isolated and Fabs prepared from them (see Materials & Methods and Figure 1). This material was incubated with recombinant Cp149 capsids (i.e. capsids produced by expressing a construct for residues 1 – 149, the core domain, in E. coli) at an equimolar ratio of Fabs to Cp149 subunits. After labeling was confirmed by negative staining EM (data not shown), cryo-EM was performed. On comparing the resulting images with those of an unlabeled control (cf. Figures 2B & 2A), it is evident that a dense labeling was achieved.
Figure 2.

Cryo-electron micrographs of (A) control HBV-Cp149 capsids and (B) HBV-Cp149 capsids decorated with polyclonal human Fabs. Black arrowhead: a T=4 capsid; white arrowhead: a T=3 capsid. Scale bar: 50 nm.
Image reconstruction of Fab-labeled capsids
To characterize the binding of these antibodies in greater detail, three-dimensional density maps of the labeled capsids were calculated. The reconstruction of the T=4 capsid is shown in Figure 3B. Its resolution was assessed as ~ 11 Å by the Fourier shell correlation criterion with a conservative threshold of 0.5 (see Methods). A local resolution calculation (Cardone et al., Ms in preparation) indicated a value of ~ 8 Å for the capsid shell and 8 – 14 Å for the Fab-related density, the resolution being highest near the capsid-Fab interface and progressively lower, further away. The T=3 capsid map revealed similar features but was noisier and had lower resolution (data not shown). Accordingly, we focused our detailed analysis on the T=4 capsid which, moreover, is the predominant form produced in infected human livers (Kenney et al., 1995; Dryden et al., 2006).
Figure 3.

(A) Model of the surface lattice of the T=4 capsid with the four quasi-equivalent subunits distinguished by different colors (green, yellow, blue, red), viewed along an axis of 2-fold symmetry (see Belnap et al., 2003). (B) Surface rendering of the Fab-decorated T=4 capsid. Features of Fab-related density at the 5-fold (green), 2-fold (orange), and 3-fold (magenta) symmetry axes, and the AB (cyan) and CD (blue) spikes, are highlighted. (C) Enlargement of the Fab-related densities shown in B. (D) As panel C, but with a ribbon diagram of one of the contributing surrogate Fabs as modeled into the corresponding feature of Fab-related density. Central grayscale sections through cryo-EM density maps of: (E) unlabeled T=4 capsid (control); (F) Fab-decorated T=4 capsid; (G) modeled T=4 capsid. Scale bar: 100 Å. The capsids are viewed along an axis of 2-fold symmetry. Because of the 2-fold symmetry of this section, each feature appears twice. In (F) and (G), half of the sections is shown uncolored (top right sector) and the other half color-coded according to Fab related densities as shown in B-D (bottom left sector).
The reconstruction of the T=4 capsid reveals not only major elements of secondary structure in the shell, for example, the four α-helices in the spike bundle, but also the surrounding Fab-related density. A surface rendering of the labeled capsid is shown in Figure 3B with a model of the T=4 capsid shown alongside for reference (Figure 3A). Various features of Fab-related density are shown in Figure 3C. These features do not have the shapes of individual Fab molecules because they represent the superposition of Fabs bound at adjacent epitopes which cannot be simultaneously occupied because of steric hindrance. Consequently, their molecular envelopes merge in the density maps. For this reason also, i.e. substoichiometric occupancy, the Fab-related density is generally lower than in the capsid shell (Figure 3F). Two color codlings are used in this Figure: one, in Figure 3A, distinguishes the four quasi-equivalent subunits in conventional colors. The other, in Figure 3B, distinguishes certain features of Fab-related density.
To interpret the Fab-labeled map, we relied mainly on grayscale sections. The central section of a view along a 2-fold symmetry axis is particularly informative as it includes longitudinal and transverse sections through capsid protein dimers and it contains all three symmetry axes (5-, 3-, and 2-fold). This section (Figure 3F) directly shows density overlying the 2-fold axis (the axis is marked in Figure 3E) coming from floor-binding Fabs, and other density surrounding the spikes, corresponding to spike-binders.
Modeling of antibody structures into the cryo-EM density map
To localize the predominant epitopes, we performed modeling in which high resolution structures of the capsid and a representative Fab molecule were fitted into the labeled density map. Although the labeling mixture was expected to be highly polyclonal, the differentiated nature of the Fab density led us to infer that it was dominated by a limited number of contributors. For modeling purposes, we tried a few Fab crystal structures of different types (IgG1, IgG2, etc) and with differences in their elbow angle and fitted them into the EM density at the 5-fold of the T=4 map. The one that best reproduced this experimental density was an IgG1 kappa antibody (PDB code 1VGE). Because we were chary about introducing too many degrees of freedom into the modeling process (e.g. different elbow angles for each Fab), we used the same molecule to model all Fab-related densities.
To assess models of the labeled capsid, we compared their central sections with that of the experimental map after band-limiting the model to (14 Å)−1. At each step, the modeling was refined to optimize the match. The occupancies of the modeled Fabs at the different sites (Table 1) were estimated in the same way. We started by modeling the most prominent densities – those at the AA site at the 5-fold axis - and when they were well accounted for, addressed the next most prominent densities, and so on. This procedure reached a conclusion when Fabs had been modeled as occupying five distinct epitopes that we named he1 - he5 (he = human epitope). Overall, there is non-zero occupancy of 12 of the 20 quasi-equivalent sites (5 sets of 4 each) - Table 1). At that point, all significant densities present in the reconstruction were accounted for (cf. Figures 3F and 3G). The positions of the five epitopes in question are marked on the cryo-EM density map in Figure 4A. Their positions on the primary sequence are mapped in Figure 4B and on the capsid surface in Figure 5.
Table 1.
Summary of epitope locations and occupancies.
| Epitope | Fab orientation | Location on the capsid | Quasi- equivalent Subunits to which the Fab is binding (total 12 Fab molecules) | Modeled Residues | Occupancy, as modeled |
|---|---|---|---|---|---|
| he1 | 1 | 5-fold | AA | A1: 26,70–71,73–74,77–79,87,90–91 A2: 129–131 |
0.4 |
| 2-fold | CD | C:22,26,28,70,73–74,76–79,87,90–91 D: 129–131 |
0.1 | ||
| 2-fold | D (BD)1 | D: 70,73–74,78–80,83 | 0.3 | ||
| he2 | 2 | 2-fold | BD | B: 130–131 D:130–131 | 0.3 |
| he3 | 3 | 3-fold | CD | C: 70, 73–74, 80,83–84,86–87, 90–91 | 0.2 |
| Quasi 3fold | D2 | D: 73,80,83–84,86–87 | 0.3 | ||
| he4 | 4 | AB spike | A B |
A: 80 B: 78,80 |
0.1 0.15 |
| 5 | AB spike | B | B: 77–79 | 0.15 | |
| CD spike | C D |
C:78,80 D:78,80 |
0.1 0.2 |
||
| he5 | 6 | CD spike | CD | D:76–80,82 C:78–80,82,84 | 0.1 |
This table gives details of various Fab epitopes modeled on the T=4 capsid. The observed experimental density was reproduced by computer modeling using five different epitopes (he1 to he5) and 6 Fab orientations (1 to 6) at various locations on the capsid as indicated above.
The residues spanning this epitope are a subset of those in epitope he1 (refer to CD and AA site). Hence it was grouped as he1 epitope.
The residues spanning this epitope is a subset of the epitope he3 observed at the 3-fold axis. Hence it was grouped as he3 epitope.
FIGURE 4.

(A) Enlargement of a region of capsid surrounding the 3-fold axis with epitopes he1 to he5 marked in different colors. (B) Mapping of the positions of the epitope-forming peptides on the core domain sequence. (C) Mapping of the positions of the epitope-forming peptides of 7 murine monoclonal antibodies, previously characterized (see Introduction).
Figure 5.
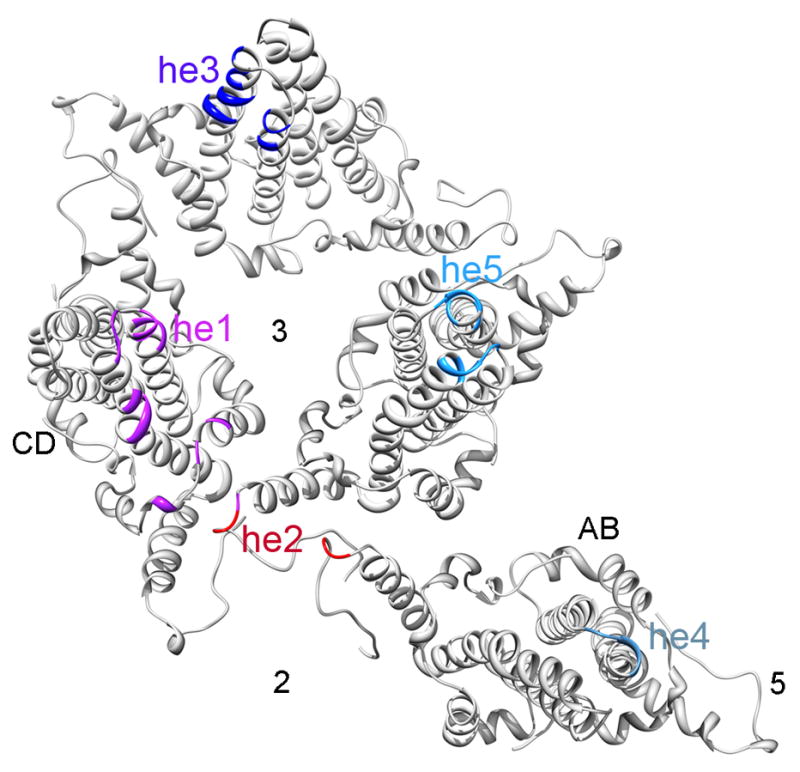
Epitopes, shown on the surface-rendered reconstruction in Figure 4A, are here marked on ribbon diagrams of the corresponding subunits. The five epitopes, the 2-, 3- and 5-fold symmetry axes, and the AB and CD dimers, are indicated.
DISCUSSION
Spike-binding antibodies and floor-binding antibodies
Given the dimensions of antibody molecules, the topography of HBV capsids limits the accessibility of antibodies (specifically, Fabs) to two general areas: the outer part of the spike and the floor region. Previous studies have shown that epitopes in both areas are targeted by the mechanisms that define the specificities of murine monoclonal antibodies (see Introduction). To the extent that the seven Mabs whose epitopes have been defined to date afford a representative sampling, spike binders (N = 6) are more common than floor binders (N = 1). The inferred rarity of floor binders raised the question of whether such antibodies form a significant part of the human immune response to HBV infection. The present observations give a definite, positive, answer to that question. The reconstruction of labeled T=4 capsids clearly shows strong density in direct contact with the floor region (Figure 3F). In the modeling experiment, this density was accounted for by surrogate labeling of two epitopes around the interface between subunits on adjacent Cp149 dimers. he1 is composed of two loops on the floor, one from each subunit, plus residues on the side of a spike (cf Table 1 and Figure 5). he2 is formed from the floor residues involving same two loops. Both he1 and he2 have residues overlapping with the epitope of mAb 3120 (cf. Figures 4B and 4C).
This is not to say that there are only two floor-binding antibodies in this patient’s plasma. There may be more actually contributing to the density in question (the approach to modeling was minimalist, recognizing the limitations of the data), and other floor-binders may be present in the labeling pool. Fab labeling of HBV capsids tends to saturate, sterically, at about 50 Fabs per T=4 capsid (unpublished results and Table 1) and our labeling reaction was carried out with approximately five times this amount, so that 80% or so of the Fabs remained unbound. Thus Fabs with lower binding affinities or lower abundances or which are under-represented for kinetic reasons (lower “on” rates) would not be represented in the reconstruction. They may well include other floor binders.
Immunodominant loops and immunodominant features
Prior to determination of the capsid structure, the core domain segment from residues ~ 78 to ~ 83 was identified as the “dominant HBcAg determinant” on serological grounds (Salfeld et al., 1989). It subsequently became known as the “immunodominant loop” (IL) (Borisova et al., 1993; Pumpens et al., 1995). Once it was determined, the T=4 capsid structure (Wynne et al., 1999) revealed that this segment is largely coincident with the loop that connects two α-helices and is exposed pair-wise at the tip of the spike. A single copy of the IL makes an effective linear epitope, as Mab 312 binds to it when presented on capsids and when denatured in Western blots (Conway et al., 1998), and on substrate-bound synthetic peptides (Sällberg et al., 1991). However, this is the only nonconformational cAg epitope encountered to date. Of the other five spike binders on record, one (88) binds to a linear but conformational epitope comprising the distal few residues of the IL plus the following two turns of α-helix. The other three (842, 3105, and F11A4) have contributions from both subunits in a given spike. Moreover, they involve parts of the polypeptide outside the IL as originally defined (Figure 4C). These considerations suggest that it is not so much the amino acid sequence per se of residues 78 – 83 that confers its immunoreactivity but, rather, its position at the outermost, most exposed, position on the capsid surface. The same argument applies to the adjacent peptides that form parts of the other spike epitopes. It appears, therefore, that the term “immunodominant feature” would be more appropriate than “immunodominant loop”. This idea is consistent with (and is in fact preceded by) the success of experiments raising antibodies against peptides inserted in the loop region (Schödel et al., 1992; Whitacre et al., 2009).
How many cAg epitopes are there?
An estimate of about 20 has been made on the basis of statistical sampling theory (Harris et al., 2006). This calculation, based on the most likely pool size to give a duplicate epitope on the fifth or sixth trial, has a sizeable margin of error and is based on the assumption of a simple statistical model. The Fab-related density in the present reconstruction could be accounted for with computational labeling with just five surrogate Fabs whose epitopes we named he1 to he5; however, the total number of epitopes is likely to be considerably larger, for the same reasons as given above for floor-binders.
The scope present of the study is limited in that it relates to a single patient and disease state. The antibodies used for labeling were isolated from a patient with active viremia, who was therefore likely have circulating antigen-antibody complexes of a kind that are quickly cleared by the immune system. It is possible, at least in theory, that the repertoire of those bound antibodies could differ from that of the free ones that we have analyzed. In any case, further studies of this kind may yield insight as to whether the prevalence of particular antibodies, i.e. those binding to particular epitopes, correlates with disease state. Should such be the case, it may have considerable potential for differential diagnosis of HBV-infected patients.
Acknowledgments
This research was supported by the Intramural Research Programs of NIAMS and NIDDK.
Footnotes
Publisher's Disclaimer: This is a PDF file of an unedited manuscript that has been accepted for publication. As a service to our customers we are providing this early version of the manuscript. The manuscript will undergo copyediting, typesetting, and review of the resulting proof before it is published in its final citable form. Please note that during the production process errors may be discovered which could affect the content, and all legal disclaimers that apply to the journal pertain.
References
- Aebi U, ten Heggeler B, Onorato L, Kistler J, Showe MK. New method for localizing proteins in periodic structures: Fab fragment labeling combined with image processing of electron micrographs. Proc Nat’l Acad Sci USA. 1977a;74:5514–5518. doi: 10.1073/pnas.74.12.5514. [DOI] [PMC free article] [PubMed] [Google Scholar]
- Aebi U, van Driel R, Bijlenga RK, ten Heggeler B, van den Broek R, et al. Capsid fine structure of T-even bacteriophages. Binding and localization of two dispensable capsid proteins into the P23* surface lattice. J Mol Biol. 1977b;110:687–698. doi: 10.1016/s0022-2836(77)80084-3. [DOI] [PubMed] [Google Scholar]
- Baker TS, Cheng RH. A model-based approach for determining orientations of biological macromolecules imaged by cryoelectron microscopy. J Struct Biol. 1996;116:120–130. doi: 10.1006/jsbi.1996.0020. [DOI] [PubMed] [Google Scholar]
- Belnap DM, Watts NR, Conway JF, Cheng N, Stahl SJ, et al. Diversity of core antigen epitopes of hepatitis B virus. Proc Nat’l Acad Sci USA. 2003;100:10884–9. doi: 10.1073/pnas.1834404100. [DOI] [PMC free article] [PubMed] [Google Scholar]
- Ben-David A, Firer MA. Immunoaffinity purification of monoclonal antibodies: In search of an elution buffer of general applicability. Biotech Techniques. 1996;10:799–802. [Google Scholar]
- Borisova G, Arya B, Dislers A, Borschukova O, Tsibinogin V, et al. Hybrid hepatitis B virus nucleocapsid bearing an immunodominant region from hepatitis B virus surface antigen. J Virol. 1993;67:3696–701. doi: 10.1128/jvi.67.6.3696-3701.1993. [DOI] [PMC free article] [PubMed] [Google Scholar]
- Böttcher B, Wynne SA, Crowther RA. Determination of the fold of the core protein of hepatitis B virus by electron cryomicroscopy. Nature. 1997;386:88–91. doi: 10.1038/386088a0. [DOI] [PubMed] [Google Scholar]
- Buhle EL, Aebi U. Specific labeling of protein domains with antibody fragments. J Ultrastruct Res. 1984;89:165–178. doi: 10.1016/s0022-5320(84)80012-x. [DOI] [PubMed] [Google Scholar]
- Cheng N, Trus BL, Belnap DM, Newcomb WW, Brown JC, et al. Handedness of the herpes simplex virus capsid and procapsid. J Virol. 2002;76:7855–9. doi: 10.1128/JVI.76.15.7855-7859.2002. [DOI] [PMC free article] [PubMed] [Google Scholar]
- Conway JF, Cheng N, Zlotnick A, Wingfield PT, Stahl SJ, et al. Visualization of a 4-helix bundle in the hepatitis B virus capsid by cryo-electron microscopy. Nature. 1997;386:91–4. doi: 10.1038/386091a0. [DOI] [PubMed] [Google Scholar]
- Conway JF, Watts NR, Belnap DM, Cheng N, Stahl SJ, et al. Characterization of a conformational epitope on hepatitis B virus core antigen and quasi-equivalent variations in antibody binding. J Virol. 2003;77:6466–6473. doi: 10.1128/JVI.77.11.6466-6473.2003. [DOI] [PMC free article] [PubMed] [Google Scholar]
- Conway JF, Cheng N, Zlotnick A, Stahl SJ, Wingfield PT, et al. Hepatitis B virus capsid: localization of the putative immunodominant loop (residues 78 to 83) on the capsid surface, and implications for the distinction between c and e-antigens. J Mol Biol. 1998;279:1111–21. doi: 10.1006/jmbi.1998.1845. [DOI] [PubMed] [Google Scholar]
- Crowther RA. Procedures for three-dimensional reconstruction of spherical viruses by Fourier synthesis from electron micrographs. Philos Trans R Soc Lond [Biol] 1971;261:221–230. doi: 10.1098/rstb.1971.0054. [DOI] [PubMed] [Google Scholar]
- Dryden KA, Wieland SF, Whitten-Bauer C, Gerin JL, et al. Native hepatitis B virions and capsids visualized by electron cryomicroscopy. Mol Cell. 2006;22:843–50. doi: 10.1016/j.molcel.2006.04.025. [DOI] [PubMed] [Google Scholar]
- Goddard TD, Huang CC, Ferrin TE. Software extensions to UCSF chimera for interactive visualization of large molecular assemblies. Structure. 2005;13:473–82. doi: 10.1016/j.str.2005.01.006. [DOI] [PubMed] [Google Scholar]
- Harris A, Belnap DM, Watts NR, Conway JF, Cheng N, et al. Epitope diversity of hepatitis B virus capsids: quasi-equivalent variations in spike epitopes and binding of different antibodies to the same epitope. J Mol Biol. 2006;355:562–76. doi: 10.1016/j.jmb.2005.10.035. [DOI] [PubMed] [Google Scholar]
- Hewat E, Blaas D. Structural studies on antibody interacting with viruses. Curr Top Microbiol Immunol. 2001;260:29–44. doi: 10.1007/978-3-662-05783-4_2. [DOI] [PubMed] [Google Scholar]
- Heymann JB. Bsoft: image and molecular processing in electron microscopy. J Struct Biol. 2001;133:156–69. doi: 10.1006/jsbi.2001.4339. [DOI] [PubMed] [Google Scholar]
- Huber T, Steiner D, Rothlisberger D, Plückthün A. In vitro selection and characterization of DARPins and Fab fragments for the co-crystallization of membrane proteins: The Na(+)-citrate symporter CitS as an example. J Struct Biol. 2007;159:206–21. doi: 10.1016/j.jsb.2007.01.013. [DOI] [PubMed] [Google Scholar]
- Kenney JM, von Bonsdorff CH, Nassal M, Fuller SD. Evolutionary conservation in the hepatitis B virus core structure: comparison of human and duck cores. Structure. 1995;3:1009–1019. doi: 10.1016/s0969-2126(01)00237-4. [DOI] [PubMed] [Google Scholar]
- Lucocq J. Quantification of structures and gold labeling in transmission electron microscopy. Meth Cell Biol. 2008;88:59–82. doi: 10.1016/S0091-679X(08)00404-4. [DOI] [PubMed] [Google Scholar]
- Milich D, Liang TJ. Exploring the biological basis of hepatitis B e antigen in hepatitis B virus infection. Hepatology. 2003;38:1075–86. doi: 10.1053/jhep.2003.50453. [DOI] [PubMed] [Google Scholar]
- Packianathan C, Katen SP, Dann CE, Zlotnick A. Conformational changes in the hepatitis B virus core protein are consistent with a role for allostery in virus assembly. J Virol. 2010;84:1607–15. doi: 10.1128/JVI.02033-09. [DOI] [PMC free article] [PubMed] [Google Scholar]
- Perkins EM, McCaffery JM. Conventional and immunoelectron microscopy of mitochondria. Meth Mol Biol. 2007;372:467–83. doi: 10.1007/978-1-59745-365-3_33. [DOI] [PubMed] [Google Scholar]
- Pumpens P, Borisova GP, Crowther RA, Grens E. Hepatitis B virus core particles as epitope carriers. Intervirology. 1995;38:63–74. doi: 10.1159/000150415. [DOI] [PubMed] [Google Scholar]
- Roth J. The silver anniversary of gold: 25 years of the colloidal gold marker system for immunocytochemistry and histochemistry. Histochem Cell Biol. 1996;106:1–8. doi: 10.1007/BF02473197. [DOI] [PubMed] [Google Scholar]
- Salfeld J, Pfaff E, Noah M, Schaller H. Antigenic determinants and functional domains in core antigen and e antigen from hepatitis B virus. J Virol. 1989;63:798–808. doi: 10.1128/jvi.63.2.798-808.1989. [DOI] [PMC free article] [PubMed] [Google Scholar]
- Sällberg M, Ruden U, Magnius LO, Harthus HP, Noah M, Wahren B. Characterisation of a linear binding site for a monoclonal antibody to hepatitis B core antigen. J Med Virol. 1991;33:248–252. doi: 10.1002/jmv.1890330407. [DOI] [PubMed] [Google Scholar]
- Schödel F, Moriarty AM, Peterson DL, Zheng JA, Hughes JL, et al. The position of heterologous epitopes inserted in hepatitis B virus core particles determines their immunogenicity [erratum appears in J Virol 1992 66:3977] J Virol. 1992;66:106–114. doi: 10.1128/jvi.66.1.106-114.1992. [DOI] [PMC free article] [PubMed] [Google Scholar]
- Smith TJ. Structural studies on antibody-virus complexes. In: Chiu W, Johnson JE, editors. Adv Prot Chem: Virus Structure. Academic Press; San Diego: 2003. pp. 409–454. [DOI] [PubMed] [Google Scholar]
- Smith TJ, Olson NH, Cheng RH, Chase ES, Baker TS. Structure of a human rhinovirus-bivalently bound antibody complex: implications for viral neutralization and antibody flexibility. Proc Natl Acad Sci USA. 1993;90:7015–7018. doi: 10.1073/pnas.90.15.7015. [DOI] [PMC free article] [PubMed] [Google Scholar]
- Stahl SJ, Watts NR, Rader C, DiMattia MA, Mage RG, et al. Generation and characterization of a chimeric rabbit/human Fab for co-crystallization of HIV-1 Rev. J Mol Biol. 2010;397:697–708. doi: 10.1016/j.jmb.2010.01.061. [DOI] [PMC free article] [PubMed] [Google Scholar]
- Trus BL, Newcomb WW, Booy FP, Brown JC, Steven AC. Distinct monoclonal antibodies separately label the hexons or the pentons of herpes simplex virus capsid. Proc Natl Acad Sci USA. 1992;89:11508–11512. doi: 10.1073/pnas.89.23.11508. [DOI] [PMC free article] [PubMed] [Google Scholar]
- Venturi M, Hunte C. Monoclonal antibodies for the structural analysis of the Na+/H+ antiporter NhaA from Escherichia coli. Biochim Biophys Acta. 2003;1610:46–50. doi: 10.1016/s0005-2736(02)00713-7. [DOI] [PubMed] [Google Scholar]
- Wang GJ, Porta C, Chen ZG, Baker TS, Johnson JE. Identification of a Fab interaction footprint site on an icosahedral virus by cryoelectron microscopy and X-ray crystallography. Nature. 1992;355:275–278. doi: 10.1038/355275a0. [DOI] [PMC free article] [PubMed] [Google Scholar]
- Watts NR, Cardone G, Vethanayagam JG, Cheng N, Hultgren C, et al. Non-canonical binding of an antibody resembling a naive B cell receptor immunoglobulin to hepatitis B virus capsids. J Mol Biol. 2008;379:1119–29. doi: 10.1016/j.jmb.2008.04.009. [DOI] [PMC free article] [PubMed] [Google Scholar]
- Whitacre DC, Lee BO, Milich DR. Use of hepadnavirus core proteins as vaccine platforms. Expert Rev Vaccines. 2009;8:1565–73. doi: 10.1586/erv.09.121. [DOI] [PMC free article] [PubMed] [Google Scholar]
- Wingfield PT, Stahl SJ, Williams RW, Steven AC. Hepatitis core antigen produced in Escherichia coli: subunit composition, conformational analysis, and in vitro capsid assembly. Biochemistry. 1995;34:4919–4932. doi: 10.1021/bi00015a003. [DOI] [PubMed] [Google Scholar]
- Wynne SA, Crowther RA, Leslie AG. The crystal structure of the human hepatitis B virus capsid. Mol Cell. 1999;3:771–80. doi: 10.1016/s1097-2765(01)80009-5. [DOI] [PubMed] [Google Scholar]