

Abstract
We used high‐resolution fMRI to investigate claims that learning to read results in greater left occipito‐temporal (OT) activation for written words relative to pictures of objects. In the first experiment, 9/16 subjects performing a one‐back task showed activation in ≥1 left OT voxel for words relative to pictures (P < 0.05 uncorrected). In a second experiment, another 9/15 subjects performing a semantic decision task activated ≥1 left OT voxel for words relative to pictures. However, at this low statistical threshold false positives need to be excluded. The semantic decision paradigm was therefore repeated, within subject, in two different scanners (1.5 and 3 T). Both scanners consistently localised left OT activation for words relative to fixation and pictures relative to words, but there were no consistent effects for words relative to pictures. Finally, in a third experiment, we minimised the voxel size (1.5 × 1.5 × 1.5 mm3) and demonstrated a striking concordance between the voxels activated for words and pictures, irrespective of task (naming vs. one‐back) or script (English vs. Hebrew). In summary, although we detected differential activation for words relative to pictures, these effects: (i) do not withstand statistical rigour; (ii) do not replicate within or between subjects; and (iii) are observed in voxels that also respond to pictures of objects. Our findings have implications for the role of left OT activation during reading. More generally, they show that studies using low statistical thresholds in single subject analyses should correct the statistical threshold for the number of comparisons made or replicate effects within subject. Hum Brain Mapp 2008. © 2007 Wiley‐Liss, Inc.
Keywords: fMRI, reading, object recognition, selectivity, occipitotemporal cortex, fusiform, magnetic field strength
INTRODUCTION
The importance of the left occipito‐temporal (OT) cortex for efficient reading is well recognised. Left OT damage results in reading deficits and skilled readers consistently activate left OT cortex for written words relative to viewing checkerboards or other non‐semantic stimuli [Cohen and Dehaene, 2004]. However, left OT responses are not limited to written word processing [Price and Devlin, 2003], and left OT damage impairs object naming as well as reading [Behrmann et al., 1998; Damasio and Damasio, 1983; De Renzi et al., 1987; Hillis et al., 2005]. These observations have led to two contrasting theories of left OT activation during reading. One hypothesis is that, during the process of learning to read, left OT neuronal populations that were previously specialised for object recognition are ‘pre‐empted’ or ‘recycled’ for reading [Dehaene, 2005]. In this case, reading experience changes the function of the region and consequently activation in these left OT neuronal populations is expected to be higher for written words than objects irrespective of task (i.e. a word‐selective effect). The alternative hypothesis [Price and Devlin, 2004; Price and Friston, 2005] is that the left OT region of interest (ROI) plays the same functional role during reading and object naming. For example, it may be involved in shape configuration [Starrfelt and Gerlach, 2007], or act as an interface between visual form information and higher order stimulus properties, such as its associated sound and meaning [Devlin et al., 2006]. In this context, learning to read involves the progressive engagement of a function that already contributes to object naming. Thus, the degree to which the area is engaged is more dependent on the task demands (e.g. naming vs. viewing) than on the stimulus type (words vs. pictures).
One critical line of evidence for evaluating these theories centres on whether left OT activation is higher for words than pictures of objects. If neuronal populations become tuned to word form processing, then activation should be higher for word than object processing irrespective of task. According to the shared function hypothesis, in contrast, activation will be more dependent on the task than the stimulus, i.e. activation could be higher or lower for words [Starrfelt and Gerlach, 2007]. The few previous studies that have directly compared word and picture processing have produced conflicting results. When activation is summed over groups of subjects, left OT activation tends to be higher (or the same) for pictures of objects than their written names during a range of different tasks [Bookheimer et al., 1995; Chee et al., 2000; Menard et al., 1996; Mummery et al., 1999; Price et al., 2006; Sevostianov et al., 2002; Vandenberghe et al., 1996; Waters et al., 2007]. However, at the single subject level, Hasson et al. [ 2002] report areas in the left OT sulcus that were activated for Hebrew words more than objects, although the authors do not focus on these effects or report the statistical details. Reinholz and Pollmann [ 2005] have also reported increased activation for German words relative to pictures but the location of these effects (−42 ± 4,−58 ± 6,−4 ± 3) was closer to the left superior temporal area associated with naming [Price et al., 2006] than to the left OT area that Cohen and Dehaene [ 2004] associate with visual word form processing (−43,−54,−12 ± 5 mm). Likewise, in a single patient study, Gaillard et al. [ 2006] compared written word processing to the mean activation of viewing faces, houses and tools and identified an effect at −42,−57,−6 which is in middle temporal cortex rather than in the vicinity of the left OT sulcus.
The present study therefore aims to examine responses to written words and objects around the left OT sulcus and also to explore possible sources for the inconsistent results between previously conducted studies. These variables include task, orthography, object category (e.g. animals vs. tools) and aspects of data acquisition and analysis that may have affected spatial resolution. Three separate experiments are reported, all of which directly compared activation for written words and pictures of objects.
Experiment 1 included a one‐back identity task on stimuli that referred to tool objects, as in Hasson et al. [ 2002], but we also looked for differences in word and picture activation when the stimuli referred to animals and, furthermore, when the task depended on semantic retrieval (one‐back semantic task) rather than visual features (one‐back identity task). This allowed us to test whether differences between word and picture processing depended on the task (one‐back semantic vs. identity) or category (tools vs. animals). We hypothesised that, during the one‐back identity task, subjects may use different processing strategies for pictures vs. words (e.g. visual identity vs. lexical or phonological identity), but during the one‐back semantic task, both word and picture processing would require access to the same specific semantic information. This would result in different brain responses for words and pictures during the one‐back identity task but not during the one‐back semantic task. With respect to object category (animals vs. tools), we hypothesised that increased activation for words relative to pictures might be greater when the stimuli were tools than animals. This hypothesis was based on previous findings that OT activation is higher for pictures of animals than pictures of tools, with a much smaller influence of category in this region when the stimuli are written words [Noppeney et al., 2006].
Data from Experiment 1 are reported at the group level for all conditions and the single subject level for the one‐back identity task that we predicted would show the strongest word selectivity effects. To maximise spatial resolution and sensitivity we used minimal levels of spatial smoothing (see Methods for a discussion of smoothing) and very liberal statistical thresholds (P < 0.05 uncorrected) in large ROIs, with no correction for multiple comparisons. Consequently, these analyses run the risk of false‐positive results. Thus, the principal aim of Experiment 2 was to attempt to militate against this by examining whether the effects were replicated within subjects, who were scanned twice with the same paradigm involving a semantic decision task. In addition, as Experiment 2 collected data at two different static magnetic field strengths (1.5 and 3 T), this also enabled a comparison of how the static magnetic field strength affected the results. Finally, to increase spatial resolution further, Experiment 3 used high‐resolution fMRI to decrease the size of the voxels from 3 × 3 × 3 mm3 to 1.5 × 1.5 × 1.5 mm3. In addition, Experiment 3 also afforded the opportunity to investigate other possible sources for the discrepant results between previously conducted studies, namely the effects of task (one‐back and naming) and orthography (Hebrew as used in Hasson et al. [ 2002] and English as used in our previous studies [e.g. Price et al., 2006]).
METHODS
This study reports data from 34 healthy adult subjects with normal or corrected to normal vision. All gave informed consent to participate in one of three different experiments that each directly compared activation for written words and pictures of objects around the left OT sulcus. The study was approved by the Ethics Committee for the National Hospital for Neurology and Neurosurgery and Institute of Neurology, UCL, London.
Experimental Aims, Designs and Subjects
Experiment 1 is a re‐analysis of fMRI data previously reported by Noppeney et al. [ 2006] that studied how the effect of object category (animals vs. tools) depends on the task or stimulus type (pictures of objects, written words or auditory words). Experiments 2 and 3 provide new data not previously reported. In all three experiments, the written words were the names of the objects presented in the pictures. This ensured that object identity was the same irrespective of stimulus modality.
Experiment 1 involved the re‐analysis of the data from Noppeney et al. [ 2006], so that we could focus on how left OT activation was influenced by stimulus modality (written words vs. pictures) and the interaction of stimulus modality with category (animals vs. tools) and task (semantic vs. non‐semantic). Each task involved a one‐back decision (see later for details). The task of most interest was the one‐back ‘identity’ task (press a button if the same object is repeated) because it corresponded to that used by Hasson et al. [ 2002]. However, while Hasson et al. [ 2002] compared written Hebrew word and picture processing in six Hebrew speaking subjects, our re‐analysis of Noppeney et al. [ 2006] compared written English word and picture processing in 161 (10 male) right‐handed English subjects (mean age 25 years; range 19–35 years).
Experiment 2 reports data from 15 new English subjects (right‐handed; 10 males; mean age 28 years; range 20–45 years) performing a semantic categorisation task on pictures of objects or their written names. Data from the same paradigm (different stimuli) were collected from each subject twice on the same day, once on our 1.5‐T scanner and once on our 3‐T scanner. This allowed us to investigate whether differential activation for pictures of objects and their written names: (a) replicates within subject; and (b) depends on static magnetic field strength.
Experiment 3 investigated whether the findings reported in Experiments 1 and 2 change when the spatial resolution is increased. To equate our findings to those of Hasson et al. [ 2002], we used a one‐back identity task in Hebrew and English. This allowed us to compare the effects of different orthographies. We also examined the effect of task by comparing word and picture activations during naming and the one‐back identity task in a fully balanced 2 (stimulus modality) × 2 (task) × 2 (language) factorial design. The subjects were three Hebrew–English bilinguals (two right‐handed, two male, ages 24–53 years). All were fluent in both Hebrew (having lived in Israel until at least 21 years of age) and English (two subjects having both languages as a mother tongue and having lived in the UK for the past 3 years, the third subject having used English from 7 years of age and having lived in the UK for the past 35 years). All currently regularly spoke, read and wrote both English and Hebrew.
Stimuli and Tasks
In Experiment 1, there were 180 different objects (90 animals and 90 tools). During each of three tasks (including the one‐back identity task of interest), and in each subject, 60 objects were presented as a picture, 60 others as a written name and 60 others as a spoken name. Stimuli were presented in blocks of five of a type. In the one‐back identify task, subjects were instructed to press a key pad if the stimulus was identical to the preceding stimulus (e.g. horse, horse). There were two versions of the one‐back semantic task. In one version, subjects were instructed to press a key pad if the stimulus had the same associated action as the previous stimulus (e.g. bee, bird). In the other semantic one‐back task, subjects decided if the stimulus was approximately the same size as the previous item (e.g. pigeon, rabbit). About 30% of the stimuli were targets. Yes/No responses to all conditions were indicated (as quickly and accurately as possible) by a two‐choice key press. The stimuli (stimulus onset asynchrony (SOA) 3.3 s; stimulus duration 1.2 s) were presented in blocks of five interleaved with 5.5‐s fixation. The order of stimulus presentation for each task was fully counterbalanced within and between subjects.
In Experiment 2, there were 192 different objects (96 animals and 96 tools). Two different stimulus sets were created, one for each scanner. Within each set, half the items were presented as pictures and the other half were presented as written names. Stimulus modality was blocked with six stimuli per block (SOA 3.3150 s, stimulus duration = 1200 ms) preceded by a category name (e.g. water birds) for 4.1 s (total block time = 24 s, followed by 16 s of fixation). Subjects had to indicate with a Yes/No button press whether each item (e.g. ‘swan’, ‘blackbird’, ‘robin’ etc.) belonged to the given category name. Note that this subordinate categorisation task required specific semantic knowledge irrespective of the stimulus type (words or pictures). Therefore, it could not be achieved by either lexical or visual strategies that might be specific to one or other stimulus modality. Task was kept constant throughout the experiment. Stimulus modality, category and scanner order were counterbalanced within and between subjects.
In Experiment 3, 180 common objects or animals were selected with names that were 3–7 characters long in both English and Hebrew. Each object was presented as a picture, an English word and a Hebrew word. Stimuli were blocked and preceded by an instruction that indicated whether the subject should perform the one‐back identity task (press a button if the stimulus is identical to the previous) or the naming task (name picture or read words). There were four experimental runs (each lasting 244.8 s). Task (name vs. one‐back) and stimulus modality (pictures vs. words) were counterbalanced within run. The order of language (Hebrew vs. English) was counterbalanced over run. In two runs, subjects were presented with Hebrew words only (including the instructions) and named pictures in Hebrew. In the other two runs, words were presented in English and subjects named pictures in English.
There were 12 stimuli per block, with each block lasting 12.24 s and followed by a 12.24 s of fixation on a cross‐hair. Within each block, each stimulus was presented for 200 ms at a rate of one every 1.02 s (a fixation cross was displayed between the stimuli)—this rate and duration were chosen to match those used in Hasson et al. [ 2002]. In the naming blocks, 12 different stimuli were presented. In the one‐back task 1, 2 or 3 (average 2) of the 12 stimuli were repeated items (to create the targets). Over the experiment there were 48 stimuli for each of the eight conditions. All stimuli (pictures and words) were displayed at a similar size. To minimise artefacts generated from motion during the naming task, subjects were instructed to whisper their response with minimal lip movement.
fMRI Data Acquisition
Experiment 1 was conducted on a 1.5‐T Siemens Sonata system whilst Experiment 3 used a 3 T Siemens Allegra system. In Experiment 2, data were acquired on both of these scanners. T2* weighted echoplanar images were acquired using standard head RF receiver coils. In all three experiments, to avoid Nyquist ghost artefacts, a generalised reconstruction algorithm was used for data processing [Josephs et al., 2000]. The first six volumes (‘dummies’) from each session were discarded to allow for T1 equilibration effects. T1 anatomical volume images were also acquired.
In Experiment 1, fMRI data were acquired on the 1.5‐T scanner (TE = 50 ms; TR = 2.97 s, spatial resolution 3 × 3 × 3.4 mm3 voxels) [see Noppeney et al., 2006 for details]. There were three sessions with a total of 340 volume images per session.
In Experiment 2, fMRI data were obtained on both the 1.5 and 3 T scanners. The EPI acquisition used a 64 × 64 image matrix, with voxel dimensions of 3 × 3 and 2‐mm slice thickness with 1‐mm interslice gap. Each functional scan consisted of 33 slices. At 1.5 T the TR was 2.97 s, the TE was 50 ms and the EPI acquisition window was 32 ms. At 3 T the TR was 2.145 s, the TE was 30 ms and the EPI acquisition window was 21 ms (the shorter acquisition window was made feasible by the fast‐switching head gradient coils of the Allegra scanner). With these imaging parameters, for a gel phantom with a T2 of 80 ms, single voxel SNR was 60 at 1.5 T and 120 at 3 T. There were two sessions in each scanner, although only data from the first session in each scanner is reported here. This first session included a total of 218 volume images in the 1.5‐T scanner and 298 volume images in the 3‐T scanner.
In Experiment 3, the goal during data acquisition was to maximise spatial resolution. fMRI data were obtained on the 3‐T scanner with a single‐shot gradient echo isotropic high‐resolution EPI sequence [see Haynes et al., 2005 for details]. Voxel size was 1.5 × 1.5 × 1.5 mm3. Manual positioning of the area covered ensured that it contained the ROI. There were four sessions, each with 87 scans.
fMRI Data Analysis
The data from all three experiments were analysed using SPM2 software (http://www.fil.ion.ucl.ac.uk). In all three experiments, analysis was performed at the single subject level, although the data from Experiment 1 also underwent an additional analysis at the group level.
During preprocessing, in all three Experiments the scans from each subject were realigned using the first as a reference. In Experiments 1 and 2 standard procedures in SPM2 were used to resample the data to 2 × 2 × 2 mm3 in standard MNI space (using the MNI‐305 template from the Montreal Neurological Institute, ICBM NIH P‐20 project). In Experiment 2 the data obtained at both 1.5 and 3 T were analysed separately. In Experiment 3 each subject's functional scans were re‐aligned and re‐sliced, but did not undergo unwarping.
The data in Experiments 1 and 2 were then spatially normalised to a standard EPI template in SPM using non‐linear basis functions. This does not lead to the loss of observed activation, but has advantages including (i) facilitating inter‐subject comparisons by avoiding potential user bias in the anatomical ascription of activation; (ii) enabling easier relation to other studies; and (iii) enabling the group level analysis conducted in Experiment 1. In Experiment 3, however, we did not spatially normalise the acquired data. Instead, the functional scans were co‐registered with the structural images.
To maximise our spatial resolution, data from Experiment 3 were analysed without spatial smoothing. To maximise sensitivity, data from Experiments 1 and 2 were spatially smoothed using a Gaussian kernel full width half maximum of 6 mm (twice the 3‐mm voxel size). The rationale was as follows: (i) by the matched filter theorem the optimum smoothing kernel corresponds to the size of the effect one anticipates, with the spatial scale of haemodynamic responses according to high‐resolution optical imaging being ∼2–5 mm [Friston, 2004]; (ii) errors will be rendered more normal in their distribution, ensuring the validity of inferences based on parametric tests; and (iii) when using Gaussian random field theory, the assumption that error terms are a reasonable lattice representation of an underlying and smooth Gaussian field also necessitates that the smoothness be substantially greater than the voxel size [Friston, 2004]. To ensure that we did not lose true positive results when the data were smoothed, we compared reading activations in three subjects with and without smoothing. None of the three subjects demonstrated an activation peak with unsmoothed data that was not also seen in the analysis of smoothed data (see also Starrfelt and Gerlach [ 2007], who also assessed the effect of spatial smoothing in an experiment comparing words and objects).
Statistical analyses
In all three experiments, each trial (word or picture) was modelled as a separate event and convolved with a canonical haemodynamic response function. To exclude low‐frequency confounds, the data were high‐pass filtered using a set of discrete cosine basis functions with a cut‐off period of 128 s. The statistical contrasts focused on the direct comparison of words to pictures in each subject. In Experiment 1, our contrasts at the individual subject level summed over object category and focused on the one‐back identity task only. However, at the group level, the second level ANOVA was based on six contrasts pertaining to words > fixation (for each of the three tasks and each of the two categories) as well as the corresponding six contrasts for pictures relative to fixation. This allowed us to test the main effect of stimulus modality (words vs. pictures) as well as the interaction of stimulus modality with task (semantic vs. identity) and category (animals vs. tools). In Experiment 2, the task was semantic decision and again we summed over category. In Experiment 3, we examined word and picture activations for both tasks (one‐back identity and reading/naming) and for each orthography separately and summed over orthography. Finally, we conducted a second level ANOVA on data from Experiment 1 to illustrate relative effect sizes for all conditions at the group level.
Regions of interest
In Experiments 1 and 2, we used two ROIs. One was a sphere of 10‐mm radius centred at −42,−56,−14, which is in the middle of the left OT sulcus where the visual word form area was first defined [Cohen et al., 2000, 2002]. The second ROI was more posterior, centred at −42,−70,−14 with a 5‐mm radius. Together these two search volumes allowed us to identify any possible word selectivity effects along 30 mm of the OT sulcus (y = −46 to −75). In Experiment 3, we were unable to use the same co‐ordinate system, because the data were not spatially normalised. Therefore, we had to identify ROIs based on the activation for the main effect of reading (i.e. written words summed over all conditions relative to fixation). The peak of reading activation around the left OT sulcus was then labelled with co‐ordinates x = 0, y = 0, z = 0. This allowed us to estimate how much peak activation for each of the conditions varied from the main effect of reading. In the left‐handed subject (DC), reading activation was strongly left lateralised. Therefore, as in the other subjects, we focus on left rather than right OT activations.
RESULTS
Experiment 1: Comparing Words and Pictures During a One‐Back Task
Our analyses focus on the one‐back identity task, as this corresponds to the task used by Hasson et al. [ 2002]. As reported in Noppeney et al. [ 2006], response times for the one‐back identity task did not differ for written words (625 ms) or pictures of objects (636 ms), and there was no interaction of stimulus modality (words vs. pictures) with stimulus category (animals vs. tools). Error rates were also less than 2% for both words and pictures.
Our single subject analyses of the fMRI data revealed that in our main ROI, using a low statistical threshold (P < 0.05, uncorrected), all 16 subjects activated 10 or more voxels for pictures relative to words and 9/16 subjects activated one or more voxels for words relative to pictures (Table I). In our more posterior ROI (centred on y = −70), 11 of the 16 subjects showed activation for pictures > written words, but only three showed increased activation for written words > pictures (none > two voxels) (Table II).
Table I.
Experiment 1: Effect of stimulus modality (words vs. pictures) at the individual level (centred around –42,–56,–14)
| Sub. no. | Written words > objects | Objects > written words | ||||||||
|---|---|---|---|---|---|---|---|---|---|---|
| x | y | z | Z | No. of voxels | x | y | z | Z | No. of voxels | |
| 1 | −50 | −52 | −16 | 1.89 | 1 | −38 | −58 | −12 | 2.62 | 114 |
| −42 | −54 | −22 | 2.55 | |||||||
| −34 | −56 | −20 | 2.41 | |||||||
| −38 | −48 | −18 | 1.72 | |||||||
| −46 | −60 | −6 | 1.78 | 1 | ||||||
| −36 | −64 | −14 | 1.75 | 1 | ||||||
| 2 | −46 | −58 | −22 | 2.74 | 19 | −42 | −52 | −8 | 1.95 | 10 |
| −38 | −48 | −14 | 1.73 | 1 | ||||||
| 3 | −36 | −50 | −18 | 1.93 | 4 | −46 | −48 | −18 | 1.95 | 3 |
| −34 | −62 | −14 | 1.9 | 6 | ||||||
| −50 | −56 | −16 | 1.77 | 7 | ||||||
| −42 | −46 | −14 | 1.77 | 1 | ||||||
| −40 | −56 | −6 | 1.74 | 2 | ||||||
| 4 | −48 | −48 | −14 | 1.75 | 1 | −34 | −58 | −10 | 2.75 | 82 |
| −32 | −56 | −14 | 2.72 | |||||||
| −40 | −52 | −6 | 2.42 | |||||||
| −42 | −64 | −10 | 2.29 | |||||||
| −40 | −64 | −18 | 1.8 | |||||||
| −40 | −48 | −18 | 1.69 | 1 | ||||||
| 5 | n.s. | −38 | −48 | −16 | 2.63 | 52 | ||||
| −46 | −48 | −10 | 2.2 | |||||||
| −42 | −48 | −8 | 2.03 | |||||||
| 6 | −46 | −50 | −12 | 2.21 | 18 | −38 | −64 | −18 | 3.69 | 124 |
| 7 | n.s. | −38 | −58 | −16 | 3.23 | 155 | ||||
| −50 | −50 | −14 | 2.56 | |||||||
| −50 | −52 | −10 | 2.37 | |||||||
| −44 | −50 | −20 | 2.26 | |||||||
| −46 | −64 | −12 | 2.23 | |||||||
| −38 | −52 | −22 | 1.8 | |||||||
| 8 | −44 | −60 | −14 | 1.85 | 6 | −34 | −60 | −18 | 3.11 | 20 |
| −50 | −54 | −16 | 1.73 | 3 | −44 | −52 | −22 | 2.13 | 8 | |
| −38 | −52 | −22 | 1.79 | |||||||
| 9 | n.s. | −42 | −58 | −22 | 2.3 | 9 | ||||
| −40 | −60 | −6 | 2.2 | 5 | ||||||
| 10 | −44 | −48 | −14 | 2.5 | 13 | −36 | −62 | −18 | 3.3 | 38 |
| −44 | −54 | −6 | 2.1 | 5 | −34 | −56 | −12 | 2.1 | ||
| −50 | −58 | −18 | 2.3 | 9 | ||||||
| 11 | n.s. | −42 | −56 | −22 | 4.2 | 231 | ||||
| −50 | −54 | −16 | 3.1 | |||||||
| −50 | −56 | −10 | 2.9 | |||||||
| −34 | −60 | −10 | 2.6 | |||||||
| −42 | −66 | −14 | 2 | 1 | ||||||
| 12 | n.s. | −44 | −58 | −18 | 2.3 | 34 | ||||
| −50 | −60 | −16 | 2 | |||||||
| −40 | −62 | −20 | 1.8 | |||||||
| 13 | −44 | −64 | −14 | 1.9 | 3 | −44 | −48 | −14 | 3.2 | 117 |
| −36 | −50 | −18 | 2.5 | |||||||
| −46 | −56 | −6 | 1.7 | 1 | ||||||
| 14 | n.s. | −42 | −66 | −14 | 3.1 | 20 | ||||
| −36 | −60 | −20 | 3.1 | 32 | ||||||
| −34 | −54 | −12 | 2.1 | 14 | ||||||
| −50 | −56 | −14 | 2 | 7 | ||||||
| 15 | −44 | −52 | −12 | 2.4 | 52 | −38 | −58 | −22 | 3 | 59 |
| −36 | −50 | −10 | 2.2 | |||||||
| 16 | n.s. | −34 | −58 | −18 | 3 | 26 | ||||
| −32 | −56 | −14 | 2.1 | |||||||
| −44 | −50 | −12 | 2.4 | 30 | ||||||
| −36 | −54 | −8 | 1.9 | |||||||
Only data from the ‘identity’ one‐back task are included. All reported activation (peaks P < 0.05, uncorrected) are within a sphere of 10‐mm radius centred on –42,–56,–14. All local maxima more than 4 mm apart are shown. Where a cluster of activation showed more than one local maximum, the number of activated voxels for the cluster as a whole is shown.
Table II.
Experiment 1: Effect of stimulus modality (written words vs. pictures) at the individual level in the more posterior region (centred around –42,–70,–14)
| Sub. no. | Written words > objects | Objects > written words | ||||||||
|---|---|---|---|---|---|---|---|---|---|---|
| x | y | z | Z | No. of voxels | x | y | z | Z | No. of voxels | |
| 1 | n.s. | −38 | −72 | −12 | 1.91 | 3 | ||||
| 2 | n.s. | n.s. | ||||||||
| 3 | n.s. | n.s. | ||||||||
| 4 | n.s. | −44 | −74 | −16 | 2.2 | 4 | ||||
| −40 | −66 | −12 | 2.15 | 10 | ||||||
| 5 | −40 | −70 | −18 | 1.84 | 2 | n.s. | ||||
| 6 | n.s. | −38 | −70 | −14 | 3.47 | 41 | ||||
| −44 | −72 | −18 | 2.35 | |||||||
| 7 | n.s. | −40 | −72 | −18 | 2.47 | 55 | ||||
| −40 | −66 | −16 | 2.33 | |||||||
| 8 | n.s. | −44 | −70 | −18 | 1.72 | 1 | ||||
| 9 | n.s. | n.s. | ||||||||
| 10 | −40 | −74 | −12 | 1.71 | 1 | −38 | −68 | −16 | 3.36 | 16 |
| 11 | n.s. | −40 | −68 | −18 | 3.14 | 52 | ||||
| 12 | n.s. | n.s. | ||||||||
| 13 | −44 | −66 | −14 | 1.86 | 2 | −42 | −74 | −12 | 2.39 | 16 |
| −44 | −74 | −16 | 2.36 | |||||||
| 14 | n.s. | −42 | −70 | −18 | 3.5 | 60 | ||||
| −44 | −66 | −14 | 3.42 | |||||||
| 15 | n.s. | −44 | −72 | −10 | 2.49 | 6 | ||||
| 16 | n.s. | −38 | −72 | −12 | 2.1 | 9 | ||||
This table was produced by the same methods as in Table I, except that the region of interest was a sphere of 5‐mm radius centred on –42,–70,–14.
Examination of Tables I and II clearly shows that in all but one subject: (a) many more voxels showed greater activation for pictures than words; (b) the height of the differential effect was greater for pictures than words; (c) the location of differential effects within the ROI varied between subjects; and (d) there was no clear spatial relationship between word and picture activation. Consequently, when data are analysed at the group level, activation is higher for pictures than words irrespective of object category (Table III and Fig. 1). The group level analysis also found no evidence for an interaction of stimulus modality with either task (one‐back semantic vs. one‐back identity) or object category (animal vs. tool), even though there was a trend for left OT activation to be higher for the semantic than identity tasks and for animals relative to tools (Table III and Fig. 1).
Table III.
Experiment 1: Activation at the group level
| All | Animals | Tools | |
|---|---|---|---|
| Pictures > written words | −40 −56 −14 (3.6) | −42 −56 −14 (2.1) | −40 −56 −14 (2.9) |
| −34 −58 −18 (>8) | −38 −56 −14 (3.7) | −38 −56 −14 (4.6) | |
| −42 −68 −10 (6.5) | −42 −64 −10 (4.2) | −40 −64 −10 (3.4) | |
| All | Pictures | Written words | |
| Animals > tools | n.s. | −40 −52 −20 (2.91) | n.s. |
| n.s. | +40 −62 −20 (3.9) | n.s. | |
| All | Pictures | Written words | |
| Semantic > identity | −42 −56 −14 (3.5) | −46 −52 −10 (3.4) | −48 −58 −14 (5.1) |
| −50 −58 −12 (5.9) | −54 −58 −10 (5.3) | −52 −52 −10 (4.8) |
Group level effects of stimulus modality (written words vs. pictures), object category (animals vs. tools) and task (one‐back semantic vs. one‐back identity).
Figure 1.
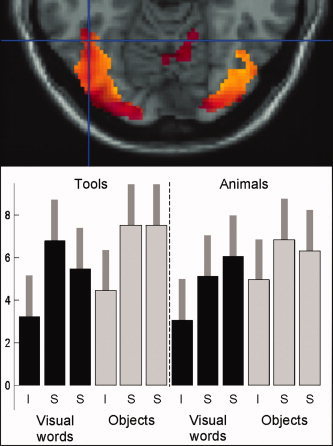
Experiment 1: Activation at the group level. Upper panel shows activation in left OT during the ‘identity’ one‐back task for (i) words > fixation in red (P < 0.001 uncorrected); and (ii) pictures > words in yellow (P < 0.5 uncorrected, inclusively masked with words > fixation at P < 0.001 uncorrected). The overlap of these two effects is shown in orange. Therefore, the red areas are activated for words > fixation but not for pictures > words. However, none of the voxels in our ROI (centred on the cross‐hairs at −42,−56,−14) are red, because they are all more activated by pictures than words at the group level. Lower panel shows the effects of interest at −42,−56,−14, with contrast estimates and 90% confidence intervals shown for each of the six conditions involving visual words and each of the six conditions involving objects. ‘I’ refers to the identity one‐back task and ‘S’ refers to the two semantic tasks, including both the explicit action semantic task and the explicit visual semantic task; see Noppeney et al. [ 2006] for details.
To conclude, the results of this experiment demonstrate that, even when activation is higher for pictures than words at the group level, we can still detect voxels within the ROI that are more activated for words than pictures at the individual subject level if we use liberal statistical thresholds. Our next question concerns whether the inconsistent effects of words relative to pictures are the consequence of individual variability or false positives. To address this question, we need to investigate whether activation for words relative to pictures can be replicated within subject.
Experiment 2: Replicating Effects Within Subjects During a Semantic Decision Task at 1.5 and 3 T
Mean co‐ordinates across subjects for activation for words relative to fixation and pictures relative to fixation at both 1.5 and 3 T are shown in Table IV. The results of the single subject comparisons of word and picture processing at 1.5 and 3 T are shown in Tables V and VI. The effect of magnetic field strength is summarised in Table VII. Overall, the results can be summarised as follows: First, we demonstrate a very reassuring consistency in the spatial localisation of effects across scanners. Specifically, we found that (a) activation for words relative to fixation was consistently localised across the 1.5‐ and 3‐T scanners in 14/15 subjects (Fig. 2 and Table IV); (b) a subset of voxels from our ROI were activated in 15/15 subjects for pictures relative to words in both scanners (Tables V and VI); and (c) in 12/15 of these subjects, the peak effect for pictures relative to words in one scanner was within 4 mm of the peak for pictures relative to words in the other scanner (Tables V and VI).
Table IV.
Experiment 2: Mean coordinates of activation across subjects for words relative to fixation and pictures relative to fixation at both 1.5 and 3 T
| Contrast | Peak coordinates (mean) | |||||
|---|---|---|---|---|---|---|
| 1.5 T | 3 T | |||||
| x | y | z | x | y | z | |
| Words > fixation | −41 (4)a | −58 (5) | −18 (4) | −42 (4) | −58 (5) | −19 (4) |
| Pictures > fixation | −39 (5) | −58 (4) | −18 (4) | −39 (4) | −58 (4) | −20 (4) |
The mean coordinates (and standard deviation), Z scores and number of voxels pertain to the most significant activation peak identified in each subject, identified and reported at each static magnetic field strength (1.5 and 3 T).
Values in parentheses indicate SDs.
Table V.
Experiment 2: Effect of stimulus modality (words vs. pictures) at −42,−56, −14 at both 1.5 and 3 T
| Sub. no. | 1.5 T | 3 T | ||||||||||||||||||
|---|---|---|---|---|---|---|---|---|---|---|---|---|---|---|---|---|---|---|---|---|
| Words–pictures | Pictures–words | Words–pictures | Pictures–words | |||||||||||||||||
| x | y | z | Z | No. of voxels | x | y | z | Z | No. of voxels | x | y | z | Z | No. of voxels | x | y | z | Z | No. of voxels | |
| 1 | −42 | −46 | −14 | 1.7 | 1 | −34 | −60 | −14 | 2.23 | 16 | n.s. | −34 | −60 | −18 | 3.33 | 119 | ||||
| −46 | −58 | −10 | 2.00 | 14 | −32 | −56 | −14 | 3.32 | ||||||||||||
| −34 | −62 | −14 | 3.14 | |||||||||||||||||
| −34 | −52 | −14 | 3.08 | |||||||||||||||||
| 2 | n.s. | −38 | −52 | −22 | 3.15 | 242 | n.s. | −34 | −52 | −18 | 2.41 | 12 | ||||||||
| −40 | −56 | −22 | 3.08 | −42 | −56 | −4 | 2.03 | 1 | ||||||||||||
| −46 | −64 | −18 | 3.05 | |||||||||||||||||
| −34 | −54 | −12 | 2.39 | |||||||||||||||||
| 3 | −46 | −52 | −6 | 1.90 | 2 | −36 | −56 | −14 | 2.60 | 35 | n.s. | −42 | −64 | −20 | 4.15 | 152 | ||||
| −46 | −64 | −10 | 2.19 | 15 | −48 | −62 | −10 | 3.68 | ||||||||||||
| −34 | −56 | −20 | 3.27 | |||||||||||||||||
| −34 | −52 | −18 | 3.05 | |||||||||||||||||
| 4 | n.s. | −34 | −56 | −20 | 3.10 | 67 | n.s. | −34 | −56 | −20 | 7.26 | 176 | ||||||||
| −34 | −52 | −18 | 2.95 | −42 | −62 | −6 | 3.36 | |||||||||||||
| −42 | −56 | −24 | 2.05 | −38 | −64 | −10 | 3.31 | |||||||||||||
| −36 | −56 | −6 | 1.80 | 3 | −46 | −56 | −22 | 2.19 | ||||||||||||
| 5 | n.s. | −48 | −58 | −20 | 3.36 | 130 | −46 | −62 | −16 | 3 | 120 | −34 | −54 | −18 | 1.99 | 4 | ||||
| −32 | −56 | −14 | 2.56 | −40 | −52 | −10 | 1.8 | |||||||||||||
| −34 | −52 | −16 | 2.42 | |||||||||||||||||
| −36 | −64 | −14 | 2.14 | |||||||||||||||||
| 6 | n.s. | −36 | −62 | −16 | 2.57 | 40 | n.s. | −36 | −62 | −18 | 4.61 | 177 | ||||||||
| −48 | −56 | −6 | 1.70 | 1 | −34 | −56 | −20 | 4.39 | ||||||||||||
| 7 | −38 | −50 | −8 | 3.45 | 22 | −34 | −62 | −14 | 3.17 | 202 | n.s. | −34 | −52 | −18 | 4.36 | 393 | ||||
| −44 | −58 | −16 | 2.63 | −46 | −56 | −16 | 3.64 | |||||||||||||
| −48 | −62 | −14 | 3.64 | |||||||||||||||||
| 8 | n.s. | −34 | −60 | −18 | 2.02 | 4 | −50 | −56 | −20 | 3.2 | 173 | −34 | −52 | −18 | 1.79 | 2 | ||||
| −36 | −50 | −12 | 1.85 | 4 | −46 | −62 | −16 | 3.0 | ||||||||||||
| 9 | n.s. | −44 | −54 | −14 | 2.92 | 136 | n.s. | −36 | −62 | −18 | 4.23 | 252 | ||||||||
| −36 | −52 | −20 | 2.19 | |||||||||||||||||
| −38 | −64 | −18 | 2.16 | |||||||||||||||||
| −42 | −62 | −6 | 1.94 | |||||||||||||||||
| 10 | −50 | −56 | −8 | 1.71 | 1 | −34 | −58 | −12 | 3.23 | 82 | −50 | −56 | −18 | 1.88 | 6 | −36 | −62 | −18 | 3.45 | 63 |
| −32 | −56 | −14 | 3.00 | |||||||||||||||||
| 11 | −46 | −50 | −14 | 1.91 | 6 | −36 | −60 | −18 | 2.53 | 86 | n.s. | −36 | −60 | −20 | 3.20 | 76 | ||||
| −34 | −52 | −18 | 2.51 | −44 | −64 | −12 | 1.86 | |||||||||||||
| −38 | −62 | −8 | 2.35 | |||||||||||||||||
| 12 | −46 | −48 | −18 | 2.35 | 18 | −40 | −56 | −12 | 3.60 | 144 | −50 | −56 | −8 | 1.87 | 2 | −36 | −60 | −20 | 3.95 | 212 |
| −32 | −56 | −14 | 2.91 | |||||||||||||||||
| −40 | −60 | −6 | 1.80 | |||||||||||||||||
| −38 | −56 | −6 | 1.78 | |||||||||||||||||
| 13 | n.s. | −36 | −52 | −12 | 1.88 | 8 | n.s. | −42 | −64 | −10 | 4.69 | 294 | ||||||||
| −44 | −58 | −22 | 3.46 | |||||||||||||||||
| −34 | −60 | −18 | 3.25 | |||||||||||||||||
| −34 | −62 | −14 | 3.18 | |||||||||||||||||
| −32 | −56 | −14 | 2.31 | |||||||||||||||||
| 14 | n.s. | −36 | −60 | −20 | 3.84 | 125 | n.s. | −36 | −56 | −22 | 5.64 | 190 | ||||||||
| −34 | −56 | −10 | 2.99 | −36 | −60 | −20 | 5.20 | |||||||||||||
| −46 | −48 | −10 | 1.85 | 1 | −42 | −56 | −24 | 3.79 | ||||||||||||
| −46 | −64 | −10 | 2.94 | |||||||||||||||||
| 15 | −50 | −54 | −18 | 2.45 | 15 | −34 | −56 | −20 | 3.70 | 173 | n.s. | −34 | −56 | −20 | 2.66 | 118 | ||||
| −32 | −56 | −14 | 3.34 | −46 | −56 | −20 | 2.41 | |||||||||||||
| −44 | −62 | −14 | 1.80 | |||||||||||||||||
See Table I for inclusion criteria. The effects of words relative to pictures were not affected by the order in which subjects were scanned. Subjects 2, 5, 7, 8, 10, 12, 13 and 14 were scanned at 3 T first, whilst the remainder were scanned at 1.5 T first.
Table VI.
Experiment 2: Effect of stimulus modality (words vs. pictures) in the more posterior ROI (centred around –42,–70,–14) at both 1.5 and 3 T
| Sub no. | 1.5 T | 3 T | ||||||||||||||||||
|---|---|---|---|---|---|---|---|---|---|---|---|---|---|---|---|---|---|---|---|---|
| Words–pictures | Pictures–words | Words–pictures | Pictures–words | |||||||||||||||||
| x | y | z | Z | No. of voxels | x | y | z | Z | No. of voxels | x | y | z | Z | No. of voxels | x | y | z | Z | No. of voxels | |
| 1 | n.s. | n.s. | n.s. | −40 | −66 | −14 | 2.5 | 40 | ||||||||||||
| 2 | n.s. | −46 | −68 | −16 | 3 | 24 | n.s. | n.s. | ||||||||||||
| 3 | n.s. | −46 | −68 | −16 | 2.9 | 32 | n.s. | −44 | −68 | −18 | 4 | 81 | ||||||||
| −42 | −72 | −10 | 3.7 | |||||||||||||||||
| 4 | n.s. | −44 | −72 | −10 | 2 | 5 | n.s. | −38 | −70 | −12 | 4.8 | 52 | ||||||||
| 5 | n.s. | −38 | −72 | −14 | 2.5 | 26 | −44 | −66 | −16 | 1.7 | 1 | n.s. | ||||||||
| −44 | −66 | −14 | 2 | |||||||||||||||||
| 6 | n.s. | n.s. | n.s. | −44 | −72 | −10 | 4.6 | 77 | ||||||||||||
| −38 | −68 | −16 | 4.5 | |||||||||||||||||
| 7 | n.s. | −38 | −70 | −12 | 2.3 | 38 | n.s. | −44 | −68 | −18 | 3.3 | 78 | ||||||||
| −44 | −66 | −16 | 2 | −38 | −72 | −12 | 2.9 | |||||||||||||
| 8 | n.s. | −38 | −68 | −16 | 1.7 | 1 | −44 | −66 | −14 | 2.4 | 11 | −38 | −72 | −16 | 4.3 | 21 | ||||
| 9 | n.s. | −42 | −72 | −10 | 2.2 | 38 | n.s. | −44 | −74 | −14 | 3.5 | 81 | ||||||||
| −40 | −68 | −18 | 3.3 | |||||||||||||||||
| 10 | n.s. | n.s. | n.s. | −40 | −66 | −16 | 1.7 | 1 | ||||||||||||
| 11 | −46 | −68 | −16 | 1.9 | 7 | −38 | −72 | −16 | 2.3 | 9 | n.s. | −40 | −68 | −18 | 1.9 | 10 | ||||
| 12 | n.s. | n.s. | n.s. | −40 | −68 | −18 | 2.9 | 39 | ||||||||||||
| −46 | −72 | −12 | 2.5 | |||||||||||||||||
| 13 | n.s. | −42 | −74 | −12 | −44 | −66 | −12 | 4.6 | 75 | |||||||||||
| −44 | −74 | −14 | 4 | |||||||||||||||||
| 14 | n.s. | −40 | −70 | −18 | 2.2 | 10 | n.s. | −44 | −68 | −10 | 3.1 | 20 | ||||||||
| −40 | −70 | −18 | 2.9 | 19 | ||||||||||||||||
| 15 | n.s. | −44 | −74 | −16 | 3.5 | 43 | ns | −44 | −74 | −16 | 3.7 | 51 | ||||||||
See Table II for inclusion criteria.
Table VII.
Experiment 2: Effect of static magnetic field strength across subjects
| Contrast | No. of subjects | Mean Z score | Mean voxels | |||
|---|---|---|---|---|---|---|
| 1.5 T | 3 T | 1.5 T | 3 T | 1.5 T | 3 T | |
| Words > fixation | 15 | 14 | 3.78 | 5.32 | 237 | 258 |
| Words > pictures | 7 | 4 | 2.21 | 2.50 | 9 | 75 |
| Pictures > words | 15 | 15 | 2.93 | 3.85 | 102 | 149 |
No. of subjects refers to the number of subjects (out of 15) with a significant effect at P < 0.05 uncorrected. Mean Z score refers to the Z score for each effect summed over these subjects. Mean voxels refers to the number of voxels for each effect, summed over these subjects.
Figure 2.
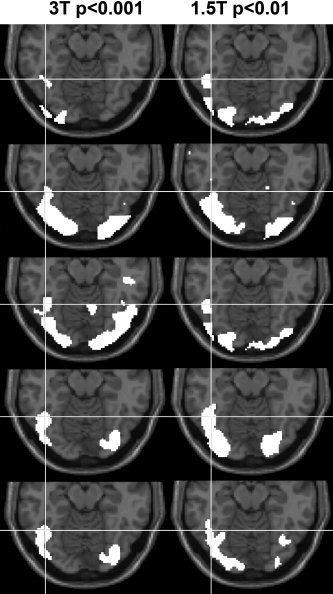
Experiment 2: Words more than fixation at 1.5 and 3 T. Activation for words > fixation is shown in white for five individual subjects. Each row displays data from one individual subject at both 3 T (left‐hand column) and 1.5 T (right‐hand column). The statistical threshold at 3 T was P < 0.001 uncorrected (extent threshold 500 voxels) but at 1.5 T the statistical threshold was lowered to P < 0.01 (extent threshold 500 voxels), because the latter was less sensitive at an individual subject level in this region. The white cross‐hair indicates the centre of our region of interest (−42,−56,−14) on axial slices (z = −14 mm in MNI space). The five subjects (rows 1–5) correspond to subjects 3, 4, 5, 8 and 12, respectively, in Table V.
Second, we demonstrate that, although the effects of pictures relative to words were consistently localised irrespective of scanner, this was not the case for the comparison of words to pictures (Tables V and VI). Indeed, only 2/15 subjects activated one or more left OT voxels for words relative to pictures in both scanners, and in both these subjects the voxels activated for words relative to pictures in one scanner were more than 10 mm away from the voxels activated for words relative to pictures in the other scanner. In the context of mass univariate statistics within our ROIs, a low statistical threshold (P < 0.05 uncorrected) and the absence of any replication within or between subjects, we cannot reject the possibility that activation for words relative to pictures at the individual subject level reflects false positives.
With respect to sensitivity, activation at 3 T was more extensive and more significant than activation at 1.5 T for the contrasts of (i) words more than fixation; (ii) words more than pictures; and (iii) pictures more than words (Table VII). However, as described earlier this increased sensitivity did not alter the findings with respect to the inconsistent activation for words relative to pictures. In summary, irrespective of magnetic field strength, activation for pictures compared to words was more significant and more extensive than words compared to pictures in both lateral (x = −40 to −50) and medial (x = −34 to −38) sections of our two ROIs (Tables V and VI).
Experiment 3: Identifying Peak Activation for Words and Pictures at High Resolution
In all three subjects, two ROIs were identified on the basis of increased activation for words relative to fixation (Table VIII). The comparison of pictures to fixation (pooled over tasks and languages) activated almost identical voxels (Table VIII and Fig. 3). Furthermore, there was a striking degree of concordance amongst the activation peaks seen in each of the eight conditions in our design (Table VIII).
Table VIII.
Experiment 3: Localisation of activation at high resolution
| Posterior region | Anterior region | |||||||||
|---|---|---|---|---|---|---|---|---|---|---|
| x | y | z | Z | No. of voxels | x | y | z | Z | No. of voxels | |
| Subject RF | ||||||||||
| Words > fixationa | 0 | 0 | 0 | 7.3 | 11 | 1 | 10 | −5 | 7.4 | 43 |
| Pictures > fixationa | −1 | −1 | −1 | 7.8 | 39 | −1 | 8 | −6 | 7.9 | 102 |
| Wordsb | ||||||||||
| Naming, Hebrew | 0 | 0 | 0 | 3.98 | 6 | −2 | 9 | −8 | 43 | 43 |
| Naming, English | 0 | 0 | 0 | 5.23 | 34 | −1 | 8 | −6 | 7.52 | 195 |
| One back, Hebrew | −1 | 0 | 0 | 5.18 | 10 | 0 | 9 | −6 | 4.48 | 38 |
| One back, English | 1 | 2 | 1 | 4.6 | 12 | 3 | 12 | −5 | 3.82 | 13 |
| Objectsb | ||||||||||
| Naming, Hebrew | 0 | −1 | −1 | 3.95 | 14 | −2 | 7 | −8 | 5.4 | 63 |
| 1 | 14 | −2 | 4.79 | |||||||
| Naming, English | −1 | −1 | −1 | 7.36 | 545 | 1 | 10 | −5 | 7.35 | 545 |
| One back, Hebrew | 0 | 0 | 0 | 5.87 | 52 | −1 | 8 | −6 | 5.05 | 70 |
| 2 | 12 | −3 | 4.75 | |||||||
| One back, English | −1 | −1 | −1 | 5.31 | 18 | 1 | 9 | −5 | 5 | 48 |
| Subject DC | ||||||||||
| Words > fixationa | 0 | 0 | 0 | 8.3 | 60 | 2 | 16 | 1 | 8 | 202 |
| Pictures > fixationa | 1 | −1 | −1 | 8.0 | 723 | 2 | 17 | 1 | 7.8 | 111 |
| Wordsb | ||||||||||
| Naming, Hebrew | 0 | 0 | 0 | 7.56 | 142 | 2 | 16 | 1 | 6.76 | 109 |
| Naming, English | 1 | −1 | −1 | 6.7 | 492 | 2 | 17 | 1 | 6.87 | 198 |
| One back, Hebrew | 0 | −1 | 0 | 6.84 | 44 | 2 | 18 | 0 | 6.34 | 138 |
| One back, English | 0 | 0 | 0 | 4.07 | 39 | 2 | 16 | 1 | 5.79 | 205 |
| Objectsb | ||||||||||
| Naming, Hebrew | 0 | −1 | 0 | 6.63 | 482 | 3 | 15 | 3 | 5.97 | 35 |
| Naming, English | 2 | 0 | −2 | 5.74 | 726 | 2 | 15 | 3 | 7.13 | 534 |
| One back, Hebrew | 1 | −1 | −1 | 5.69 | 982 | 2 | 16 | 1 | 5.54 | 88 |
| One back, English | 0 | 0 | 0 | 6.69 | 1159 | 2 | 17 | 1 | 5.23 | 108 |
| Subject DA | ||||||||||
| Words > fixationa | 0 | 0 | 0 | 7.4 | 11 | 6 | 9 | 2 | 7.4 | 51 |
| Pictures > fixationa | 0 | 0 | 0 | 7.2 | 12 | 6 | 10 | 0 | 6 | 5 |
| Wordsb | ||||||||||
| Naming, Hebrew | −3 | 1 | −2 | 4.87 | 17 | 6 | 9 | 2 | 7.28 | 144 |
| Naming, English | 0 | 0 | 0 | 4.89 | 6 | 7 | 12 | 1 | 7.19 | 91 |
| 5 | 8 | 0 | 6.26 | |||||||
| One back, Hebrew | −1 | 0 | 0 | 4.24 | 13 | 7 | 10 | 1 | 3.43 | 2 |
| One back, English | −1 | −1 | −1 | 5.4 | 30 | 5 | 9 | −2 | 3.85 | 7 |
| Objectsb | ||||||||||
| Naming, Hebrew | 0 | 2 | 0 | 3.9 | 13 | 6 | 11 | −1 | 6.23 | 62 |
| Naming, English | 0 | 0 | 0 | 4.52 | 6 | 12 | 10 | 1 | 6.17 | 240 |
| One back, Hebrew | −4 | −1 | 1 | 4.77 | 32 | 6 | 10 | 5 | 3.37 | 3 |
| One back, English | 0 | 0 | 0 | 5.27 | 16 | 9 | 5 | 1 | 3.34 | 1 |
These coordinates are not normalised. They are relative to the activation peaks for words relative to fixation in each subject (i.e. the word peaks are designated 0, 0, 0). Z ≥ 5.2 is corrected for multiple comparisons across the number of voxels scanned. No differential effects of words vs. pictures were seen within 4 mm of the posterior region of interest in Subjects DC and DA, but in Subject RF, activation was higher for pictures than for words (Z = 3.4 with 14 voxels at P < 0.05 uncorrected).
Activation pooled across all conditions (P < 0.05, corrected for whole brain).
Activation for each condition (P < 0.001, uncorrected).
Figure 3.
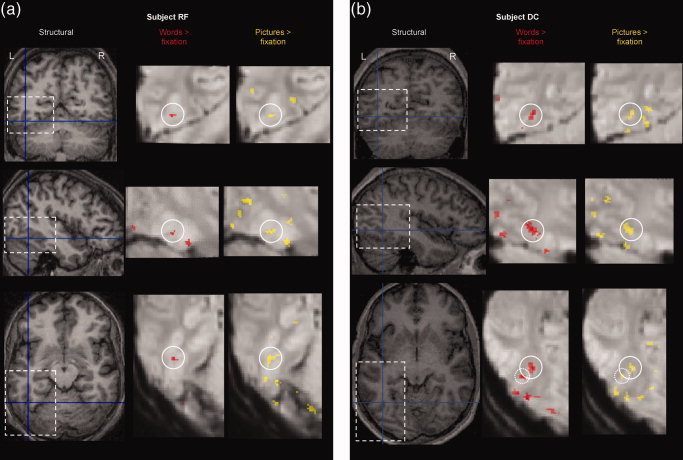
Experiment 3: Localisation of activation at high resolution. (a) highlights activation in subject RF in the posterior region. (b) highlights activation for subject DC in the anterior region. In both subjects this was the location for activation corresponding anatomically to the area of interest in left OT sulcus. On the left side of each page are axial, coronal and sagittal views of the individual subject's structural scan shown at the peak coordinates of activation for words more than fixation. On each view, a dashed box shows the brain region displayed under greater magnification on the right of the page. Activation (across tasks and languages, P < 0.05, corrected for comparisons across the number of voxels scanned, 10 voxel threshold) is shown on the mean echoplanar image in red for words > fixation and yellow for pictures > fixation. The circle shown on each magnified image is centred on the peak coordinates of the activation for words more than fixation. Note that for subject DC, the axial slices also show the posterior region of activation (highlighted with a dashed circle).
DISCUSSION
The aims of this study were to compare left OT responses to pictures of objects and their written names; and also to explore possible sources for the inconsistent results between previously conducted studies [e.g. Hasson et al., 2002; Moore and Price, 1999; Price et al., 2006]. This is important because a critical line of evidence for evaluating competing theories of left OT function in reading revolves around whether left OT activation is higher for written words than pictures of objects.
Our results demonstrate that, although activations for written words are not greater than those for pictures of objects at the group level, it is possible to detect ‘word selectivity’ at the individual subject level using liberal statistical thresholds. At first glance, one interpretation of these results is that word selectivity is at a spatial scale that can only be detected when spatial smoothing and inter‐subject averaging are minimised (i.e. at the individual subject level). However, our data illustrate that there are a number of caveats in this argument. First, without a small volume correction for the number of comparisons being made, the use of a liberal statistical threshold is likely to yield false positives. Second, the exact location of the observed effects varies both between and within subjects (Experiment 2). Third, even at high resolution (such as the 1.5 × 1.5 × 1.5 mm3 voxels in Experiment 3) the peak activation in our OT ROI for written words is virtually identical to the peak activation for pictures of objects. Our word selective effects did not, therefore, withstand statistical scrutiny.
Previous studies have found increased activation for written words relative to low‐level visual stimuli such as checkerboards [Cohen et al., 2000, 2002] but, as discussed in the Introduction, inconsistent results have been obtained when written words are compared to pictures of objects. One might put forward various explanations for the failure of all three experiments in this study to demonstrate consistently increased activation for words relative to objects in left OT, three of which are addressed here. First, it might be proposed that the failure of this study to demonstrate increased activation for words relative to objects is attributable to inadequate spatial resolution arising at the level of data acquisition, preventing the disambiguation of close but separable areas that would otherwise demonstrate greater activation for written words than objects. We cannot, for example, exclude the possibility that within our smallest voxels there are word selective neuronal populations. However, even if this was the case, it would not constitute evidence for a left OT ‘area’ that was selective for words relative to pictures. More critically, if specialisation for reading is at the level of neuronal populations that overlap with object processing areas, then evidence for reading specific responses in left OT will require single cell recordings or techniques with much higher spatial resolution than fMRI. This evidence is not currently available.
Second, one might propose that our experimental protocols may have affected the sensitivity with which activations were identified. However, there were more stimulus events and volume images involved in the relevant contrasts of interest in Experiment 3 in this study than those in Hasson et al. [ 2002]. We also investigated a larger number of subjects in this study (34 in all three experiments) compared to six in Hasson et al. [ 2002]. Furthermore, our paradigms were sufficiently sensitive to detect left OT voxels that were differentially activated by pictures relative to words as demonstrated by a re‐assuring within subject replication in Experiment 2. Nevertheless, the effects of words relative to pictures were weak and did not replicate between or within subjects.
A third possible explanation for the discrepant results between studies might lie in task effects. Models of word and object recognition such as those proposed by [Glaser and Glaser, 1989] suggest that while words access phonology before semantics, objects access semantics before phonology. Such processing differences can result in task‐dependent stimulus modality effects. For example, the perceptual tasks used by some investigators [Gaillard et al., 2006; Hasson et al., 2002; Reinholz and Pollmann, 2005; Starrfeldt and Gerlach, 2007], might be based on lexical or phonological strategies for words and visual strategies for pictures. During naming, however, visual input must be linked to speech production for both words and pictures. Therefore, if left OT plays a role in linking visual to higher processing levels [Devlin et al., 2006; Price and Devlin, 2004; Price and Friston, 2005], demands on this linking process will be more closely matched for words and pictures during naming tasks than perceptual tasks.
Consistent with the importance of task effects in the comparison of words and pictures, a recent study by Starrfeldt and Gerlach [ 2007] observed increased activation for words relative to pictures during a colour decision task (deciding if stimuli were coloured white or yellow) but not during a categorisation task (deciding if stimuli represented natural objects or artefacts). We compared word and picture responses during perceptual, semantic and naming tasks but did not find significant evidence for increased activation for words relative to objects in any of the tasks we tested. Nor did we find evidence for an interaction of stimulus modality with either task or object category in Experiment 1, even though we predicted that we might see word selectivity for the one‐back identity task but not the semantic tasks. One possibility is that by intermixing different tasks within the same experimental session (e.g. blocks of naming or one‐back tasks in Experiment 3), subjects engaged a naming strategy irrespective of task, thereby reducing differences between stimuli. Additional studies are therefore required to investigate task by stimulus interactions further, particularly how they interact with the experimental protocol. Nevertheless at this stage we can draw the important conclusion that increased left OT activation for words relative to pictures is very difficult to demonstrate with conventional fMRI techniques and reading tasks. Therefore, at present, there is no convincing evidence to suggest that there are neuronal populations around the left OT sulcus that respond to reading more than picture processing when the processing demands of the task are equated across stimuli.
Recent studies have made similar arguments concerning letter selectivity [Joseph et al., 2006; Pernet et al., 2005] and face selectivity [e.g. Gauthier et al., 2000]. In Pernet et al. [ 2005], for example, letter selectivity in the left OT cortex was found to be task‐dependent (observed during a categorisation task but not during a discrimination task). The authors argue that if there was a cognitive ‘module’ dedicated to Latin letters, it was only engaged when access to visual memories of letters was required. Task dependency for letter selectivity was also reported by Joseph et al. [ 2006], who compared letters, objects, visual noise and fixation during a matching task and a naming task. The left mid‐fusiform gyrus showed a conjoined response for the non‐fixation stimuli during the matching task and a letter preferential response during naming, although naming letters did not activate this region more than pictures of objects—so the authors argue that the region cannot be classified as dedicated for letter processing.
Our study was not designed to identify functional labels for left OT regions. However, our findings do have implications for the interpretation of other studies. For example, activation of the same left OT voxels for word and object processing (Experiment 3) suggests that words and pictures are activating shared computations. Given the number of left OT voxels activated during reading (Figs. 1, 2, 3), it is also likely that left OT is involved in several different computational stages, as visual information is relayed to higher cognitive levels [see Price and Devlin, 2003, 2004; Devlin et al., 2006]. Anterior fusiform activation, for example, is more involved in semantic processing [see Price and Mechelli, 2005, for a review]. Functional connectivity studies [e.g. Mechelli et al., 2005] have also shown that anterior fusiform activation correlates with ventral inferior frontal activation whereas posterior fusiform activation correlates with dorsal premotor activation. The critical point of the current paper is to demonstrate that these semantic vs. non‐semantic networks are not specific to word and non‐word processing. They are also engaged by object processing. Thus, while it is tempting to assign regions with reading specific functional labels (e.g. the visual word form area and bigram letter processing), these labels do not encompass the full range of processes that the brain structures are contributing to. Consequently, studies of non‐reading tasks would need to assign different functional labels to the same region (see Price and Friston [ 2005] for a discussion of the issues related to assigning functional labels to structural brain regions).
In conclusion, the experimental data that are currently available do not support the hypothesis that learning to read changes the function of the left OT cortex. Instead, we suggest that learning to read involves the recruitment of left OT functions that are already engaged in object processing. More generally, our results highlight the need for single subject effects to correct the statistical threshold for the number of comparisons made or replicate effects within subject.
Acknowledgements
We thank the volunteers who underwent the scans and the radiographers for their help with the scanning. We also thank Dr Ralf Deichmann for design of the fMRI sequence used in Experiment 3 and Dr Tsila Ratner for translation of the words from English to Hebrew.
Re‐use of this article is permitted in accordance with the Terms and Conditions set out at http://wileyonlinelibrary.com/onlineopen#OnlineOpen_Terms
Footnotes
Six more subjects (total 22) were reported in Noppeney et al. (2006) but were not included in the present experiment because of technical delays recovering the data from tape.
REFERENCES
- Behrmann M,Nelson J,Sekuler EB ( 1998): Visual complexity in letter‐by‐letter reading: “pure” alexia is not pure. Neuropsychologia 36: 1115–1132. [DOI] [PubMed] [Google Scholar]
- Bookheimer SY,Zeffiro TA,Blaxton T,Gaillard WD,Theodore WH ( 1995): Regional cerebral blood flow during object naming and word reading. Human Brain Mapp 3: 93–106. [Google Scholar]
- Chee MW,Weekes B,Lee KM,Soon CS,Schreiber A,Hoon JJ,Chee M ( 2000): Overlap and dissociation of semantic processing of Chinese characters, English words, and pictures: evidence from fMRI. Neuroimage 12: 392–403. [DOI] [PubMed] [Google Scholar]
- Cohen L,Dehaene S ( 2004): Specialization within the ventral stream: the case for the visual word form area. Neuroimage 22: 466–476. [DOI] [PubMed] [Google Scholar]
- Cohen L,Dehaene S,Naccache L,Lehericy S,Dehaene‐Lambertz G,Henaff MA,Michel F ( 2000): The visual word form area: spatial and temporal characterization of an initial stage of reading in normal subjects and posterior split‐brain patients. Brain 123 (Part 2): 291–307. [DOI] [PubMed] [Google Scholar]
- Cohen L,Lehericy S,Chochon F,Lemer C,Rivaud S,Dehaene S ( 2002): Language‐specific tuning of visual cortex? Functional properties of the visual word form area. Brain 125: 1054–1069. [DOI] [PubMed] [Google Scholar]
- Damasio AR,Damasio H ( 1983): The anatomic basis of pure alexia. Neurology 33: 1573–1583. [DOI] [PubMed] [Google Scholar]
- De Renzi RE,Zambolin A,Crisi G ( 1987): The pattern of neuropsychological impairment associated with left posterior cerebral artery infarcts. Brain 110 (Part 5): 1099–1116. [DOI] [PubMed] [Google Scholar]
- Dehaene S ( 2005): Evolution of human cortical circuits for reading and arithmetic: The “neuronal recycling” hypothesis In: Dehaene S,Duhamel JR,Hauser M,Rizzolatti G, editors. From Monkey Brain to Human Brain. Cambridge MA: MIT Press; 133–157 pp. [Google Scholar]
- Devlin JT,Jamison HL,Gonnerman LM,Matthews PM ( 2006): The role of the posterior fusiform gyrus in reading. J Cogn Neurosci 18: 911–922. [DOI] [PMC free article] [PubMed] [Google Scholar]
- Friston KJ ( 2004): Experimental design and statistical parametric mapping In: Frackowiak RSJ,Friston KJ,Frith CD,Dolan RJ,Price CJ,Zeki S,Ashburner J,Penny WD, editors. Human Brain Function. San Diego, CA: Academic Press; pp 604–605. [Google Scholar]
- Gaillard R,Naccache L,Pinel P,Clemenceau S,Volle E,Hasboun D,Dupont S,Baulac M,Dehaene S,Adam C,Cohen L ( 2006): Direct intracranial, FMRI, and lesion evidence for the causal role of left inferotemporal cortex in reading. Neuron 50: 191–204. [DOI] [PubMed] [Google Scholar]
- Gauthier I,Tarr MJ,Moylan J,Skudlarski P,Gore JC,Anderson AW ( 2000): The fusiform “face area” is part of a network that processes faces at the individual level. J Cogn Neurosci 12: 495–504. [DOI] [PubMed] [Google Scholar]
- Glaser WR,Glaser MO ( 1989): Context effects in Stroop‐like word and picture processing. J Exp Psychol: General 118: 13–42. [DOI] [PubMed] [Google Scholar]
- Hasson U,Levy I,Behrmann M,Hendler T,Malach R ( 2002): Eccentricity bias as an organizing principle for human high‐order object areas. Neuron 34: 479–490. [DOI] [PubMed] [Google Scholar]
- Haynes JD,Deichmann R,Rees G ( 2005): Eye‐specific effects of binocular rivalry in the human lateral geniculate nucleus. Nature 438: 496–499. [DOI] [PMC free article] [PubMed] [Google Scholar]
- Hillis AE,Newhart M,Heidler J,Barker P,Herskovits E,Degaonkar M ( 2005): The roles of the “visual word form area” in reading. Neuroimage 24: 548–559. [DOI] [PubMed] [Google Scholar]
- Joseph JE,Cerullo MA,Farley AB,Steinmetz NA,Meir CR ( 2006): fMRI correlates of cortical specialization and generalization for letter processing. Neuroimage 32: 806–820. [DOI] [PubMed] [Google Scholar]
- Josephs O,Deichmann R,Turner R ( 2000): Trajectory measurement and generalized reconstruction in rectilinear EPI. In: ISMRM Meeting,Denver, CO. p 1517.
- Mechelli A,Crinion JT,Long S,Friston KJ,Lambon Ralph MA,Patterson K,McClelland JL,Price CJ ( 2005): Dissociating reading processes on the basis of neuronal interactions. J Cogn Neurosci 17: 1753–1765. [DOI] [PubMed] [Google Scholar]
- Menard MT,Kosslyn SM,Thompson WL,Alpert NM,Rauch SL ( 1996): Encoding words and pictures: a positron emission tomography study. Neuropsychologia 34: 185–194. [DOI] [PubMed] [Google Scholar]
- Moore CJ,Price CJ ( 1999): Three distinct ventral occipitotemporal regions for reading and object naming. Neuroimage 10: 181–192. [DOI] [PubMed] [Google Scholar]
- Mummery CJ,Patterson K,Wise RJ,Vandenbergh R,Price CJ,Hodges JR ( 1999): Disrupted temporal lobe connections in semantic dementia. Brain 122 (Part 1): 61–73. [DOI] [PubMed] [Google Scholar]
- Noppeney U,Price CJ,Penny WD,Friston KJ ( 2006): Two distinct neural mechanisms for category‐selective responses. Cereb Cortex 16: 437–445. [DOI] [PubMed] [Google Scholar]
- Pernet C,Celsis P,Demonet JF ( 2005): Selective response to letter categorization within the left fusiform gyrus. Neuroimage 28: 738–744. [DOI] [PubMed] [Google Scholar]
- Price CJ,Devlin JT ( 2003): The myth of the visual word form area. Neuroimage 19: 473–481. [DOI] [PubMed] [Google Scholar]
- Price CJ,Devlin JT ( 2004): The pro and cons of labelling a left occipitotemporal region: “the visual word form area”. Neuroimage 22: 477–479. [DOI] [PubMed] [Google Scholar]
- Price CJ,Friston KJ ( 2005): Functional ontologies for cognition: The systematic definition of structure and function. Cogn Neuropsychol 22: 262–275. [DOI] [PubMed] [Google Scholar]
- Price CJ,Mechelli A ( 2005): Reading and reading disturbance. Curr Opin Neurobiol 15: 231–238. [DOI] [PubMed] [Google Scholar]
- Price CJ,McCrory E,Noppeney U,Mechelli A,Moore CJ,Biggio N,Devlin JT ( 2006): How reading differs from object naming at the neuronal level. Neuroimage 29: 643–648. [DOI] [PubMed] [Google Scholar]
- Reinholz J,Pollmann S ( 2005): Differential activation of object‐selective visual areas by passive viewing of pictures and words. Brain Res Cogn Brain Res 24(3): 702–714. [DOI] [PubMed] [Google Scholar]
- Sevostianov A,Horwitz B,Nechaev V,Williams R,Fromm S,Braun AR ( 2002): fMRI study comparing names versus pictures of objects. Human Brain Mapp 16: 168–175. [DOI] [PMC free article] [PubMed] [Google Scholar]
- Starrfelt R,Gerlach C ( 2007): The visual what for area: Words and pictures in the left fusiform gyrus. Neuroimage 35: 334–342. [DOI] [PubMed] [Google Scholar]
- Vandenberghe R,Price C,Wise R,Josephs O,Frackowiak RS ( 1996): Functional anatomy of a common semantic system for words and pictures. Nature 383: 254–256. [DOI] [PubMed] [Google Scholar]
- Waters D,Campbell R,Capek CM,Woll B,David AS,McGuire PK,Brammer MJ,Macsweeney M ( 2007): Fingerspelling, signed language, text and picture processing in deaf native signers: The role of the mid‐fusiform gyrus. Neuroimage 35: 1287–1302. [DOI] [PMC free article] [PubMed] [Google Scholar]