

Abstract
It is shown in the present work that the CEST method for hydroxyl protons can be used to detect changes in glycosaminoglycan (GAG) concentrations in the intervertebral disc. The method, termed gagCEST, was demonstrated ex vivo by correlating the CEST effect with the fixed charge density (FCD) of the nucleus pulposus (NP), as well as, correlating tissue CEST images with their corresponding 23Na images. Incubation of the five NP samples with trypsin produced samples with varying GAG content (N=19), and a good correlation was found between the −OH CEST effect and FCD as well as with the N-acetyl signal amplitude. GagCEST images in vitro further illustrate the amount of detail obtainable from this contrast mechanism when compared to conventional imaging. The large concentration of GAG and the relatively long T1 of water in the NP, make the method sensitive, in particular, for assessing the GAG depletion in this tissue. It is the loss of GAG in the NP that indicates the early stage of disc degeneration.
Keywords: MRI, CEST, Intervertebral disc, Glycosaminoglycan, Proteoglycans, Nucleus pulposus
Introduction
The intervertebral disc (IVD) is the largest avascular, aneural structure in the body, playing a vital role in spinal function. It consists of two anatomical regions: the nucleus pulposus (NP) – a gelatinous core in the center of the disc, and the annulus fibrosus (AF) – the outer ring, and is separated from the vertebral bodies by the cartilaginous end plates. In human IVD, collagen accounts for about 15-20% of the nucleus and 65-70% of the annulus dry weight whereas proteoglycan (PG) represents approximately 50% of the nucleus and 10-20% of the annulus dry weight (1). Glycosaminoglycan (GAG), one of the major components in discs, is of critical importance in spinal physiology. In the pathological state, e.g., disc degeneration or aging, changes in GAG have been considered to occur at the initial stages of degeneration, as the disc macromolecules degrade and are no longer trapped in the tissue matrix but slowly diffuse out of the disc (2). The prevalence of lower back pain associated with disc degeneration, gives motivation to the detection of early events in degeneration for the purposes of clinical intervention and the research of spinal pathophysiology. Moreover, the biological repair strategies for disc are also aimed at increasing GAG content in order to restore its swelling pressure. Currently, direct MRI detection of GAG content and properties is limited either by hardware considerations, or by the non-specificity of the contrast that they provide.
The course of disc degeneration is rather long, typically over decades (2,3). Therefore, it is vital to diagnose early degenerative changes at the stage of molecular alteration in the disc in order to prevent the disease from compromising life quality. Moreover, the availability of such non-invasive diagnostic technique would be a powerful tool in clinical intervention.
Although MRI is widely used in clinical diagnosis of disc disorders, current protocols assess the degeneration primarily based on morphological changes. Different methods were developed in order to characterize changes of PG composition in the extracellular matrix, including T1ρ mapping and sodium MRI. The T1ρ method was used to map PG concentration in both articular cartilage and IVD (4-7). However, this method is not strictly specific for measuring PG. Another way to map changes in PG concentrations is 23Na MRI, since the concentrations of the positively charged sodium ions are related to the concentrations of the negatively charged PGs (8,9). The low signal-to-noise ratio, long scan times and the requirement of special radio-frequency hardware modifications, however, currently limit its clinical application. Recent work on quadrupolar contrast or inversion-recovery techniques could reduce partial volume effects and make 23Na MRI more quantitative (10-16). Further advances in the MRI of disc are summarized in two recent review articles (17,18). Although delayed gadolinium enhanced MRI contrast (dGEMRIC) is a popular method for GAG mapping in cartilage, its application is hard to extend to discs because equilibration times of Gd(DTPA)2- in thick (~10 mm) lumbar discs are much longer than the half-life of Gd(DTPA)2- in the circulation (2). Furthermore, recently complications due to Nephrogenic Systemic Fibrosis have led to a limitation of the administration of these agents, especially to patients with kidney dysfunctions (19,20).
We have recently proposed a novel MR method to assess GAG concentration via the Chemical Exchange Saturation Transfer (gagCEST) approach in cartilage (21,22). In the CEST method, exchangeable protons are saturated, and the saturation is transferred by chemical exchange to the bulk water (23). As a result, a large contrast enhancement in bulk water can be achieved. In this paper we demonstrate that the gagCEST method is also an alternative strategy to map GAG concentration in disc.
In addition, biological repair strategies for disc, such as gene therapy, growth factor injection or cell therapy, are other areas in which the GAG content and distribution measurements are critical markers in the therapeutic process, and where the CEST approach may become useful (24).
Experimental
Sample preparation
Bovine IVD samples
Bovine disc samples were obtained from a USDA approved slaughter house (Bierig Bros, Vineland, NJ) within five hours of animal sacrifice (4-6 months old cows) and frozen at -20°C until used. After deicing, the soft tissue was removed first. The samples were cut so as to include only the anatomical region of interest (annulus or nucleus, separately).
NP samples were cut off as large pieces from the central region of the discs, and equilibrated in a Phosphate buffer saline (PBS) solution for at least one day to reach the equilibrium state. The samples were then cut into smaller pieces to fit 5 mm NMR tube. NP samples were either undergone PG depletion process or used for water content measurements.
For PG depletion, each of five NP samples underwent a depletion series. The samples were first equilibrated in PBS, then blot dried, weighed and placed into the NMR tube for measuring. After that, the samples were incubated in 0.2 mg/ml trypsin (Sigma, St. Louis, MO, USA) in PBS solution for a depletion time ranging up to 7 minutes at 25°C, and then equilibrated in PBS solution for at least one hour. After equilibration, the samples were blot dried and weighted. The samples were then put inside a 5 mm NMR tube and measured. Fluorinated oil (Fluorinert, FC-77, 3M, St. Paul, MN, USA) was filled into the void spaces for protection and reduction of susceptibility artifacts. This process was repeated a few times. Different depletion steps were selected according to sample condition and GAG concentration of the sample. Two depletion series had depletion times of 0, 1 and 3 min, one had 0, 1, 3, 5 min, one had 0, 1, 5 and 7min, and one had 0, 1, 3, 5 and 7 min, to give a total of N=19 data points.
Water content of different NP samples was determined by the difference in weight before and after each depletion step. The water percentages calculated were used to obtain the water content in the samples during different depletion stages. The water percentage range was 90-96% with this method.
Porcine samples
Porcine IVD samples were obtained from the Institute of Animal Research, Kibbutz Lahav, Israel (with the approval of the Council of Animal research, Israel) within five hours of animal sacrifice.
Whole IVD samples were cut so as to include every anatomical region of disc, and placed into a plastic jar, and filled with fluorinated oil (Fluorinert, FC-77, 3M, St. Paul, MN, USA).
For NP samples, the porcine discs were cut and the NP was removed. For PG depletion the NP samples were incubated in 1 mg/ml trypsin (Sigma, St. Louis, MO, USA) in PBS for 1 hour, at 25°C, and then equilibrated in saline. Due to the swelling behavior of the NP (25), the PG depleted NP samples were put inside a dialysis bag (1000-Mw cutoff) and incubated for 12h against a 6% solution of polyethyleneglycol (PEG) 20,000. Another 4 hours of incubation against 8% PEG solution were needed for the samples to return to their initial size. The samples were then removed from the dialysis bag, immersed in fluorinated oil, and placed in the NMR tube. Untreated intact NP sample was placed in an NMR tube directly after it was cut from the IVD. The two NP samples in the NMR tube were separated by a Teflon spacer.
A higher trypsin concentration and longer depletion time were used for imaging of porcine NP samples, due to their much larger size compared with the bovine NP samples and since a full depletion of the PG was intended for these samples. Also, no significant swelling behavior was seen for the bovine NP sample beyond the first PBS equilibration, which was probably also due to the much smaller size of the bovine samples.
NMR measurements
1H and sodium NMR data for the bovine NP and AF samples were acquired at 11.7 T (500 MHz 1H frequency) using a Bruker Avance spectrometer equipped with a BBO probe. The temperature of the sample was stabilized at 37°C with a variation of ±0.2°C.
1D 1H spectra were acquired with a spectral width of 10 kHz and 8 k data points. A 5° pulse flip angle with ω1/2π = 23kHz was used, and 8 transients were acquired for each spectrum using a repetition delay of 1 s.
For the CEST experiment, the continuous-wave (CW) power for saturation was 35 Hz and the duration 10 s, followed by a 5° flip angle pulse. Two accumulations were used for each experiment, a window width of 20 kHz was used, 20k data points were collected, and the recycle delay was set to 3 s. For the z spectra a total of 141 spectra were collected with 0.1 ppm shift in offset frequency per step. The water intensity was then plotted as a function of the irradiation frequency with respect to the center of the main water resonance.
In addition to the CEST z-spectra, direct water saturation spectra (with 4 Hz saturation power and 0.2 ms duration) were also acquired. These spectra reflect the absolute water frequency at a specific B0 field and were used as the reference to center the CEST spectra (26). For the z spectra a total of 61 spectra were collected with 0.02 ppm shift in offset frequency per step.
Sodium NMR experiments on NaCl standard solution and the samples were performed back-to-back in order to calculate the FCD of the samples. The spectra were recorded with a spectral width of 10 kHz and 9996 data points. 128 transients were acquired for each spectrum with a repetition delay of 1 s. The sodium content was determined from the Na+ NMR signals after integration and calibration with a 25 mM NaCl standard solution in water.
MRI measurements
For porcine NP samples, data were recorded on a Bruker DMX-360WB NMR spectrometer using a 10 mm imaging probe (200 G/cm), tuned for protons (360 MHz) and sodium (95.3 MHz).
Point resolution spectroscopy (PRESS) was used for the 1H spectra with the following parameters: TR/TE = 4000/12 ms, with VAPOR water suppression (27), 128 averages. Post processing: SI = 8k, LB = 10.
1H CEST images were acquired using rapid acquisition with relaxation enhancement (RARE) pulse sequence (TR/TE = 3023/11 ms, 256×128 matrix zero filled to 256×256, FOV: 1.8cm × 1.8cm or 2cm × 2cm, 1 mm slice thickness, RARE factor = 4) with an off resonance saturation pulse with 3 s duration and a strength of 1.8 μT over a range of frequencies ± 7.8 ppm from the water signal, with 0.05-0.2 ppm shift in offset frequency per step.
The 23Na images were acquired by using a gradient echo (GE) pulse sequence with the following parameters: TR/TE = 100/3.5 ms, FOV: 1.8cm × 1.8cm or 2cm × 2cm, 1 mm slice, 64×32 matrix zero filled to 64×64.
T2 maps were obtained using the multi-slice multi-echo (MSME) method with the following parameters: TR/TE = 3000/9 ms with 128 echo, 128×128 matrix, FOV: 1.8cm × 1.8cm or 2cm × 2cm of 1 mm slice thickness.
The data for the porcine IVD sample was acquired on a 7T/30 cm (300 MHz 1H frequency) BioSpec (Bruker, Germany), capable of producing pulse gradients of 40 G/cm in each of the three dimensions, using a body coil (ID=15cm). The temperature of the sample was stabilized at 25°C.
The anatomical imaging sequence was acquired with a spoiled gradient echo (GRE) sequence with 30° flip angles. The acquisition parameters of the image on the disc were: TR/TE = 3050/3.5 ms, 1.8 mm slice thickness, 256×256 matrix, FOV: 4.5cm × 4.5cm.
The CEST imaging sequence was acquired with the spoiled gradient GRE sequence with a train of thirty square pulses of 100 ms duration each and an interval of 1 ms at the offsets of interest. The average saturation power was 1.8 μT. The acquisition parameters of the CEST image on the IVD were: TR/TE = 3500/3.5 ms, 1.8 mm thickness, 256 × 256 matrix; FOV: 4.5cm × 4.5cm.
The T2 map was generated by a MSME pulse sequence: TR = 4000 ms, TE = 11 ms with 32 echoes on 1 physical slice. No dummy scans were used.
Data analysis
Bovine NP samples
The FCD was calculated according to (8):
| (1) |
Where [Na+]t is the concentration of sodium in the sample at a certain time and [Na+]b is the concentration of sodium in the PBS solution (154mM).
The concentration of N-acetyl is calculated based on 1H NMR spectra measured after each depletion step. The peak of N-acetyl (2.8 ppm upfield from water) was integrated and compared with a standard 25 mM Chondroitin Sulfate reference solution to calculate absolute concentration.
Z-spectra were obtained from the CEST experiments. The intensity of water of each NP sample was measured for the range of frequencies up to ±7 ppm from the water signal, and plotted as a function of the irradiation offset frequency. The center of z-spectra was corrected using direct water saturation spectra (26), which covered the range of frequencies from -0.6 to 0.6 ppm with respect to the water center.
The CEST ratio was calculated using:
| (2) |
where Msat(δ) is the signal acquired after the saturation pulse at offset δ with respect to the water resonance.
Porcine NP and IVD samples
All maps were generated by using MATLAB software (Mathworks, Natick, MA, USA).
Z-spectra were obtained from the CEST images. The intensity of each NP sample was measured for the range of frequencies up to ± 7.8 ppm from the water signal, and plotted as a function of the irradiation offset frequency.
The CEST images were calculated using eqn. (2).
T2 maps were calculated on a pixel-by-pixel basis using the mono exponential decay function:
| (3) |
Results
In order to test the possibility of the application of gagCEST for the study of IVD, high resolution NMR spectra were recorded on the annulus and nucleus samples obtained from a bovine disc (Figs. 1a and b). The most prominent peaks come from the lipids (between -3.2 ppm and -4.0 ppm relative to the water peak), the N-acetyl group from GAG (-2.7 ppm), the aliphatic proton from the GAG ring (between -0.6 ppm to -1.4 ppm), the amide proton from GAG (+3.2 ppm), and the amine groups from the side chains of the PG core protein (+2.7 ppm). These resonance assignments are similar to those of bovine cartilage, as reported previously (22,28). Z-spectra (29) for the same samples are shown in Figs. 1c and d. In these spectra, the exchangeable groups (hydroxyl, amide protons, and amine protons), as well as non-exchangeable groups which show a magnetization transfer through the Nuclear Overhauser Effect (NOE) (21, 30), are visible as dips or bends in the curve.
Fig. 1.
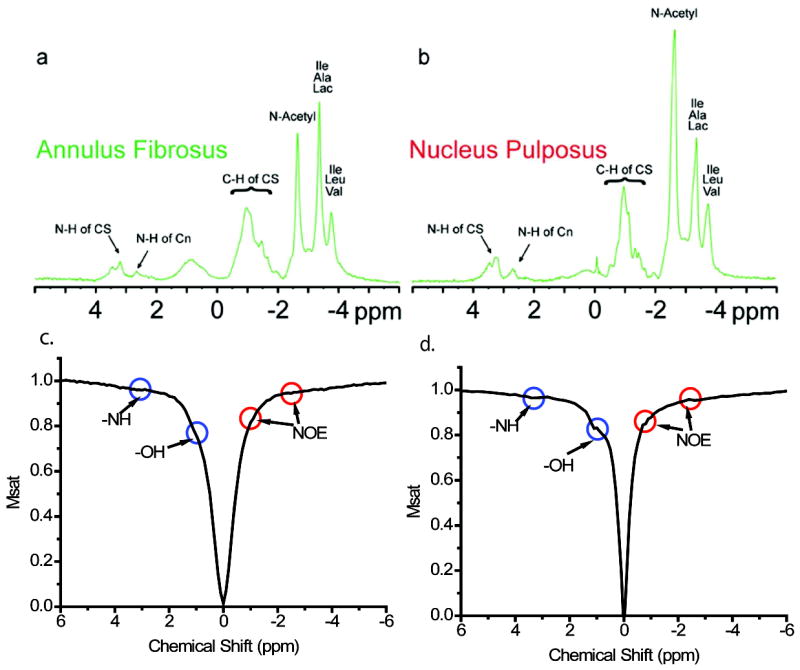
(a) 1D 1H spectrum of annulus; (b) 1D 1H spectrum of nucleus; (c) z-spectra of annulus; (d) z-spectra of nucleus. The power for pre-saturation was 35 Hz and the duration 10 s.
In order to determine whether the CEST approach can be used to measure changes in GAG concentration in the NP, tissues with different GAG concentrations were studied. The GAG concentration was altered by subjecting the samples to consecutive trypsin treatments. Fig. 2a shows that a good correlation between the CEST effect at 1.1 ppm (corresponding to -OH of the GAG) and the FCD was found for the set of 19 sample points (obtained from 5 independent depletion series). The asymmetry plot of one of the NP samples that was calculated by quantifying the CEST effect according to eqn (2) is shown in Fig. 2b. The maximum effect was found at ~1.1 ppm with respect to the water center, and was reduced with increased depletion time. The effect of the −OH CEST was also plotted as a function of the N-acetyl concentration of the depletion series of all NP samples in Fig. 3a. A good correlation between the −OH CEST and the −NH concentration is also observed. These results indicate that the N-acetyl concentration correlates well with the CEST effect, which is the desired result. However, in a practical setting, in-vivo direct spectroscopic measurements of the N-acetyl signals would be too weak.
Fig. 2.
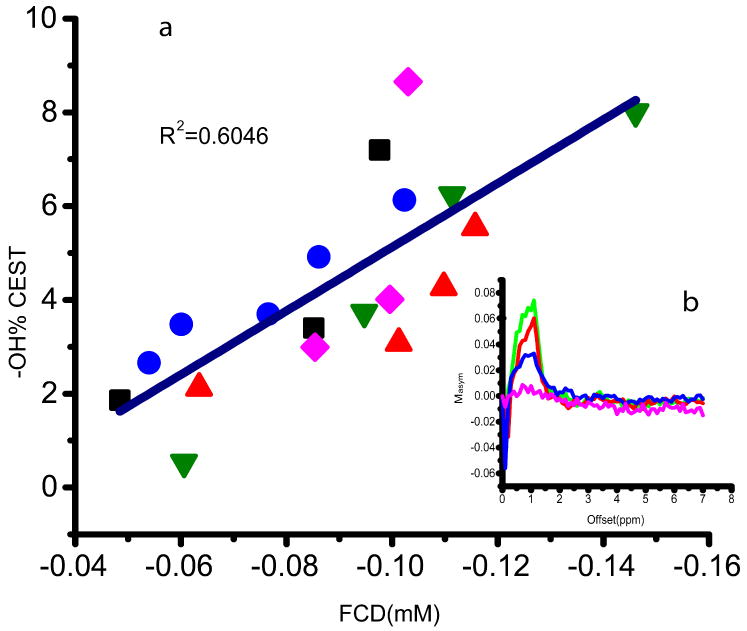
(a) OH CEST effect as a function of FCD for five NP sample depletion series. For each NP sample the depletion series is represented by a different symbol. Depletion times range from 0 to 7 min. (b) asymmetry plot of one NP sample with depletion time of 0, 1, 3 and 7 min, at 1.1 ppm.
Fig. 3.
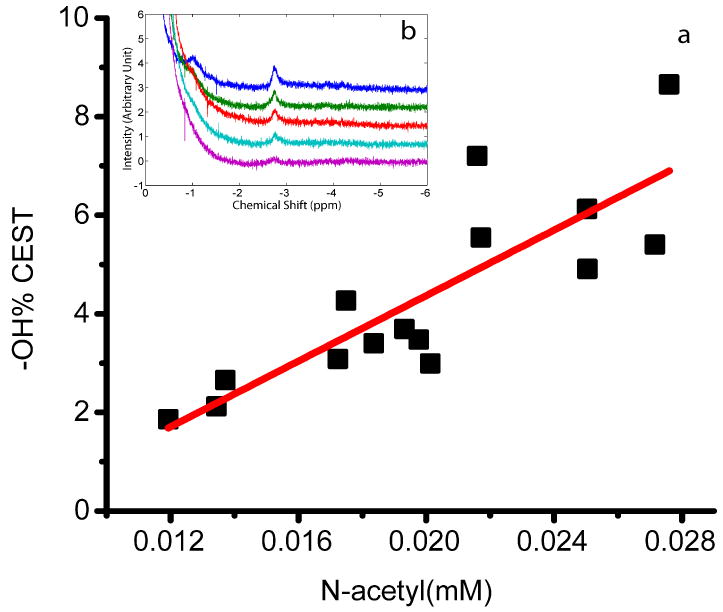
(a) OH CEST effect vs. N-acetyl concentration, for four NP sample depletion series. (b) 1H spectra of one NP sample with depletion time of 0, 1, 3, 5 and 7 min at the N-acetyl offset region (-2.8 ppm).
Figure 4 shows 1H PRESS and z-spectra for intact and PG depleted NP obtained from porcine IVD. All resonance peaks in both the PRESS and the z-spectra were lower after the 1 hour depletion. In the asymmetry plot, the maximum effects were found at ~1 ppm and ~2.7 ppm from the water, which correspond, to the -OH of the GAG and -NH of PG core protein, respectively. After 1h depletion, both peaks in the asymmetry plot were reduced compared to the intact NP (Fig. 4b).
Fig. 4.
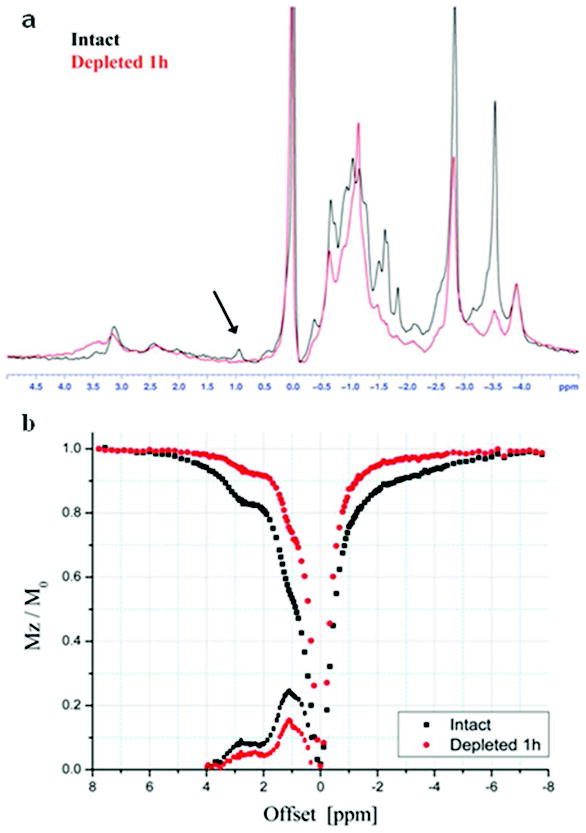
1H PRESS (a) and the corresponding z-spectrum and asymmetry plot (b) of intact NP and NP after 1 hour depletion.
Fig. 5 shows a comparison between the CEST image (at δ = 1 ppm) and the 23Na image. In the sample, the intact NP is at the lower part of the image and the depleted NP in the upper part. A higher concentration of trypsin solution and longer depletion time was used to ensure that most of PGs in the sample have been removed. In Fig. 5a, the CEST image shows that the NP with 1 hour depletion has 47% of signal intensity reduction compared to the intact NP while the corresponding 23Na image reveals only 13% reduction. This is a consequence of the fact that at zero FCD, the sodium concentration would still be equal to its concentration in the bath.
Fig. 5.
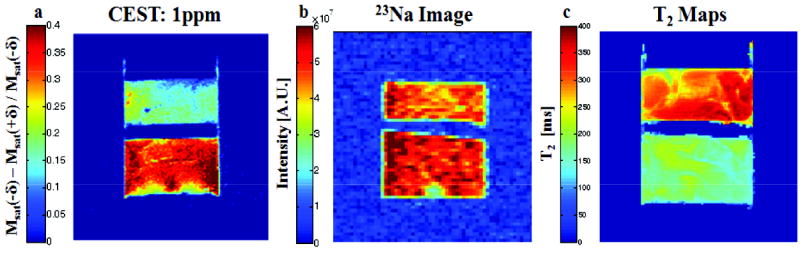
CEST image (a) 23Na image (b) and T2 map (c) of the sample containing both intact NP and the 1-hour depleted NP.
The T2 maps of the samples are given in Fig. 5c, the averaged T2 values are 182.3 ± 19.2 ms and 315.5 ± 38.5 ms for the intact NP and 1 hour depleted NP respectively.
Fig. 6 demonstrates the use of gagCEST imaging on one piece of porcine disc in vitro. Although the anatomical image in Fig. 6a shows clear structural differences in both the annulus and the nucleus, little information is provided about GAG distribution. Fig. 6b, gave not only robust contrast in both the annulus and the nucleus regions, but also provided details about GAG distribution along the laminar rings. The CEST difference images were extracted according to eqn (2). The averaged T2 was ~120 ms in the nucleus and ~35 ms in the annulus. No obvious transitional zone was seen for T2, which highlights the additional insights that one may gain from CEST.
Fig. 6.
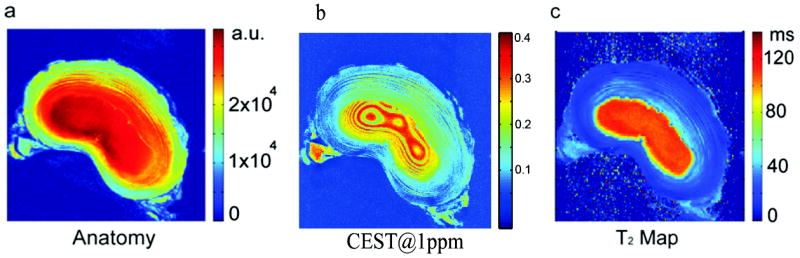
(a) Anatomical axial images of a porcine disc; (b) axial CEST images @1.0 ppm; (c) axial T2 map. All the images are from the same piece of porcine disc. The pre-saturation was accomplished by a train of thirty square pulses of 100 ms duration each and an interval of 1 ms at the offsets of interest, and the power was 1.8 μT.
Discussion
1D 1H spectra of both annulus and nucleus demonstrate features similar to the ones of cartilage (22,28), which indicates that the CEST approach may be likewise a feasible method for assessing IVD. The z-spectra shown in Fig. 1 were constructed with an irradiation power and duration of the pre-saturation pulses optimized for sites with a low magnetic transfer rate. The amide proton @ +3.2 ppm and NOE site @ -1.0 ppm & @ -2.7 ppm, both have magnetic transfer rates on the order of ~10 s-1 (14,23). The z-spectrum of the nucleus, however, demonstrates stronger NOE effects than that of the annulus at -2.7 ppm, resulting from the higher concentration of GAG in nucleus.
For the NP the −OH group showed a clear CEST effect which further correlated well with the FCD and N-acetyl data in Figs. 2 and 3, from which it can be concluded that the CEST method is sensitive to the GAG concentration variation in the nucleus. Therefore, as in cartilage (21,22), the gagCEST method can be used to map the changes in GAG concentration in the disc. It should be noted that the correlation of ex vivo data with FCD is complicated by the elaborate sample handling procedures and the inaccuracies of the determination of the water content. In vivo measurements would not suffer from these problems.
However, in-vivo human studies have limited scan time and due to SAR limitations only low RF pulses of short duration can be applied, which can result in insufficient saturation of the group of interest (in our case the −OH group at ~1 ppm). Moreover, except from chemical exchange, other exchange mechanisms are present during the CEST experiment, such as magnetization transfer through the NOE effect, as seen in Fig. 1. The presence of NOE sites can result in a reduction of the CEST effect, as seen for the −NH CEST in cartilage, in particular for the amide CEST at ~3.2 ppm (21).
For the experiment shown in Fig. 4, the parameters were optimized such that sites with high magnetic transfer rates show dents in z-spectrum. The hydroxyl protons have magnetic transfer rate on the order of ~103 s-1 (31). Similar to the earlier results (Figs. 1 and 2), while the −OH group at ~1 ppm shows a clear CEST effect which decreased with the GAG depletion, the amide/amine CEST effect in the region of ~2.7 to 3.2 ppm is small and inconsistent, most likely due to slow proton exchange and to NOE effects at the opposite side of the water signal.
The CEST method in Fig. 5 demonstrates higher contrast between intact and depleted NP, than that of the corresponding 23Na images. The CEST contrast is sensitive to absolute GAG concentration and chemical exchange rate. The contrast produced by 23Na, however, is based on the difference between the sodium concentration in the intact tissue governed by the Donnan equilibrium and the residual Na+ concentration after full depletion that may not be reduced below the base line of 154 mM.
Although T2 maps gave good contrast between the intact and depleted NP (Fig. 5c), this method is not specific to GAG concentration. The T2 relaxation depends on the general viscosity of the sample but also on the chemical exchange between water and the chemically shifted exchangeable protons of the PGs. Therefore, these two factors contribute to the elongation of T2 as a result of depletion. The other factor that contributes to T2 in connective tissues is the residual dipolar interaction caused by the interaction of water molecules with collagen fibers. This effect, however, should not have a significant role in the present system because there are only small amounts of collagen in the NP and its concentration is not expected to change by the PG depletion process. Therefore, the results from Fig. 5 further consolidate that CEST can be used to demonstrate GAG concentration with strong contrast and high sensitivity.
The in vitro CEST images of the intact porcine disc (Fig. 6b) not only show the high concentration of GAG in nucleus, but also provide details about GAG distribution in the form of laminar rings in the NP (invisible using T2 in Fig. 6c). The stronger CEST effect from the NP compared to the AF arises because: (i) the GAG concentration in the NP is up to 50% by dry weight and up to 20% by dry weight in the AF; (ii) the CEST effect itself increases with increasing T1 of the bulk water.
Loss of GAG in the NP is considered to occur in the initial stages of disc degeneration, and an early detection method for these changes would be beneficial in-vivo. Our results demonstrate that gagCEST can be correlated to the FCD in the NP and further correlates well with the N-acetyl signals of GAG. Recently Kim et al (32) demonstrated the application of gagCEST for in vivo imaging of human lumber IVDs on a 3T scanner, and its ability to measure GAG distribution in the IVD. Any in vivo applications, however, will have to rely on the implementation of efficient B0 compensation schemes to be successful, such as WASSR (26). Due to compounding factors (mostly T1 changes, but also changes in the exchange rates and interferences with changes in MT effects), the actual GAG concentration is not directly available from the gagCEST measurements, but the correlations between gagCEST and FCD and gagCEST and N-acetyl signal intensities (Figs. 2 and 3) indicate that relative trends can be easily assessed and can serve as a more quantitative basis for further in vivo applications.
Conclusions
The CEST method for hydroxyl protons of GAG is shown to be sensitive to changes in GAG concentrations in the nucleus pulposus of the intervertebral disc, both in spectroscopy and in ex vivo imaging. It could potentially be used for monitoring GAG depletion in the nucleus pulposus, which plays a central role in the study and diagnostics of disc degeneration. As a consequence, gagCEST may hold potential not only for the assessment of disc pathophysiology in vivo, but also for medical intervention and therapeutic monitoring.
Acknowledgments
We thank Dr. Ofer Pasternak (Dept. of Mathematics, Tel Aviv University) for his help with MATLAB programs. This work was supported by grants from: US-Israel Binational Science Foundation no. 2007157, the European PF7 program ENCITE and NIH grant 1 R21 AR055724-01A2 (NIAMS). It was conducted partly in a facility constructed with support from Research Facilities Improvement Grant Number C06 RR-16572-01 from the NCRR, NIH.
Abbreviations
- CEST
Chemical Exchange Saturation Transfer
- GAG
glycosaminoglycan
- FCD
fixed charge density
- NP
nucleus pulposus
- IVD
intervertebral disc
- AF
annulus fibrosus
- PG
proteoglycan
- PBS
phosphate buffer saline
- PRESS
point resolution spectroscopy
References
- 1.Kurtz SM, Edidin A. Spine Technology Handbook. London: Academic Press; 2006. [Google Scholar]
- 2.Urban JP, Winlove CP. Pathophysiology of the intervertebral disc and the challenges for MRI. J Magn Reson Imaging. 2007;25(2):419–432. doi: 10.1002/jmri.20874. [DOI] [PubMed] [Google Scholar]
- 3.Roberts S, Evans H, Trivedi J, Menage J. Histology and pathology of the human intervertebral disc. J Bone Joint Surg Am. 2006;88(Suppl 2):10–14. doi: 10.2106/JBJS.F.00019. [DOI] [PubMed] [Google Scholar]
- 4.Duvvuri U, Reddy R, Patel SD, Kaufman JH, Kneeland JB, Leigh JS. T-1 rho-relaxation in articular cartilage: Effects of enzymatic degradation. MagnResonMed. 1997;38(6):863–867. doi: 10.1002/mrm.1910380602. [DOI] [PubMed] [Google Scholar]
- 5.Blumenkrantz G, Li X, Han ET, Newitt DC, Crane JC, Link TM, Majumdar S. A feasibility study of in vivo T1r imaging of the intervertebral disc. Magn Reson Imaging. 2006;24(8):1001–1007. doi: 10.1016/j.mri.2006.04.013. [DOI] [PubMed] [Google Scholar]
- 6.Johannessen W, Auerbach JD, Wheaton AJ, Kurji A, Borthakur A, Reddy R, Elliott DM. Assessment of human disc degeneration and proteoglycan content using T1r-weighted magnetic resonance imaging. Spine. 2006;31(11):1253–1257. doi: 10.1097/01.brs.0000217708.54880.51. [DOI] [PMC free article] [PubMed] [Google Scholar]
- 7.Menezes NM, Gray ML, Hartke JR, Burstein D. T2 and T1r MRI in articular cartilage systems. Magn Reson Med. 2004;51(3):503–509. doi: 10.1002/mrm.10710. [DOI] [PubMed] [Google Scholar]
- 8.Lesperance LM, Gray ML, Burstein D. Determination of fixed charge density in cartilage using nuclear magnetic resonance. J Orthop Res. 1992;10(1):1–13. doi: 10.1002/jor.1100100102. [DOI] [PubMed] [Google Scholar]
- 9.Wang CY, McArdle E, Fenty M, Witschey W, Elliott M, Sochor M, Reddy R, Borthakur A. Validation of Sodium Magnetic Resonance Imaging of Intervertebral Disc. Spine. 2010;35(5):505–510. doi: 10.1097/BRS.0b013e3181b32d3b. [DOI] [PMC free article] [PubMed] [Google Scholar]
- 10.Choy J, Ling W, Jerschow A. Selective detection of ordered sodium signals via the central transition. J Magn Reson. 2006;180(1):105–109. doi: 10.1016/j.jmr.2006.01.011. [DOI] [PubMed] [Google Scholar]
- 11.Lee JS, Regatte RR, Jerschow A. Optimal nuclear magnetic resonance excitation schemes for the central transition of a spin 3/2 in the presence of residual quadrupolar coupling. J Chem Phys. 2008;129(22):224510. doi: 10.1063/1.3036005. [DOI] [PubMed] [Google Scholar]
- 12.Madelin G, Lee JS, Inati S, Jerschow A, Regatte RR. Sodium inversion recovery MRI of the knee joint in vivo at 7T. J Magn Reson. 2010;207(1):42–52. doi: 10.1016/j.jmr.2010.08.003. [DOI] [PMC free article] [PubMed] [Google Scholar]
- 13.Shinar H, Navon G. Multinuclear NMR and microscopic MRI studies of the articular cartilage nanostructure. NMR Biomed. 2006;19(7):877–893. doi: 10.1002/nbm.1068. [DOI] [PubMed] [Google Scholar]
- 14.Eliav U, Navon G. Multiple quantum filtered NMR studies of the interaction between collagen and water in the tendon. J Am Chem Soc. 2002;124(12):3125–3132. doi: 10.1021/ja011791n. [DOI] [PubMed] [Google Scholar]
- 15.Ling W, Jerschow A. Frequency-selective quadrupolar MRI contrast. Solid State Nucl Magn Reson. 2006;29(1-3):227–231. doi: 10.1016/j.ssnmr.2005.09.012. [DOI] [PubMed] [Google Scholar]
- 16.Ling W, Regatte RR, Schweitzer ME, Jerschow A. Behavior of ordered sodium in enzymatically depleted cartilage tissue. MagnResonMed. 2006;56(5):1151–1155. doi: 10.1002/mrm.21062. [DOI] [PubMed] [Google Scholar]
- 17.Haughton V. Imaging intervertebral disc degeneration. J Bone Joint Surg Am. 2006;88(Suppl 2):15–20. doi: 10.2106/JBJS.F.00010. [DOI] [PubMed] [Google Scholar]
- 18.Majumdar S. Magnetic resonance imaging and spectroscopy of the intervertebral disc. NMR Biomed. 2006;19(7):894–903. doi: 10.1002/nbm.1106. [DOI] [PubMed] [Google Scholar]
- 19.Kuo PH. Gadolinium-containing MRI contrast agents: important variations on a theme for NSF. J Am Coll Radiol. 2008;5(1):29–35. doi: 10.1016/j.jacr.2007.08.014. [DOI] [PubMed] [Google Scholar]
- 20.Lauenstein TC, Salman K, Morreira R, Tata S, Tudorascu D, Baramidze G, Singh-Parker S, Martin DR. Nephrogenic systemic fibrosis: center case review. J Magn Reson Imaging. 2007;26(5):1198–1203. doi: 10.1002/jmri.21136. [DOI] [PubMed] [Google Scholar]
- 21.Ling W, Regatte RR, Navon G, Jerschow A. Assessment of glycosaminoglycan concentration in vivo by chemical exchange-dependent saturation transfer (gagCEST) Proc Natl Acad Sci U S A. 2008;105(7):2266–2270. doi: 10.1073/pnas.0707666105. [DOI] [PMC free article] [PubMed] [Google Scholar]
- 22.Ling W, Regatte RR, Schweitzer ME, Jerschow A. Characterization of bovine patellar cartilage by NMR. NMR Biomed. 2008;21(3):289–295. doi: 10.1002/nbm.1193. [DOI] [PubMed] [Google Scholar]
- 23.Zhou J, Zijl PCMv. Chemical exchange saturation transfer imaging and spectroscopy. Progress in Nuclear Magnetic Resonance Spectroscopy. 2006;48(2-3):109–136. doi: 10.1016/j.pnmrs.2020.06.001. [DOI] [PubMed] [Google Scholar]
- 24.Evans C. Potential biologic therapies for the intervertebral disc. J Bone Joint Surg Am. 2006;88(Suppl 2):95–98. doi: 10.2106/JBJS.E.01328. [DOI] [PubMed] [Google Scholar]
- 25.Perea W, Cannella M, Yang J, Vega AJ, Polenova T, Marcolongo M. 2H double quantum filtered (DQF) NMR spectroscopy of the nucleus pulposus tissues of the intervertebral disc. Magn Reson Med. 2007;57(6):990–999. doi: 10.1002/mrm.21231. [DOI] [PubMed] [Google Scholar]
- 26.Kim M, Gillen J, Landman BA, Zhou JY, van Zijl PCM. Water Saturation Shift Referencing (WASSR) for Chemical Exchange Saturation Transfer (CEST) Experiments. MagnResonMed. 2009;61(6):1441–1450. doi: 10.1002/mrm.21873. [DOI] [PMC free article] [PubMed] [Google Scholar]
- 27.Tkac I, Starcuk Z, Choi IY, Gruetter R. In vivo 1H NMR spectroscopy of rat brain at 1 ms echo time. Magn Reson Med. 1999;41(4):649–656. doi: 10.1002/(sici)1522-2594(199904)41:4<649::aid-mrm2>3.0.co;2-g. [DOI] [PubMed] [Google Scholar]
- 28.Schiller J, Naji L, Huster D, Kaufmann J, Arnold K. 1H and 13C HR-MAS NMR investigations on native and enzymatically digested bovine nasal cartilage. Magma. 2001;13(1):19–27. doi: 10.1007/BF02668647. [DOI] [PubMed] [Google Scholar]
- 29.Hinton DP, Bryant RG. 1H magnetic cross-relaxation between multiple solvent components and rotationally immobilized protein. Magn Reson Med. 1996;35(4):497–505. doi: 10.1002/mrm.1910350408. [DOI] [PubMed] [Google Scholar]
- 30.Noggle JH, Schirmer RE. The nuclear Overhauser effect, chemical application. Academic Press; New York, NY: 1971. [Google Scholar]
- 31.Hills BP, Cano C, Belton PS. Proton NMR relaxation studies of aqueous polyaccharide systems. Macromolecules. 1991;24(10):2944–2950. [Google Scholar]
- 32.Kim M, Chan Q, Anthony M-P, Cheung KMC, Samartzis D, Khong P-L. Assessment of glycosaminoglycan distribution in human lumbar intervertebral discs using chemical exchange saturation transfer at 3 T: feasibility and initial experience. NMR Biomed. 2011 doi: 10.1002/nbm.1671. [DOI] [PubMed] [Google Scholar]