Abstract
Allelic DNA aberrations across our genome have been associated with normal human genetic heterogeneity as well as with a number of diseases and disorders. When copy-number variations (CNVs) occur in gene-coding regions, known relationships between genes may help us understand correlations between CNVs. However, a large number of these aberrations occur in non-coding, extragenic regions and their correlations may be characterized only quantitatively, e.g., probabilistically, but not functionally. Using a signal processing approach to CNV detection, we identified distributed CNVs in short, non-coding regions across chromosomes and investigated their potential correlations. We estimated predominantly local correlations between CNVs within the same chromosome, and a small number of apparently random long-distance correlations.
I. INTRODUCTION
Copy-number variations (CNV), including allelic duplications, deletions and rearrangements, represent a significant part of our normal genetic variability, and occur in both gene-coding and non-coding regions [4][23][11]. To date, more than 66,000 CNVs have been reported in the Database of Genomic Variants (DGV) [6][18][2]. In addition to normal DNA aberrations, pathological CNVs have been associated many diseases and disorders [13][22][9]. One of the challenges of genomic research is to identify and characterize correlations between CNVs, potentially driven by biologically-relevant mechanisms. In cases where CNVs occur in gene-coding regions, knowledge of individual genes in these regions and biological pathways may help explain correlated variants. However, a high number of identified CNVs are located in non-coding regions of healthy or pathological genomes. Thus, their role and correlations with distributed aberrations also in non-coding regions are often unclear [7][9][16]. There is, however, increasing evidence that non-protein coding DNA may play an important regulatory role, e.g. [10]. Extra-genic regions constitute ~98% of our genome and have been the focus of a large number of studies. There is also evidence that highly conserved non-coding regions may play a role in structural connections between chromosomes [17][5][8]. However, the function and correlations of genomic regions which are distant from known genes remain unclear [19]. In addition, it is unknown whether the occurrence of these CNVs is entirely random or guided by currently unknown mechanisms. We present preliminary results on the estimation of correlated CNVs in a small set of non-coding, evolutionarily ultra-conserved genomic regions, detected in Array Comparative Genomic Hybridization (array CGH) data from healthy individuals. To detect these CNVs we applied a novel signal processing-based method that treats genomic sequences as continuous signals and uses a matched-filtering approach to identify regions of pairwise similarity and dissimilarity [21]. We show that there are predominantly local correlations between CNVs within the same chromosome, but that there are only limited correlations between CNVs in different chromosomes.
II. METHODS
A. Array CGH data and genomic regions of interest
Array comparative genomic hybridization (aCGH) is a high-resolution technology that enables simultaneous detection of CNVs across the genome. It involves hybridization of differentially fluorescent dye-labeled reference and test sequences on a microarray, and subsequent estimation of relative allelic changes as the log2-ratio of the two fluorescence intensities. Here, 200 normal array CGH sequences (log2 intensity ratios) from the Cancer Genome Atlas [1] were analyzed (Agilent Human Genome CGH Microarray 244A, 60 bp resolution). A common reference sequence was used to normalize each sequence in a particular batch. Array CGH data is typically noisy and contains genomic artifacts which were suppressed using a denoising procedure involving sequence decomposition into individual signal components and elimination of low-amplitude, high-frequency components, a process that also increased the data signal-to-noise ratio (SNR) [21]. Matched-filtering, a quasi-optimum pattern matching filtering method, was then applied to detect regions of dissimilarity between sequences and thus CNVs.
Although CNVs have been identified across the entire non-coding part of the genome, this preliminary study focused on CNVs identified in ultra-conservative extragenic DNA segments. Thus, genomic regions of interest were selected as followed, based on the study by [5] who identified 481 ultra-conservative (UC) non-coding segments longer than 200 base pairs, of which 111 overlapped the mRNA of known protein-coding genes, and only 256 showed no evidence of transcription and did not overlap actively transcribed genomic regions[5]. From these, inter-genic segments in close proximity (≤~40 Kbp in either direction) to protein coding genes, were also eliminated. Ultimately, 24 clearly extra-genic DNA segments were chosen, which included UC elements. Table I lists analyzed segments in each chromosome, their length and corresponding cytoband. Segments were extracted from the database in [3] and compared to the DGV to ensure that all analyzed segments contained previously identified CNVs.
TABLE I.
Analyzed non-coding genomic regions.
| Chr | Gen. coords (build 36/hg18) | Cytoband | Length (kbp) |
|---|---|---|---|
| 1 | 10,774,189-10,888,710 | p36.22 | 114.5 |
| 44,762,643-44,775,496 | p34.1 | 12.85 | |
| 87,801,345-88,701,111 | p22.3-p22.2 | 899.8 | |
| 211,655,265-213,956,186 | q32.3-q41.0 | 2,291.1 | |
|
| |||
| 2 | 57,825,856-60,295,497 | p16.1 | 2,469.6 |
| 157,259,412-157,609,094 | q24.1 | 349.68 | |
| 164,369,890-164,552,815 | q24.3 | 182.92 | |
|
| |||
| 3 | 18,819,160-19,009,599 | p24.3 | 190.44 |
| 70,648,908-70,955,219 | p13.0 | 306.3 | |
| 138,465,742-138,608,879 | q22.3 | 143.14 | |
| 148,532,029-148,532,925 | q24.0 | 18.99 | |
|
| |||
| 5 | 76,976,710-77,305,243 | q14.1 | 328.53 |
| 87,204,003-87,729,136 | q14.3 | 525.13 | |
|
| |||
| 6 | 51,184,545-51,257,443 | p12.3 | 72.9 |
| 98,223,040-99,102,761 | q16.1 | 879.7 | |
|
| |||
| 7 | 114,903,668-114,922,472 | q31.2 | 18.8 |
|
| |||
| 9 | 80,662,013-81,062,015 | q21.31 | 400.0 |
|
| |||
| 10 | 102,362,416-102,438,368 | q24.31 | 75.95 |
|
| |||
| 13 | 71,566,646-71,670,119 | q21.33 | 103.47 |
|
| |||
| 14 | 28,930,805-29,812,660 | q12 | 881.85 |
| 96,500,869-96,949,518 | q32.2 | 448.65 | |
|
| |||
| 15 | 33,706,004-34,607,756 | q14 | 901.75 |
|
| |||
| 18 | 33,818,719-34,318,041 | q12.2 | 499.3 |
|
| |||
| 19 | 35,459,348-35,533,833 | q12 | 74.48 |
B. CNV detection
We have previously developed a methodology based on the matched-filter for detecting regions of pairwise similarity and dissimilarity between genomic sequences [20][21]. By definition, the matched-filter increases the signal-to-noise ratio (SNR) in regions of pairwise waveform similarity and decreases SNR in regions of mismatch. Therefore, when comparing genomic sequences that are spatially similar to each other with the exception of regions containing CNVs in some sequences but not in others, signal mismatch may be used to identify these regions. The matched-filter improves SNR by reducing the noise spectral bandwidth to that of the desired signal. In theory, the optimum filter h(k) that maximizes SNR is the time-reversed signal itself, i.e., h(k) = y(−k), under the assumption of white noise. Thus, the filtered signal yMF is given by
| (1) |
where ⊗ denotes convolution. As a waveform matching technique, matched-filtering treats discrete DNA sequences as continuous signals, potentially resulting in spurious spatial correlations between probes. However, we have previously shown that this approach does not introduce significant correlations in the filtered sequence [21]. In addition, the method strongly depends on the choice of the template sequence. There is no unique filter in this case, since there is no unique genomic sequence that captures all normal human genomic variability. Thus, we sequentially matched each sequence with all other sequences and at each iteration obtained a new filtered sequence with increased SNR in regions of genomic similarity and decreased SNR in regions of dissimilarity. An allelic gain was called if the log2 ratio at a particular marker was , thus assuming a threshold of 1 copy gain, and an allelic loss was called if the log2 ratio was , assuming a threshold of 1 copy loss. Although thresholds may be set according to the analysis of interest, we used thresholds of one gain or one loss for simplicity. Finally, a CNV was called based on the frequency of its occurrence. The probability of a CNV at marker i was defined as the union of the probabilities of gain and loss at that marker [21]:
| (2) |
where j = 1, …, J is the number of sequences with gains above the threshold, m = 1, …, M the number of sequences with losses below the threshold, and n the total number of sequences in the sample. A 10% frequency was chosen as the threshold. There are a number of studies that have shown that common CNVs in the healthy genome are relatively rare, with frequencies ≤ 10% [12][15]. Only very few CNVs occur at high frequencies, often in specific populations.
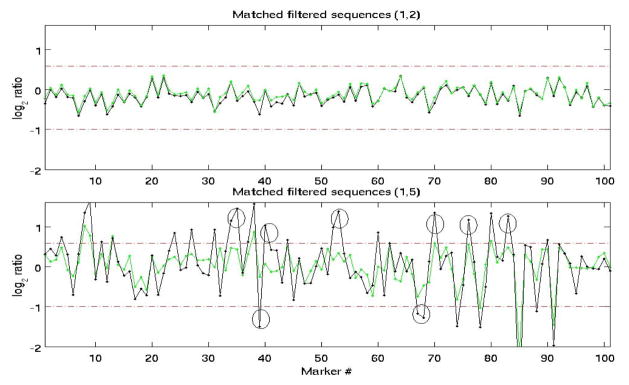
Figure 1 shows examples of raw and matched-filtered sequences, with locally increased SNR.
Fig. 1.
Example of two sequences matched filtered with the same template. Raw sequences (green), matched-filtered sequences (black). Circles mark regions with increased SNR which are above the detection threshold in the filtered sequence but below the threshold in the original sequence.
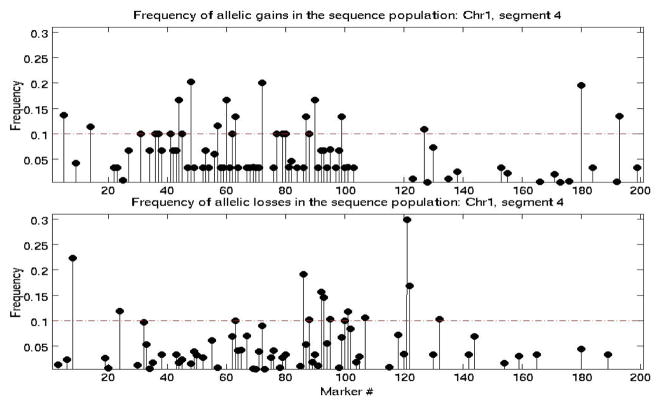
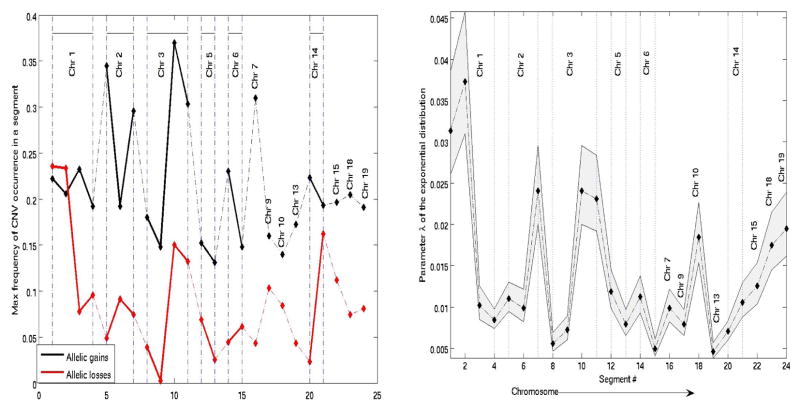
Note that depending on the structure of a sequence and its similarity to the template, matched-filtering may have a negligible effect on the test sequence, as shown in the top plot in Figure 1. The CNV probability distribution across markers within each segment appeared to be best described by an exponential distribution. The parameter λ of the distribution was estimated for each segment, using the maximum-likelihood method. An example of the distribution of of CNV frequency (separately for allelic gains and losses) in a single segment is shown in Figure 2. The maximum frequency of CNV gain/loss at each segment and corresponding estimated rate parameter of the exponential distribution, of CNV probability, obtained using Equation 2, are shown in Figures 3(a) and 3(b), respectively. There is no apparent chromosome-dependent variation of the CNV frequency of occurrence or the spatial probability distribution of these CNVs as a function of genomic distance.
Fig. 2.
Frequency of detected allelic gains (top) and losses (bottom) ratios at each marker of a single segment.
Fig. 3.
CNV frequency and probability distribution parameter.
(a) Maximum CNV frequency (gain (b) Variation of the exponential dis-(black), loss (red)) at each segment. tribution parameter.
III. RESULTS
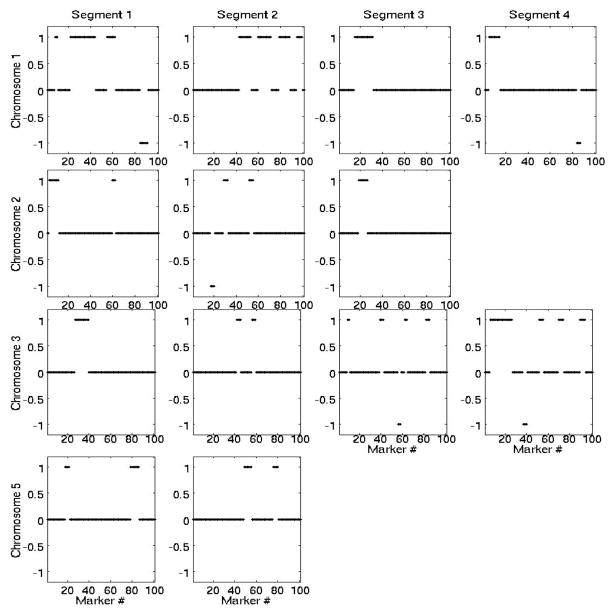
Many analyzed genomic segments included multiple allelic gains, but very few losses (only chromosomes 1,2,3 had detectable losses). In total 52 CNVs were detected of variable length (30–187kb). Examples of CNVs at four chromosomes and multiple segments is shown in Figure 4. The actual level of gain/loss is not shown, only ±1, for gain/loss, respectively.
Fig. 4.
Detected CNVs at multiple segments in each chromosome. +1 corresponds to gain (not the actual gain magnitude), −1 corresponds to loss.
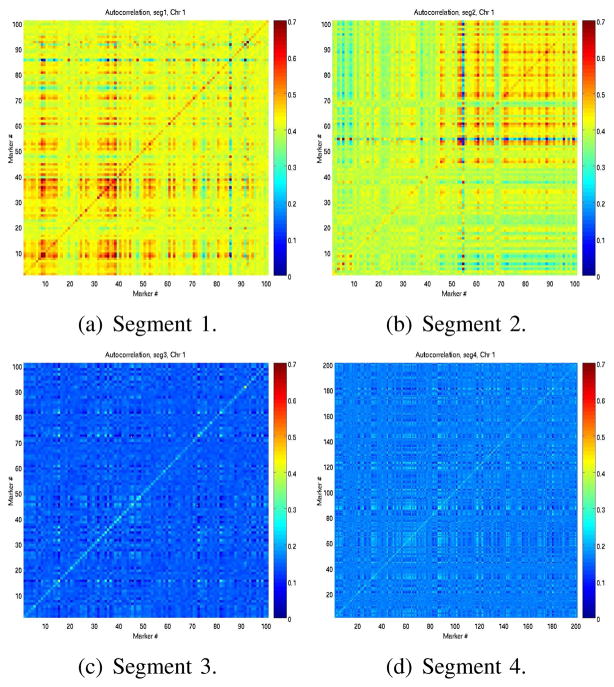
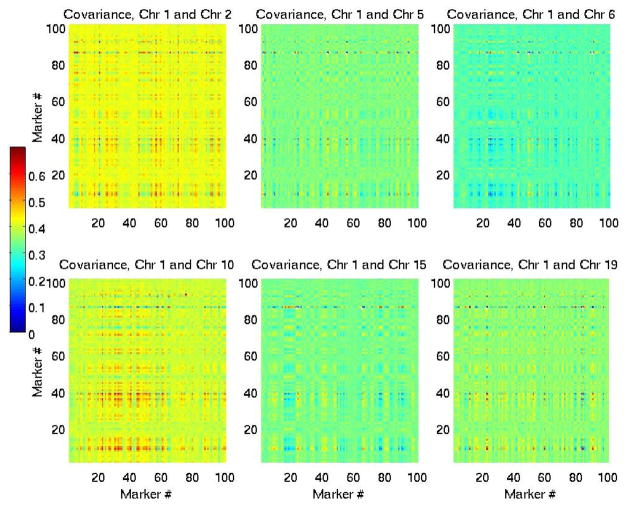
To assess potential correlations within and across segments and chromosomes we computed auto-correlation and sample covariance matrices, assuming each marker corresponds to a random variable Xm, taking values 1, 0,−1 (gain, no change, loss). Examples are shown in Figures 5(a)–5(d) and 6.
Fig. 5.
Autocorrelation matrices of segments 1, 2, 3, 4 in chromosome 1, to measure correlations between loci within individual segments. In all matrices X and Y axes correspond to loci. Colors represen levels of correlation, 0 (blue) to 0.7 (red).
Fig. 6.
Clockwise from top left: covariance matrices between segments in chromosomes 1,2, 1,5, 1,6, 1,10, 1,15, 1,19. These matrices measure correlations between loci across segments.
Clusters of markers corresponding to CNVs were locally correlated in several individual segments. However, there were only a few regions across chromosomes which appeared correlated, and these were typically very short clusters of markers, often ≤ 50 kb long. From the auto-correlation and covariance matrices, the adjacency matrices Ai,j between nodes Xi and Xj of the network graph was defined as Ai,j = 1σ(i,j)≥α, where α is a threshold on the covariance. Random variables Xi and Xj correspond to markers at position i and j either along the same segment (in which case the sample covariance was the n × p autocorrelation matrix ri,j of the segment, with p the number of markers in the segments and n the number of observations), or along two different segments. Since we are interested in assessing correlations between segments, and consequently chromosomes, we set the covariance threshold as: α = mins(maxm,s(ri,j, i ≠ j)), where the min is taken over all segments s and the max is over all markers m in a segment. This is a data-based empirical threshold and thus not unique. It is a conservative threshold to identify edges between strongly correlated nodes, since it is based on the autocorrelation matrices of individual segments. Based on this threshold and estimated sample covariance matrices, a random graph was identified, shown in Figure 7.
Fig. 7.
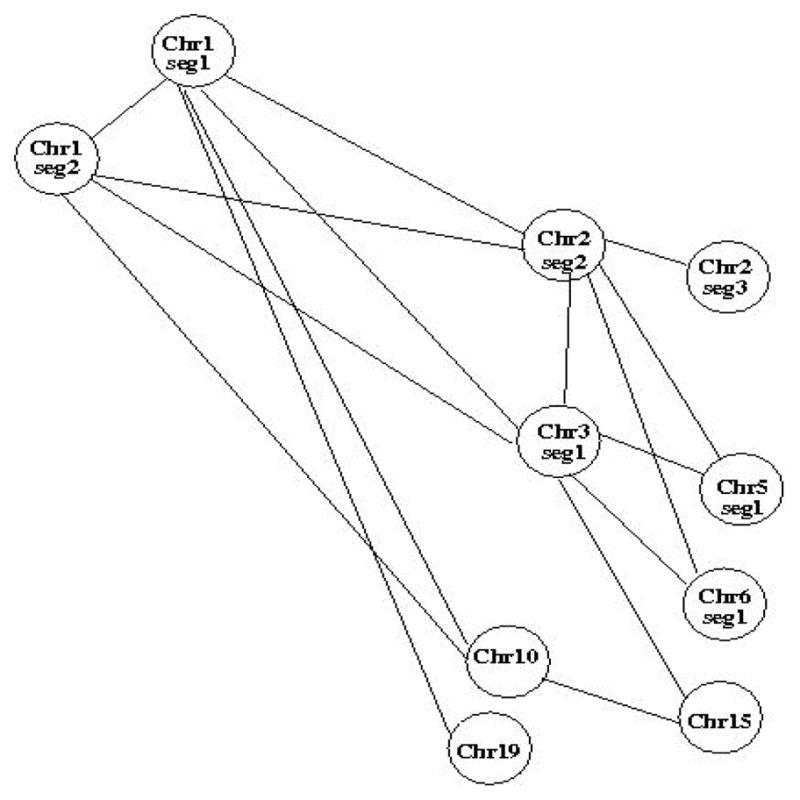
Network graph based on the adjacency matrix estimated from the covariance matrices between segments.
IV. CONCLUSIONS
We have investigated potential correlations between CNVs within and across chromosomes, in a small set of evolutionarily ultra-conserved segments of non-coding DNA, sufficiently distant from any gene-containing regions. We analyzed 200 array CGH sequences from healthy adults from the TCGA, using matched-filtering, a pattern matching signal processing method, which increases SNR locally in the data and thus facilitates CNV detection. Using a threshold based on the frequency of CNVs in the studied sample, we identified 52 CNVs, predominantly allelic gains of variable length across chromosomes. Chromosomes 1–5 included the highest number of CNVs. CNV occurrence appeared to be exponentially distributed across markers. Furthermore, we estimated both autocorrelation matrices of individual segments, to assess potential local correlations between markers and CNVs, and sample covariance matrices between segments, to assess long-distance correlations between CNVs. Local correlations between markers and cluster of markers identified as CNVs were significantly higher within segments. However, overall correlation between markers was low (≤ 0.1) in some segments, particularly those with very short CNVs. In addition, based on estimated segment covariances, a few CNVs in different chromosomes appeared to be correlated, independently of the distance between them. Specifically, covariances in regions containing CNVs in chromosomes 1, 2, 3, 10 and 19 were above the set threshold. The location of these CNVs and their long-distance correlations appeared random. Evidently this is an initial study on CNV correlations in extra-genic regions and is based on short DNA segments. A more extensive study of multiple larger regions is necessary to estimate these correlations robustly.
Acknowledgments
This work was supported by the Harvard Clinical and Translational Science Center (NIH Award #UL1 RR 025758)
References
- 1.The results published here are based upon data generated by The Cancer Genome Atlas Pilot Project established by the NCI and NHGRI: http://cancergenome.nih.gov
- 2.Database of Genomic Variants. http://projects.tcag.ca/variation.
- 3.Supplement to Bejerano et al., 2004: http://users/soe.ucsc.edu
- 4.Beckmann JS, Estivill X, Antonarakis SE. Copy number variants and genetic traits: closer to the resoultion of phenotypic to genotypic variability. Nat Rev Genet. 2007;8:639–644. doi: 10.1038/nrg2149. [DOI] [PubMed] [Google Scholar]
- 5.Bejerano G, et al. Ultraconserved element in the human genome. Science. 2004;304:1321–1325. doi: 10.1126/science.1098119. [DOI] [PubMed] [Google Scholar]
- 6.Carter NP. Methods and strategies for analyzing copy number variation using DNA microarrays. Nat Genet. 2007;39:S16S21. doi: 10.1038/ng2028. [DOI] [PMC free article] [PubMed] [Google Scholar]
- 7.Conrad DF, et al. Origins and functional impact of copy number variation in the human genome. Nature. 2010;464:704–712. doi: 10.1038/nature08516. [DOI] [PMC free article] [PubMed] [Google Scholar]
- 8.Dermitzakis ET, Reymond A, Antonarakis SE. Conserved non-genic sequences - an unexpected feature of mammalian genomes. Nat Rev Genet. 2005;6:151–157. doi: 10.1038/nrg1527. [DOI] [PubMed] [Google Scholar]
- 9.Ferline A, et al. Custom CGH array profiling of CNVs on chromosome 6p21.32 in patients with venous malformations associated with multiple sclerosis. BMC Medical Genetics. 2010;11(64):1–10. doi: 10.1186/1471-2350-11-64. [DOI] [PMC free article] [PubMed] [Google Scholar]
- 10.Van Helden J, Rios AF, Collado-Vide J. Discovering regulatory elements in non-coding sequences by analysis of spaced dyads. Nucleic Acids. 28(8):1801–1818. doi: 10.1093/nar/28.8.1808. [DOI] [PMC free article] [PubMed] [Google Scholar]
- 11.Iafrate AJ, et al. Detection of large-scale variation in the human genome. Nat Genet. 2004;39:949–951. doi: 10.1038/ng1416. [DOI] [PubMed] [Google Scholar]
- 12.Jakobsson M, et al. Genotype, haplotype and copy-number variation in worldwide human populations. Nature. 2008;451:998–1003. doi: 10.1038/nature06742. [DOI] [PubMed] [Google Scholar]
- 13.Kallioniemi A, et al. Comparative Genomic Hybridization for Molecular Cytogenetic Analysis of Solid Tumors. Science. 1992;258(5083):818–821. doi: 10.1126/science.1359641. [DOI] [PubMed] [Google Scholar]
- 14.Karolchik D, et al. The UCSC Genome Browser Database. Nucleic Acids Res. 2003;31:51–54. doi: 10.1093/nar/gkg129. [DOI] [PMC free article] [PubMed] [Google Scholar]
- 15.Ionita-Laza I, et al. On the frequency of copy number variants. Bioinformatics. 2008;24(20):2350–2355. doi: 10.1093/bioinformatics/btn421. [DOI] [PMC free article] [PubMed] [Google Scholar]
- 16.Pasic I, et al. Recurrent focal copy-number changes and loss of heterozygosity implicate two non-coding RNAs and one tumor suppressor gene at chromosome 3q13.31 in osteosarcoma. Cancer Research. 2010;70:1746–1748. doi: 10.1158/0008-5472.CAN-09-1902. [DOI] [PubMed] [Google Scholar]
- 17.Prabhakar S, et al. Accelerated evolution of conserved non-coding sequences in humans. Science. 2006;314:786. doi: 10.1126/science.1130738. [DOI] [PubMed] [Google Scholar]
- 18.Redon R, et al. Global Variation in Copy Number in the Human Genome. Nature. 2006;44:444–454. doi: 10.1038/nature05329. [DOI] [PMC free article] [PubMed] [Google Scholar]
- 19.Shabalina SA, Spiridonov NA. The mammalian transcriptome and the function of non-coding DNA. Genome Biol. 2004;5(4):105. doi: 10.1186/gb-2004-5-4-105. [DOI] [PMC free article] [PubMed] [Google Scholar]
- 20.Stamoulis C, Betenksy RA, Mohapatra G, Louis DN. Application of signal processing techniques for estimating regions of copy number variation in human meningioma DNA. Conf Proc IEEE Eng Med Biol. 2009:6973–6976. doi: 10.1109/IEMBS.2009.5333851. [DOI] [PMC free article] [PubMed] [Google Scholar]
- 21.Stamoulis C, Betensky RA. A novel signal processing approach for the detection of copy number variations in the human genome. Bioinformatics. 2011 July; doi: 10.1093/bioinformatics/btr402. Epub ahead of print. [DOI] [PMC free article] [PubMed] [Google Scholar]
- 22.Walsh T, et al. Rare structural variants disrupt multiple genes in neurodevelopmental pathways. Science. 2008;25:320(5875):539–43. doi: 10.1126/science.1155174. [DOI] [PubMed] [Google Scholar]
- 23.Zhang F, Gue W, Hurles ME, Lupski JR. Copy number variation in human health, disease, and evolution. Annu Rev Genomics Hum Genet. 2009;10:451–481. doi: 10.1146/annurev.genom.9.081307.164217. [DOI] [PMC free article] [PubMed] [Google Scholar]


