Abstract
The primary ultrafast Z-to-E isomerization photodynamics of the phytochrome-related cyanobacteriochrome (CBCR) NpR6012g4 from N. punctiforme were studied by transient absorption pump-dump-probe spectroscopy. A 2-ps dump pulse resonant with the stimulated emission band depleted 21 % of the excited-state population, while the initial photoproduct Lumi-R was depleted by only 11 %. We observe a red-shifted ground-state intermediate (GSI) that we assign to a metastable state that failed to fully isomerize. Multi-component global analysis implicates the generation of additional Lumi-R from GSI via crossing over the ground-state thermal barrier for full isomerization, explaining the discrepancy of excited-state and Lumi-R depletion by the dump pulse. This second-chance ground-state dynamics provides a plausible explanation for the unusually high quantum yield of 40 % for the primary isomerization step in the forward reaction of NpR6012g4.
Keywords: photoreceptors, transient absorption spectroscopy, cyanobacteriochrome, phytochromes, quantum yield, pump-dump-probe
Phytochromes are bilin chromophore-based photoswitching proteins first discovered in plants and later in bacteria and fungi.1-2 Phytochromes modulate various physiological responses, including shade avoidance in plants, and photoconvert between red (~660 nm, Pr) and far-red (~720 nm, Pfr) absorbing states.3 Phytochromes share a bilin-binding GAF (cGMP phosphodiesterase/adenylyl cyclase/FhlA) domain with the distantly related cyanobacteriochromes (CBCRs).4 While phytochromes typically require one or more flanking domains for stability, photo-conversion, and bilin binding, the CBCR GAF domain is sufficient to bind the phycocyanobilin (PCB) chromophore (Fig. 1) and trigger photoresponses encompassing the entire spectral region from ultraviolet to red.4-6 CBCRs are small (< 200 residues) and exhibit broad spectral sensitivity; moreover, they can readily be expressed in E. coli cells engineered for bilin biosynthesis.7 CBCRs are therefore attractive systems for study of protein-chromophore interactions and ultrafast photochemical dynamics as well as for development of fluorescent or optogenetic probes.8-11
Figure 1.
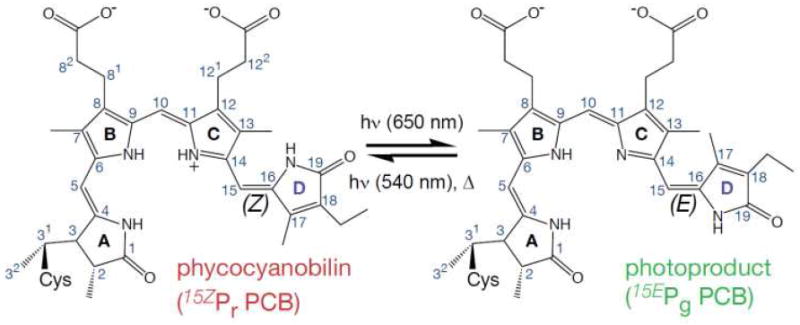
Phycocyanobilin (PCB) chromophore and NpR6012g4’s photochemistry. Pr is the dark-stable state with 15Z conformation, which isomerizes via C15,16-double bond to the higher energy 15E conformer Pg that can convert back to Pr photochemically or thermally.
For the extended family of phytochrome photosensors, it is generally accepted that light triggers the Z to E isomerization of the bilin C15,16 double bond, which leads to rotation of the D-ring (Fig. 1).5 The photoisomerization quantum yield (Φ) for canonical phytochromes has been estimated to be 10-15 %,12-13 significantly lower than that of other isomerizing photoreceptors such as rhodopsin (Φ = 65 %) or the photoactive yellow protein (Φ = 35%).14-15 Recently from ultrafast visible pump-probe (PP) spectroscopy, we reported that the red/green CBCR NpR6012g4 from Nostoc punctiforme ATCC 29133 exhibits a photoisomerization Φ of 32% in the forward (red-to-green or Pr-to-Pg) direction.16 This is the highest yield so far reported for any phytochrome-based sensor system. Here, we explore the primary initiation dynamics underlying this unusually high Φ with femtosecond dispersed pump-dump-probe (PDP) spectroscopy.
Understanding how quantum yields are modulated in photoactive systems is of significant importance in designing novel optogenetic tools and in vivo fluorescence markers.8-9,11 Ultrafast visible PP spectroscopy, though widely successful in studying the photodynamics of many photoactive proteins,17-20 has limitations for studying for forward dynamics of NpR6012g4 (Pr → Pr* → Lumi-R → Pg) due to the significant spectral and temporal overlap between the excited-state (Pr*) and ground-state absorptions of Pr and the primary photoproduct Lumi-R. Furthermore, PP signals are largely insensitive to timescales in which fast intermediates form after slower dynamics. Multipulse broadband PDP signals circumvent these limitations, providing greater insight into the primary photo-induced dynamics, while resolving underlying dynamics and populations that were not accessible with PP experiments alone.21-23 In the PDP experiment, a ‘pump’ pulse excites the ground state population and a second ‘dump’ pulse de-excites the excited-state population after a defined delay time. As demonstrated here, the dump pulse should be selected to be spectrally and temporally resonant with the stimulated emission (SE) band alone so that only the excited-state population is depleted. Consequently, photoproducts that would be derived from the dumped excited-state population are subsequently depleted.
Figure 2A shows the pump and dump pulses overlaid on the ground-state absorption and fluorescence emission bands of Pr in NpR6012g4. PP transient spectra at various probe times are depicted in Figure 2B. The 2-ps to 100-ps spectra clearly show excited-state features of Pr*, including a positive excited-state absorption (ESA) band (440 - 580 nm) and a broad negative SE band (> 680 nm). On longer timescales (>1 ns), the transient spectra exhibit a positive absorption at 675 nm with a bleach (loss of ground-state absorption) at 650 nm, indicating formation of the Lumi-R photoproduct (magenta curve).16 The 740-nm dump pulse is applied 2 ps after the pump pulse and is selectively resonant with the SE band of Pr* (Fig. 2B, black curve), allowing partial de-excitation of the Pr* population.
Figure 2.
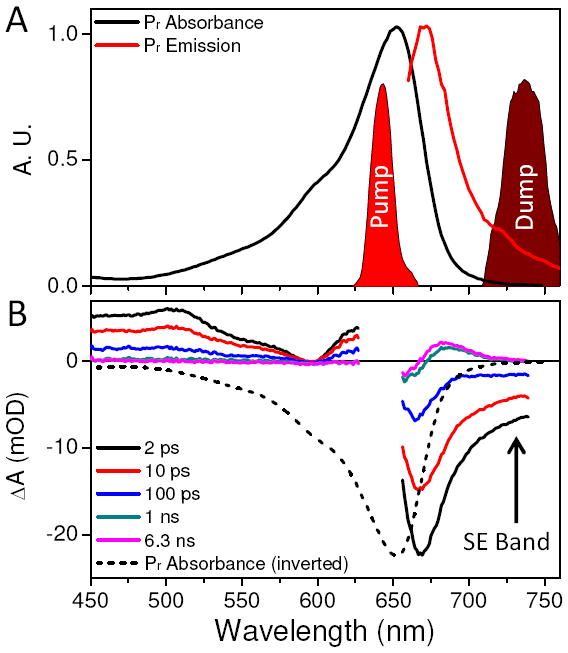
(A) Pr ground-state spectrum (black line) and fluorescence emission band (red line) overlaid with spectra of pump (630 nm) and dump (740 nm) pulses. (B) Transient spectra of pump-probe data at selected probe times. The SE of the 2-ps transient spectrum overlaps the dump pulse spectrum. Inverted Pr absorption (black dashes) is shown for comparison.
Figure 3 contrasts the PP (black circles) and PDP (red circles) signals at selected probe wavelengths. Dump-induced depletion of the excited state is observed as an instantaneous and persistent loss of both ESA (470 nm) and SE (680 and 737 nm) bands. However, at 597 nm, where the PP signal is initially zero (due to overlap of ESA and bleach), the dump-induced depletion of the ESA signal results in a negative signal that rapidly decays on a 10-ps timescale (Fig. 3B). This tracks the kinetics of the ground-state population and is not observed in PP signals alone.16
Figure 3.
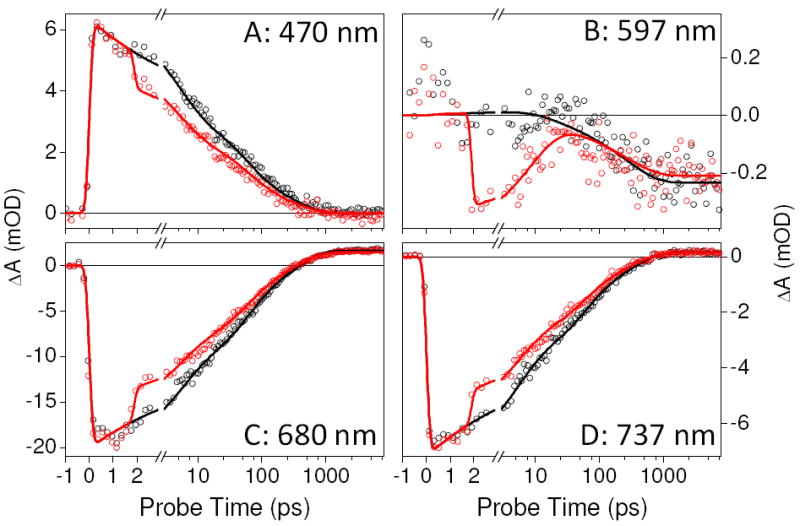
Select kinetic traces of PP (black circle) and PDP (red circle) at wavelengths indicated. Both PP and PDP data are fitted with a kinetic model (solid lines) described in the Supporting Information (Fig. S4).
The PDP kinetics can be resolved spectrally at various probe times (Figure 4). The constructed ΔΔOD signals represent the dump-induced dynamics of the PP signals and are calculated as PDP–PP–DP, where DP is the dump-probe trace. While DP contains no photoinduced signals (Fig. S1), it does contain artifactual cross-phase modulation signals that are (mostly) absent in the ΔΔOD signals.24 To remove the depletion of Pr* from the ΔΔOD signal and resolved only the dump-induced ground-state dynamics, we subtracted scaled PP signals from the PDP signals after normalizing the two signals to the ESA in the PP signal from 440—520 nm (Fig. 2B), which is only sensitive to the Pr* population. These excited-state-normalized-spectra (ESNS) signals track only the ground-state kinetics and assuming the Pr* spectrum does not change in time, which we previously established for NpR6012g4.16
Figure 4.
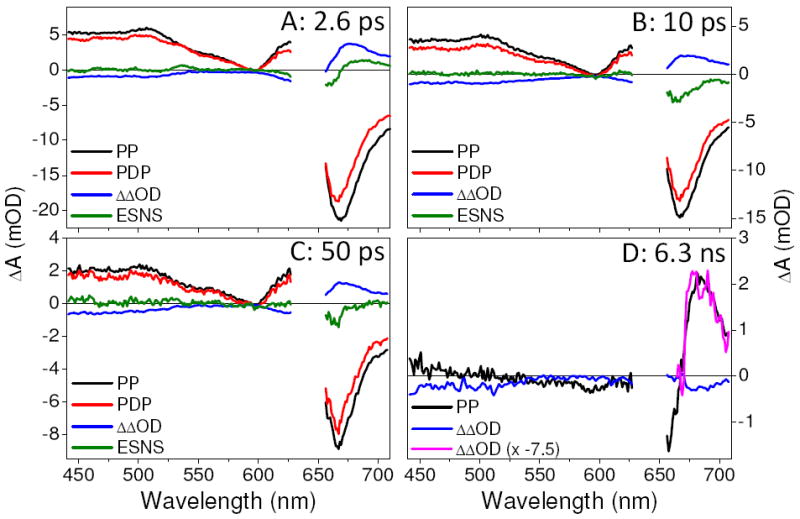
Transient spectra of PP (black), PDP (red), and ΔΔOD (blue) at indicated probe times. The green line is ESNS, the difference spectrum between the PP and the PDP spectra normalized to the PP ESA band at 500 nm. At 2.6 ps, there is positive absorption red-shifted from Pr, indicating the formation of a GSI. The 6.3-ns spectrum shows dump-induced Lumi-R depletion indicated by decrease of the Lumi-R absorption amplitude. The 6.3-ns ΔΔOD is inverted, magnified (pink) and overlaid on the PP data.
The 2.6-ps ESNS, calculated 600-fs after the dumping, exhibits a positive absorption band peaking around 680 nm (Fig. 4A green) that we attribute to a GSI. GSIs have been observed in other PDP experiments25-28 and for isomerizing systems; they are typically interpreted as twisted or partially isomerized ground-state populations.25 The decay of the GSI in NpR6012g4 is multi-phasic on an apparent 10-ps time scale (Figs. 3B and 4B), with full decay occurring by 50 ps (Fig. 4C, green).
The discrepancy between the amplitude of the dump-induced depletion of Pr* (immediately after dumping) and the amplitude of the Lumi-R depletion (long after dumping) is significant. For example, the ESA signal at 470 nm exhibits ~21 % initial depletion (Fig. 3A), while the Lumi-R depletion at 6.3 ns is only ~11 % (Figs. 3 & 4). As further indicated by the overlap between the inverted and magnified (x7.5) ΔΔOD signal and the PP spectrum (Fig. 4D), this suggests that some of the dump-induced GSI can produce Lumi-R. The standard models used to interpret primary initiation photodynamics of isomerizing systems such as photoreceptor proteins instead predict a one-to-one correlation between excited-state depletion and photoproduct depletion (scaled by Φ).12,13
To demonstrate that the discrepancy between dump-induced depletion of Pr* and decreased Lumi-R yield is not a spectral or temporal artifact, a range of different probe wavelengths and times was investigated (Fig. 5). Since the ESA band from 440 to 525 nm (Fig. 1B) is a clean measure of Pr* population, it was used to estimate the dump-induced depletion. The ESA signal in the wavelength range of 440 to 525 nm was averaged at time points from 2.6 to 100 ps in Figure 5B (black circles). Similarly, the time-averaged ESA signal (from 2.6 to 100 ps) shown in Figure 5D (black circles) reveals that the ~21 % depletion extends to all wavelengths of the ESA. In contrast, the Lumi-R population (green circles) is depleted by a distinctly smaller amplitude of ~11 %. These results demonstrate that Lumi-R is forming from a species which was de-excited by the dump pulse, implying that Lumi-R need not be directly generated from Pr* on the excited-state potential energy surface.
Figure 5.
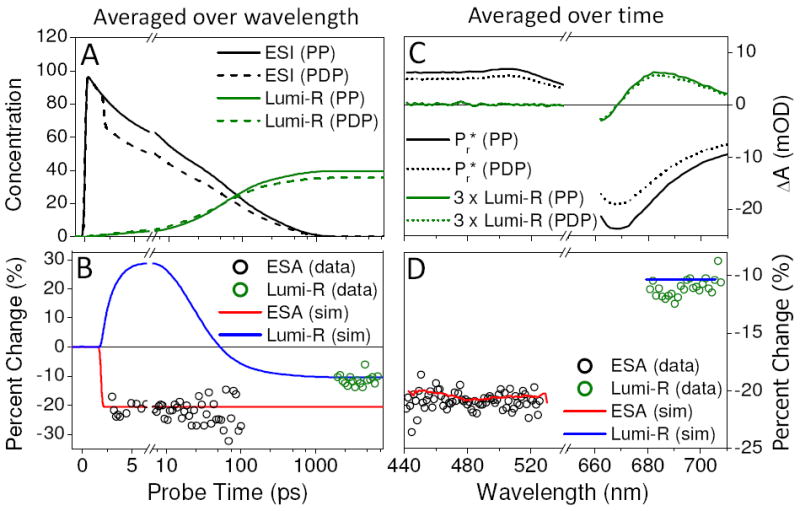
Comparison of the average percent change of initial Pr* and final Lumi-R populations induced by the dump pulse. Percent change is calculated by (PP-PDP)/PP × 100 %. The simulation is based on the kinetic model in Figure 6A. Panels A and B are averaged over wavelengths: 440 to 525 nm and 680 to 705 nm for Pr* and Lumi-R, respectively. Panels C and D are averaged over time: 3 to 100 ps and 2 to 7 ns for Pr* and Lumi-R, respectively. (A) Simulated concentration profiles of Pr* (ESI1 + ESI2 + ESI3) and Lumi-R for both PP and PDP conditions. (B) Comparison between simulated Pr* and Lumi-R percent change (lines) and experimental percent change (circles) averaged over wavelengths. (C) PP and PDP spectra of Pr* and Lumi-R for reference. (D) Comparison between simulated (lines) and experimental (circles) Pr* and Lumi-R percent change averaged over time.
An alternative explanation for the depletion discrepancy is that the dump pulse excites transitions other than the SE (S1 → S0) to skew the comparison of the two depletions. The three possible transitions that can be pumped by the dump pulse are: Pr (S0 → S1), Lumi-R (S0 → S1), and Pr* (S1 → Sn). The first possibility can be excluded based on examination of the overlap of the dump laser spectrum with the ground-state spectra of Pr (Fig. 2A); furthermore no dynamics are observed in the DP signals other than the previously discussed artifacts (Fig. S1). The second possibility (exciting Lumi-R) is excluded, because the spectral overlap between Lumi-R and the dump-pulse is also negligible (Fig. 2, magenta curve) and because no significant population of Lumi-R has been generated at the 2-ps dump time (Fig. S4C).16
Excluding the third possibility of repumping of Pr* into one or more higher-lying states22,29 requires more effort. Repumping Pr* may decrease the Lumi-R product yield by initiating higher-energy photochemistry (e.g., ionization) separate from the isomerization reaction on the lower excited-state energy surface. For this mechanism to be efficient, the 740-nm pulse must be resonant with an ESA (S1 → Sn); however, this is inconsistent with the PP signals (Fig. 2B), which show no clearly resolved (positive) ESA at the 740-nm dump wavelength. Only a strong SE band is resolved at 740-nm and at 2 ps. Furthermore, the fluorescence spectrum (Fig. 2A, red curve)30 tracks the same spectral trend as the SE, supporting resonance of the dump pulse with only the SE band. Moreover, the Pr* population is depleted by the dump pulse at 21 % and stays depleted at that level to 100 ps (Fig. 5B). Assuming that there is a higher lying excited-state population, the S1 state would be expected to repopulate at least partially as population trickled down the excited-state manifold;22 this is not observed in the PDP signals. Finally, for the Pr* repumping mechanism to be responsible for the depletion discrepancy (Fig.5), at least 50 % of the initial Pr* depletion must originate from repumping (assuming 100 % loss), with the rest originating from dumping. This would require the PP signal around the SE band to be near-zero, which is not the case here (Fig.4A and B, > 670 nm). Hence, for all of these reasons, the observed depletion of Pr* (and Lumi-R) is exclusively attributed to the dumping (S1 → S0) of the excited-state Pr* population to form a non-equilibrated ground-state population.
Hence, the discrepancy between the depletion of Pr* and Lumi-R is also a dump-dependent effect that must result from a reactive GSI. The similar (albeit not identical) spectral features of the GSI and Lumi-R suggest that GSI adopts a twisted structure that has failed either to isomerize fully or to decay back to the ground state. The GSI decay kinetics are resolved in the 597-nm signals (Fig. 3B) with an apparent 10-ps lifetime. A fraction of GSI population must convert to Lumi-R on the ground-state surface to explain the discrepancy between the Pr* and Lumi-R depletions.
To quantify this, a previously proposed model constructed to interpret the PP signals alone16 was extended to include dumping in the PDP data (Figs. 6A and S4).31 The original model postulated multiple coexisting ground-state sub-populations (i.e., inhomogeneity) to describe the non-exponential PP kinetics. Only two out of three ground-state populations are productive for Lumi-R formation with an overall Φ of 32 %; the fastest 4.6-ps excited-state decay does not form Lumi-R.16 Our dump-extended model posits that the GSI populations formed after dumping are connected to both productive excited-state intermediates (ESI 2 and ESI 3) and generate Lumi-R (30-ps time constant) or decay back in Pr (15 ps). The kinetics of this are resolved in the 10-ps decay PDP signals (Fig. 3B). As expected, the GSI spectrum (i.e., the Species Associated Difference Spectra or SADS31) exhibits a red-shifted absorption band (Fig. S4B), that is similar to normalized 2.6-ps transient spectrum (Fig. 4A).
Figure 6.
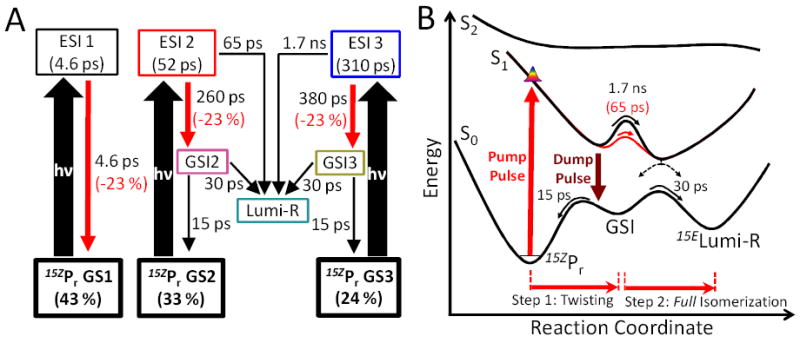
(A) Kinetic model of NpR6012g4 forward reaction based on PDP data. (B) Potential Energy Surface32-33 of the forward reaction based on target model in Panel A. Only the productive pathway from ESI 2 (potential barrier and time constant in red on S1 potential surface) and ESI 3 (all black)are described here.
This model successfully simulates both the PP and PDP signals (Fig. 3) and the dump-induced depletion properties (Fig. 5B and D), unlike analogous spectral models that exclude either GSI populations or their evolution to Lumi-R (Fig. S5 to S12). The calculated percent change based on the new target model (Fig. 6A) is in excellent agreement with the data (Fig. 5, solid lines). Thus, this analysis supports second-chance formation of Lumi-R from a novel GSI of NpR6012g4.
Moreover, additional parameters obtained from PDP data provide further constraints and amendment that confirm a Lumi-R quantum yield of 40 % (Fig. S4C). This is the highest Z → E Lumi-R quantum yield observed in any bilin-based sensor and is significantly higher than all known red/far red canonical phytochromes. This increased efficiency arises due to the NpR6012g4 ground-state dynamics, which provide a second pathway for generating Lumi-R (Fig. 6B). The existence of a productive GSI lying between Pr and Lumi-R on the ground-state reaction coordinate provides further support for a step-wise isomerization mechanism, in contrast to concerted mechanisms such as hula-twist34 or bicycle-pedal35 that do not require extensive cavity space for isomerization. Atomic resolution structural data of phytochrome systems show a less tightly packed cavity for D-ring in comparison to other rings, further supporting step-wise isomerization mechanism.36-37
The excited-state timescales of NpR6012g4 are similar to those of the cyanobacterial red/far-red phytochrome Cph1. However, in NpR6012g4, Lumi-R is not formed from the excited-state population with the fastest decay,16 while Cph1 demonstrates rapid productive evolution of the structurally sensitive hydrogen-out-of-plane (HOOP) mode of the methine bridge between C and D ring.38 Kennis and co-workers studied the PP signals of other bacterial phytochromes, observing nonproductive fast exited-state decay like that of NpR6012g4; this behavior was ascribed to D-ring twisting that increased tension within hydrogen-bond networks, some of which break for full isomerization with a low Φ (6-13 %).13
The exact nature of the twisted GSIs is to be studied further. It will be necessary to perform vibration-sensitive PDP experiments to describe these initiation dynamics at the molecular level. PDP approaches are necessary because of the inverted timescales, in which fast GSI evolution is masked by slower ESI evolution. It will also be interesting to see whether such a second-chance initiation mechanism is observed in other red/green CBCRs. The results we have obtained demonstrate the utility of the PDP experiment and reveal a new paradigm for photosensory proteins: the second-chance initiation mechanism as a important mechanism of generating high Φ.
Supplementary Material
Acknowledgments
We thank Lu Zhao for help with data collection. This work was supported by grants from the Chemical Sciences, Geosciences, and Biosciences Division, Office of Basic Energy Sciences, Office of Science, United States Department of Energy (DOE DE-FG02-09ER16117) to both J.C.L. and D.S.L. and the National Institutes of Health (GM068552) to J.C.L.
Footnotes
Supporting Information Available: Experimental procedures and supplementary results are available free of charge via the Internet at http://pubs.acs.org.
References
- 1.Rockwell NC, Su YS, Lagarias JC. Annual Review of Plant Biology. 2006;57:837. doi: 10.1146/annurev.arplant.56.032604.144208. [DOI] [PMC free article] [PubMed] [Google Scholar]
- 2.Auldridge ME, Forest KT. Critical Reviews in Biochemistry and Molecular Biology. 2011;46:67. doi: 10.3109/10409238.2010.546389. [DOI] [PubMed] [Google Scholar]
- 3.Franklin KA, Quail PH. Journal of Experimental Botany. 2010;61:11. doi: 10.1093/jxb/erp304. [DOI] [PMC free article] [PubMed] [Google Scholar]
- 4.Ikeuchi M, Ishizuka T. Photochemical & Photobiological Sciences. 2008;7:1159. doi: 10.1039/b802660m. [DOI] [PubMed] [Google Scholar]
- 5.Rockwell NC, Lagarias JC. Chemphyschem. 2010;11:1172. doi: 10.1002/cphc.200900894. [DOI] [PMC free article] [PubMed] [Google Scholar]
- 6.Rockwell NC, Martin SS, Feoktistova K, Lagarias JC. Proceedings of the National Academy of Sciences of the United States of America. 2011;108:11854. doi: 10.1073/pnas.1107844108. [DOI] [PMC free article] [PubMed] [Google Scholar]
- 7.Gambetta GA, Lagarias JC. Proceedings of the National Academy of Sciences of the United States of America. 2001;98:10566. doi: 10.1073/pnas.191375198. [DOI] [PMC free article] [PubMed] [Google Scholar]
- 8.Zhang JA, Wu XJ, Wang ZB, Chen Y, Wang X, Zhou M, Scheer H, Zhao KH. Angewandte Chemie-International Edition. 2010;49:5456. doi: 10.1002/anie.201001094. [DOI] [PubMed] [Google Scholar]
- 9.Shu XK, Royant A, Lin MZ, Aguilera TA, Lev-Ram V, Steinbach PA, Tsien RY. Science. 2009;324:804. doi: 10.1126/science.1168683. [DOI] [PMC free article] [PubMed] [Google Scholar]
- 10.Moeglich A, Moffat K. Photochemical & Photobiological Sciences. 2010;9:1286. doi: 10.1039/c0pp00167h. [DOI] [PubMed] [Google Scholar]
- 11.Toh KC, Stojkovic EA, van Stokkum IHM, Moffat K, Kennis JTM. Physical Chemistry Chemical Physics. 2011;13:11985. doi: 10.1039/c1cp00050k. [DOI] [PubMed] [Google Scholar]
- 12.Kelly JM, Lagarias JC. Biochemistry. 1985;24:6003. [Google Scholar]
- 13.Toh KC, Stojkovic EA, van Stokkum IHM, Moffat K, Kennis JTM. Proceedings of the National Academy of Sciences of the United States of America. 2010;107:9170. doi: 10.1073/pnas.0911535107. [DOI] [PMC free article] [PubMed] [Google Scholar]
- 14.Kim JE, Tauber MJ, Mathies RA. Biochemistry. 2001;40:13774. doi: 10.1021/bi0116137. [DOI] [PMC free article] [PubMed] [Google Scholar]
- 15.Vanbrederode ME, Gensch T, Hoff WD, Hellingwerf KJ, Braslavsky SE. Biophysical Journal. 1995;68:1101. doi: 10.1016/S0006-3495(95)80284-5. [DOI] [PMC free article] [PubMed] [Google Scholar]
- 16.Kim PW, Freer LH, Rockwell NC, Martin SS, Lagarias JC, Larsen DS. Biochemistry. 2011 doi: 10.1021/bi2017365. Submitted. [DOI] [PubMed] [Google Scholar]
- 17.Wang Q, Schoenlein RW, Peteanu LA, Mathies RA, Shank CV. Science. 1994;266:422. doi: 10.1126/science.7939680. [DOI] [PubMed] [Google Scholar]
- 18.Visser HM, Kleima FJ, vanStokkum IHM, vanGrondelle R, vanAmerongen H. Chemical Physics. 1996;210:297. [Google Scholar]
- 19.Connelly JP, Muller MG, Bassi R, Croce R, Holzwarth AR. Biochemistry. 1997;36:281. doi: 10.1021/bi962467l. [DOI] [PubMed] [Google Scholar]
- 20.Devanathan S, Pacheco A, Ujj L, Cusanovich M, Tollin G, Lin S, Woodbury N. Biophysical Journal. 1999;77:1017. doi: 10.1016/S0006-3495(99)76952-3. [DOI] [PMC free article] [PubMed] [Google Scholar]
- 21.Larsen DS, Vengris M, van Stokkum IHM, van der Horst MA, Cordfunke RA, Hellingwerf KJ, van Grondelle R. Chemical Physics Letters. 2003;369:563. [Google Scholar]
- 22.Larsen DS, Papagiannakis E, van Stokkum IHM, Vengris M, Kennis JTM, van Grondelle R. Chemical Physics Letters. 2003;381:733. [Google Scholar]
- 23.Kennis JTM, Larsen DS, Ohta K, Facciotti MT, Glaeser RM, Fleming GR. Journal of Physical Chemistry B. 2002;106:6067. [Google Scholar]
- 24.Lorenc M, Ziolek M, Naskrecki R, Karolczak J, Kubicki J, Maciejewski A. Applied Physics B-Lasers and Optics. 2002;74:19. [Google Scholar]
- 25.Rupenyan A, van Stokkum IHM, Arents JC, van Grondelle R, Hellingwerf KJ, Groot ML. Journal of Physical Chemistry B. 2009;113:16251. doi: 10.1021/jp9065289. [DOI] [PubMed] [Google Scholar]
- 26.Larsen DS, van Stokkum IHM, Vengris M, van der Horst MA, de Weerd FL, Hellingwerf KJ, van Grondelle R. Biophysical Journal. 2004;87:1858. doi: 10.1529/biophysj.104.043794. [DOI] [PMC free article] [PubMed] [Google Scholar]
- 27.Kennis JTM, Larsen DS, van Stokkum IHM, Vengris M, van Thor JJ, van Grondelle R. Proceedings of the National Academy of Sciences of the United States of America. 2004;101:17988. doi: 10.1073/pnas.0404262102. [DOI] [PMC free article] [PubMed] [Google Scholar]
- 28.Gai F, McDonald JC, Anfinrud PA. Journal of the American Chemical Society. 1997;119:6201. [Google Scholar]
- 29.Larsen DS, Vengris M, van Stokkum IHM, van der Horst MA, de Weerd FL, Hellingwerf KJ, van Grondelle R. Biophysical Journal. 2004;86:2538. doi: 10.1016/S0006-3495(04)74309-X. [DOI] [PMC free article] [PubMed] [Google Scholar]
- 30.Fukushima Y, Iwaki M, Narikawa R, Ikeuchi M, Tomita Y, Itoh S. Biochemistry. 2011;50:6328. doi: 10.1021/bi101799w. [DOI] [PubMed] [Google Scholar]
- 31.van Stokkum IHM, Larsen DS, van Grondelle R. Biochimica Et Biophysica Acta-Bioenergetics. 2004;1657:82. doi: 10.1016/j.bbabio.2004.04.011. [DOI] [PubMed] [Google Scholar]
- 32.Muller MG, Lindner I, Martin I, Gartner W, Holzwarth AR. Biophysical Journal. 2008;94:4370. doi: 10.1529/biophysj.106.091652. [DOI] [PMC free article] [PubMed] [Google Scholar]
- 33.Holzwarth AR, Venuti E, Braslavsky SE, Schaffner K. Biochimica Et Biophysica Acta. 1992;1140:59. [Google Scholar]
- 34.Liu RSH. Accounts of Chemical Research. 2001;34:555. doi: 10.1021/ar000165c. [DOI] [PubMed] [Google Scholar]
- 35.Warshel A. Nature. 1976;260:679. doi: 10.1038/260679a0. [DOI] [PubMed] [Google Scholar]
- 36.Wagner JR, Brunzelle JS, Forest KT, Vierstra RD. Nature. 2005;438:325. doi: 10.1038/nature04118. [DOI] [PubMed] [Google Scholar]
- 37.Rockwell NC, Lagarias JC. Plant Cell. 2006;18:4. doi: 10.1105/tpc.105.038513. [DOI] [PMC free article] [PubMed] [Google Scholar]
- 38.Dasgupta J, Frontiera RR, Taylor KC, Lagarias JC, Mathies RA. Proceedings of the National Academy of Sciences of the United States of America. 2009;106:1784. doi: 10.1073/pnas.0812056106. [DOI] [PMC free article] [PubMed] [Google Scholar]
Associated Data
This section collects any data citations, data availability statements, or supplementary materials included in this article.


