Abstract
Spiral ligament fibrocytes function in cochlear homeostasis, maintaining the endocochlear potential by participating in potassium recycling, and fibrocyte degeneration contributes to hearing loss. Their superficial location makes them amenable to replacement by cellular transplantation. Fibrocyte cultures offer one source of transplantable cells, but determining what fibrocyte types they contain and what phenotype transplanted cells may adopt is problematic. Here, we use immunogold electron microscopy to assess the relative expression of markers in native fibrocytes of the CD/1 mouse spiral ligament. Caldesmon and aquaporin 1 are expressed more in type III fibrocytes than any other type. S-100 is strongly expressed in types I, II, and V fibrocytes, and α1Na,K-ATPase is expressed strongly only in types II and V. By combining caldesmon or aquaporin 1 with S-100 and α1Na,K-ATPase, a ratiometric analysis of immunogold density distinguishes all except type II and type V fibrocytes. Other putative markers (creatine kinase BB and connective tissue growth factor) did not provide additional useful analytical attributes. By labeling serial sections or by double or triple labeling with combinations of three antibodies, this technique could be used to distinguish all except type II and type V fibrocytes in culture or after cellular transplantation into the lateral wall.
Keywords: cochlea, fibrocyte, cell type–specific expression, immunogold, electron microscopy, cellular localization
Fibrocytes of the spiral ligament are involved in the homeostatic maintenance of cochlear fluids, working with the stria vascularis to generate the endocochlear potential and provide an optimal ionic environment in the scala media for sensory hair cell transduction (Wangemann 2006). There are five main fibrocyte types (numbered I–V) with specific morphology and location described in the gerbil (Spicer and Schulte 1991) and mouse (Furness et al. 2009). Degeneration of fibrocytes occurs in some forms of deafness in mice (e.g., CD/1 mice) (Wu and Marcus 2003) and humans (Minowa et al. 1999) and can be elicited by noise damage (Hirose and Liberman 2003). It has been suggested that in CD/1 mice, early fibrocyte degeneration may be responsible for subsequent degeneration of other cochlear tissues (Mahendrasingam et al. 2011), a process that could be delayed or prevented by cellular transplantation of fibrocyte precursors (Kamiya et al. 2007) or cultured fibrocytes into the lateral wall.
Cultures of type I (Gratton et al. 1996; Suko et al. 2000) and type IV (Qu et al. 2007) fibrocytes have been made and characterized according to the expression of several potential markers by light microscope (LM) immunocytochemistry. Known markers of native fibrocytes include caldesmon in type I, II, and III fibrocytes; S-100 in types I and II; Na,K-ATPase in type II (Suko et al. 2000); CaATPase in type I; carbonic anhydrase II in types I, III, IV, and V; creatine kinase BB (CK-BB) in types I, III, IV, and V; Na,K,Cl-cotransporter in types II, IV, and V (Qu et al. 2007); aquaporin 1 (AQP1) in type III (Miyabe et al. 2002; Mutai et al. 2009); and connective tissue growth factor (CTGF) in type IV (Adams 2009).
While differences in staining intensity can be seen at the LM level in native fibrocytes (Suko et al. 2000), difficulties in quantifying fluorescence or horseradish peroxidase staining make accurate identification of different cell types by LM immunocytochemistry alone problematic. This is especially so when applied to fibrocyte cultures where there are no regional cues; thus, identification of type IV cells in culture required seven different markers (Qu et al. 2007). Furthermore, if culture or stem cell transplantation should provide a useful method for rescuing spiral ligament degeneration, it will be important to determine how well the transplanted cells take up the morphology and functional characteristics of fibrocytes, making accurate characterization vital.
In this study, we evaluated six different fibrocyte markers, caldesmon, S-100, α1Na,K-ATPase, AQP1, CK-BB, and CTGF, the combination of which, according to previous studies, should enable all classes of fibrocytes to be distinguished. To quantify marker expression, we have employed postembedding immunogold labeling for electron microscopy (EM), which we have previously used to quantify the relative distribution of the glutamate transporter, GLAST, in different fibrocytes (Furness et al. 2009). Only one EM study using one of these markers (Na,K-ATPase) has been performed previously (Nakazawa et al. 1995), and in that study, quantification was not done. In addition, this EM-immunogold method also allows the application of morphological criteria not visible by LM and for the subcellular distribution of label to be determined. We have therefore applied it to characterize native spiral ligament fibrocytes in the CD/1 mouse cochlea and compared it with distributions observed with the same antibodies using immunofluorescence in paraffin sections at the LM level.
Materials and Methods
Fixation and Embedding in Paraffin
CD/1 mice were deeply anesthetized with sodium pentobarbitone (100 mg/kg, Pentoject, Animalcare Ltd, York, UK) injected intraperitoneally. After loss of the pedal withdrawal reflex, the bullae were opened, and each cochlea was perfusion fixed in 4% paraformaldehyde (PFA) in 0.1 M sodium phosphate buffer (PB), pH 7.4, via a small hole made in the cochlear apex and base followed by immersion in the same fixative for 2 hours at room temperature. Cochleae were then washed in 0.1 M PB (pH 7.4) and decalcified in 5.5% ethylene diamine tetra acetic acid (EDTA) in 0.1% PFA solution for 48 hours. The decalcified cochleae were dehydrated in a graded series of ethanols (70%, 80%, 90%, 100%, and dry 100%). The cochleae were then infiltrated through four changes of fresh paraffin (Agar Scientific, Stansted, UK) at 75C, mounted in a mold, covered with fresh wax, and cooled in a refrigerator to solidify the wax. After trimming around the cochleae, the wax block was sectioned at 10 mm on a Reichert-Jung 2040 wax microtome (Vienna, Austria), and the sections were mounted onto glass sides.
For immunofluorescence labeling with antibodies to caldesmon, S-100, AQP1, α1Na,K-ATPase, CK-BB, and CTGF, the wax sections were deparaffinized using xylene and rehydrated via decreasing concentrations of ethanol. They were placed in a moist chamber and labeled using the following steps: permeabilization in 0.025% Triton-X-100 in 0.05 M Tris-buffered saline, pH 7.4 (TBS-T), for 5 minutes 2 times; blocking in TBS containing 1% bovine serum albumen (TBS-BSA) and 10% goat serum for 2 hours at room temperature; incubation in primary antibody diluted 1:100 in TBS-BSA overnight at 4C; washing in TBS-T for 5 minutes 2 times; incubation in AlexaFluor 488 (Invitrogen, Paisley, UK) anti-rabbit secondary antibody diluted 1:100 for 2 hours at room temperature; washing; and mounting in TBS. Sections were observed using a BioRad RC1024 confocal system (Hemel Hempstead, UK).
Fixation and Embedding in LR White Resin
For immunogold labeling, CD/1 mice (coded Hide, 4109, 4178, and 4179) that were prepared for a previous study were used (Furness et al. 2009). CD/1 mice were anesthetized and the cochleae fixed, decalcified, and dehydrated as above. They were then infiltrated in LR White resin (Agar Scientific) for 24 hours and polymerized in fresh resin in gelatin capsules at 50C.
Fixation and Embedding in Low Temperature Lowicryl HM20 Resin
For immunogold labeling with the antibody to caldesmon, four CD/1 mice (animal numbers 1, 2, 3, and 5) were anesthetized as above and perfusion fixed in 4% PFA and 0.1% glutaraldehyde (GTA) in 0.1 M PB, pH 7.4, followed by immersion in the same fixative for 2 hours at room temperature. After washing in 0.1 M PB, the lateral wall of the cochleae was dissected, plunge frozen in liquid propane at −180C, infiltrated in a mixture of methanol and Lowicryl HM20 resin (Agar Scientific, Stansted, UK) followed by pure resin at −45C, and polymerized in fresh pure resin at −45C with ultraviolet light for 48 hours (Furness and Lehre 1997).
EM and Postembedding Immunogold Labeling
The cochleae that were embedded in LR White resin (Agar Scientific) were microsliced in the midmodiolar plane, and ultrathin sections were cut on a Leica Ultracut UCT ultramicrotome (Solms, Germany) and collected on glue pen–coated 200-mesh nickel grids. Ultrathin sections of lateral wall pieces embedded in Lowicryl HM20 resin (Agar Scientific, Stansted, UK) were also cut and collected on 200-mesh nickel grids. For the immunogold labeling procedure, grids were immersed in a series of droplets of the following solutions within a humid chamber: TBS; 20% goat serum and 0.2% Tween 20 in TBS for 30 minutes at room temperature to block nonspecific protein binding; overnight at 4C in polyclonal antibodies to the markers at various dilutions (Table 1) in 0.05 M TBS, pH 7.4, containing 1% bovine serum albumin and 0.2% Tween 20 (BSA-T20-TBS); BSA-T20-TBS 3 times; goat anti-rabbit IgG conjugated to 15 or 10 nm gold particles (British BioCell, Cardiff, UK) diluted 1:20 in BSA-T20-TBS for 2 hours at room temperature; and TBS 3 times and distilled water 3 times (5 minutes each). For negative control, grids containing sections were incubated in BSA-T20-TBS without the primary antibody. The grids were stained in 2% aqueous uranyl acetate for 20 minutes and examined using a JEOL JEM 1230 transmission electron microscope (JEOL UK Ltd, Welwyn Garden City, UK) operated at 100 kV.
Table 1.
A Summary of the Marker Proteins and Primary Antibodies Used with Their Source and Catalog Number and Optimum Dilutions for Either Single (S) or Triple (T) Labeling
| Protein | Source of Antibody | Catalog Number | Dilution |
|---|---|---|---|
| S-100 | Sigma-Aldrich, Poole, UK | S 2644 | 1:100 (S); 1:25 (T) |
| α1-Na,K-ATPase | Abcam, Cambridge, UK | Ab33133 | 1:10 (S); 1:10 (T) |
| Caldesmon | Acris Antibodies GmbH, Herford, Germany | S 783 | 1:10 (S) |
| AQP1 | Millipore-Chemicon, Temecula, CA, USA | AB3272 | 1:50 (S); 1:50 (T) |
| CK-BB | Abcam, Cambridge, UK | Ab97546 | 1:10 (S) |
| CTGF | Cell Sciences, Canton, MA, USA | CPC100 | 1:10 (S); 1:100 (T) |
For triple labeling, the sequence of antibodies used was AQP1, Na,K-ATPase, and S-100, and the same labeling protocol described above was repeated for each antibody, but between protocols, grids were exposed to paraformaldehyde vapor at 60C for 1 hour. The primary antibody dilution was also decreased for the last repeated run: AQP1 at 1:50 and Na,K-ATPase at 1:10 as before and S-100 at 1:25. Gold label sizes were, respectively, 10 nm, 5 nm, and 15 nm. Uranyl acetate staining was performed only after the last labeling protocol.
Semiquantitative Analysis of Immunogold Labeling
To quantify the relative labeling density of the fibrocyte marker proteins in single labeling experiments, up to 10 micrographs (depending on the size of the area) were taken at random from the different fibrocyte areas containing the five types of fibrocytes, and the densities were measured. For each labeling type, the magnification was kept constant (AQP1 at ×40,000, caldesmon at ×30,000, S-100 at ×80,000, α1Na,K-ATPase at ×25,000, and CK-BB at ×48,000). A grid of equally spaced lines was placed over each micrograph, and the number of points on the cytoplasm (excluding mitochondria) of the fibrocytes was recorded to give a relative area measurement. Then, the number of gold particles within that area was counted to calculate the relative mean labeling density. For α1Na,K-ATPase, the number of lines crossing the plasma membrane (a relative measurement of length of membrane) on the cell body and processes were recorded separately, and the number of gold particles that were on the membranes were counted to calculate the ratio of mean labeling density (cell body/process). All five fibrocyte types were analyzed identically for each cochlea from all four animals. Statistical tests were performed on the data using the online statistical packages available at http://www.fon.hum.uva.nl/Service/Statistics/.
Results
Distribution of the Markers in Different Fibrocyte Types
We have here used antibodies to caldesmon and S-100, both of which are calcium-regulating proteins; AQP1 and α1Na,K-ATPase, which are membrane proteins involved in water regulation and sodium/potassium transport, respectively; CK-BB, a metabolic enzyme; and CTGF, a growth factor in extracellular matrix production and endothelial cell growth and migration. Caldesmon, S-100, CK-BB, and CTGF are thus primarily cytoplasmic proteins, while AQP1 and α1Na,K-ATPase labeling is likely to be primarily found on the cell membranes.
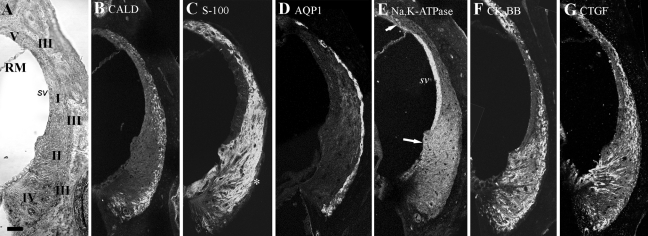
For orientation, a transmitted light microscopic image of a paraffin section showing the location of the different cell types is shown in Figure 1, together with confocal images of sections labeled with each of the six antibodies. Type I cells lie in the upper central ligament adjacent to the stria vascularis, type II cells lie below type I cells, type III cells line the boundary of the ligament with the bony outer covering of the cochlea, type IV cells lie below type II cells, and type V cells lie above the Reissner membrane. The caldesmon labeling is present in type III cells and a possible subset of type IV, and S-100 appears to label all cells, with the possible exception of type III. AQP1 is confined to type III cells. Na,K-ATPAse is strongest in type II and type V cells but weakly evident in other cells. CK-BB strongly labels type IV, II, III, and V cells, while CTGF labels especially type III and type IV regions and part of the type II region.
Figure 1.
Transmitted light (A) and immunofluorescence (B–G) microscopy of wax sections of spiral ligament in a midmodiolar plane, labeled with each of the antibodies and viewed by confocal microscopy. (A) The locations of the different fibrocyte types (I–V), the Reissner membrane (RM), and stria vascularis (sv) are shown. This section is the same as the one shown in B. (B) Caldesmon is localized along the side of the ligament adjacent to the bony wall, the location of the type III cells. (C) S-100 is localized throughout the ligament but appears to be absent from a thin line, probably representing the type III cell region (*). (D) AQP1 is localized along the margin of the ligament, where type III cells occur. The difference in appearance of the labeling compared with caldesmon, which localizes to the same region, is probably due to the fact that the AQP1 is a membrane protein while caldesmon is cytoplasmic. The former probably therefore outlines the cells rather than filling them. (E) Na,K-ATPase is localized to type II and type V regions (arrows) and is also strongly expressed in the stria vascularis (sv) but more weakly elsewhere. (F) CK-BB is localized to type II, III, IV, and V regions. (G) CTGF is localized to type II, III, and IV regions. Scale bar = 50 µm.
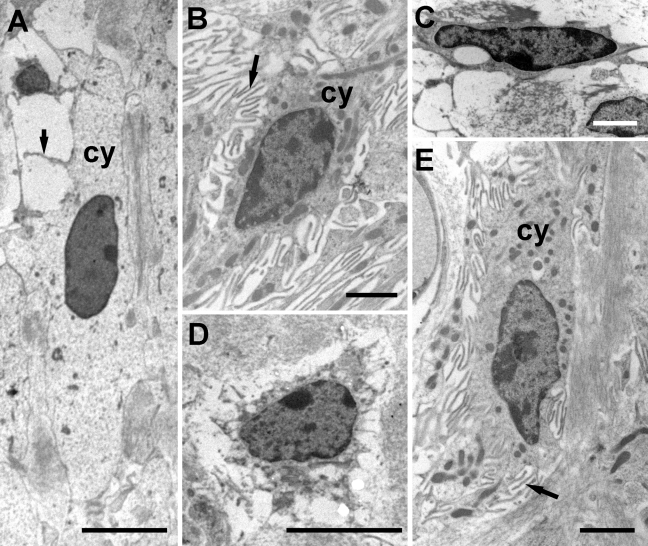
At the EM level, ultrastructural features can be used to identify cell types in addition to location (Figure 2). We here describe the main characteristics that have been used to distinguish them. Type I cells are elongated with a few fine processes, light cytoplasm, and relatively few cytoplasmic organelles (Figure 2A). Type II cells are less elongated, darker, with more cytoplasmic organelles, and many fine processes (Figure 2B). Type III cells are variably flattened with honeycomb-like processes and dense narrow cytoplasm (Figure 2C). Type IV cells are generally round and dense, sometimes more elongated, with a few fine processes and narrow cytoplasm (Figure 2D). Type V cells closely resemble type II cells with dark cytoplasm well populated with organelles and many fine and coarse processes (Figure 2E).
Figure 2.
Ultrastructural characteristics used to identify the different fibrocyte types. (A) Type I cells are elongated with thin, organelle-poor cytoplasm (cy) and a few fine processes (arrow). (B) Type II cells have dense cytoplasm (cy) containing many organelles and numerous fine processes (arrow). (C) Type III cells are variably shaped, often flattened, with dense, narrow cytoplasm and string-like processes. (D) Type IV cells are also variably rounded or elongated, with a number of fine processes, and thin cytoplasm. Type V cells strongly resemble type II cells, with the cytoplasm (cy) containing many organelles and multiple fine processes (arrow). Scale bars: A and C = 5 µm; B, D, and E = 2 µm.
On the basis of these identifying features and location in the ligament, immunogold labeling was evaluated in the different cell types for each of the six antibodies at the EM level. The caldesmon antibody failed to label adequately tissue embedded in LR White resin (Agar Scientific). We therefore employed Lowicryl HM20–embedded samples (Agar Scientific, Stansted, UK) for caldesmon labeling, where a moderate signal was obtained in some cells (see below). Thus, in the following descriptions and quantification of labeling, we were able to consistently use the same LR White–embedded samples (Agar Scientific) for S-100, AQP1, and α1Na,K-ATPase, but it was necessary to use a different set of mouse spiral ligaments embedded in Lowicryl HM20 (Agar Scientific, Stansted, UK) using freeze substitution for caldesmon. The CTGF antibodies failed to produce clear labeling of any cell type at the EM level and so are not reported in detail here. CK-BB was only analyzed at a preliminary level because it did not reveal any useful, specific cell type labeling at either LM or EM level.
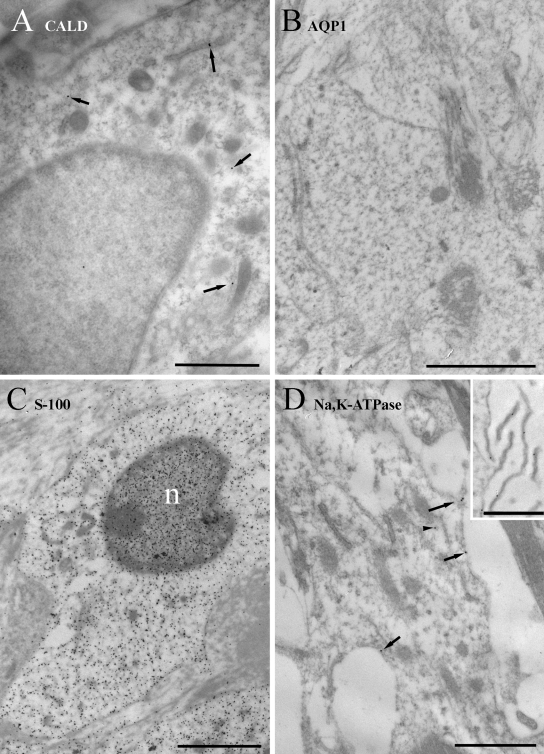
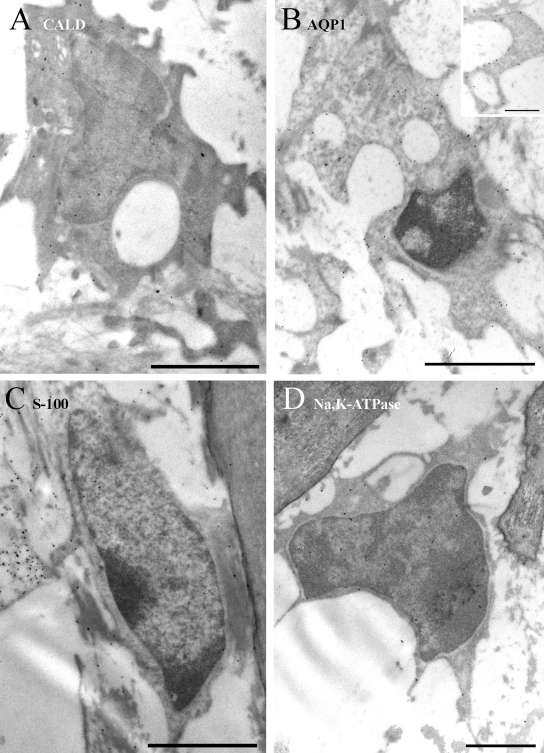
In type I fibrocytes (Figure 3), labeling for caldesmon was sparse and primarily cytoplasmic. It was occasionally noted in endoplasmic reticulum cisternae. Labeling for AQP1 was virtually absent from type I cells. Labeling for S-100, by contrast, was quite heavy. It was present in cytoplasm but less so in mitochondria. In the nucleus, nucleoplasmic labeling was denser than in the cytoplasm, while chromatin was sparsely labeled. Labeling for α1Na,K-ATPase was also quite sparse but consistently present on the few membrane processes that were occasionally observed and along the plasma membrane of the cell body.
Figure 3.
Immunogold labeling of type I cells. (A) Labeling for caldesmon (CALD) is sparse and primarily cytoplasmic (arrows). (B) Labeling for AQP1 is practically absent. (C) Labeling for S-100 is strong in the cytoplasm and stronger in the nucleus (n), while mitochondria and chromatin tend to have relatively few gold particles over them in comparison. (D) Labeling for α1Na,K-ATPase is weak but present on the plasma membrane and less commonly in the cytoplasm. It is enriched over the few fine processes that extend from these cells (inset). Scale bars: A, D, and D inset = 1 µm; B and C = 2 µm.
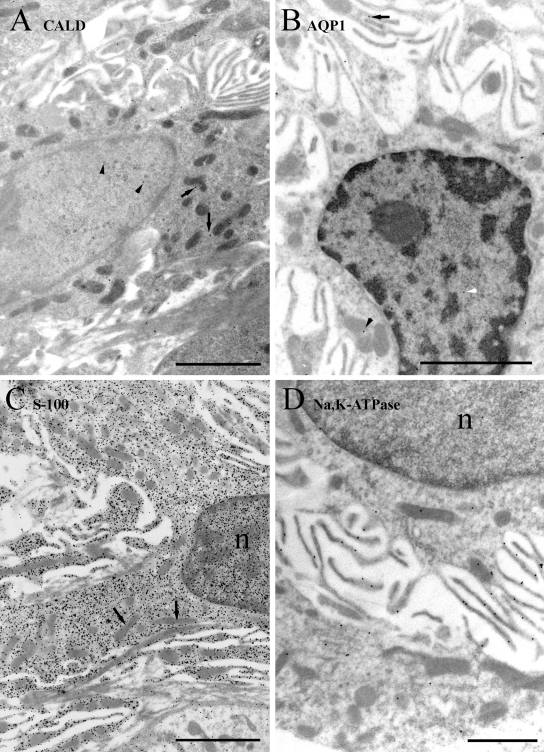
In type II fibrocytes (Figure 4), caldesmon labeling was sparse and present in the cytoplasm and nucleus to a similar degree. Labeling for AQP1 was weakly present on processes, which are abundant in these cells, nucleus, and cytoplasm. Strong labeling was detected for S-100, as for type I cells, in the cytoplasm and nuclei; the S-100 labeling extended into the processes, where it was probably located in the internal compartment rather than the membranes, although this is difficult to determine even with the resolution of EM. The nuclear labeling was obviously less dense than the cytoplasmic labeling than in type I cells. Again, both mitochondria and chromatin were more weakly labeled than the surrounding cytoplasm and nucleoplasm, respectively. Labeling for α1Na,K-ATPase along the membrane was moderate to strong over the fine processes but weaker around the cell body. Some labeling was also found in the cytoplasm.
Figure 4.
Immunogold labeling of type II cells. (A) Labeling for caldesmon (CALD) is sparse and both cytoplasmic (arrows) and nuclear (arrowheads). (B) Labeling for AQP1 is also sparse but present on the plasma membrane of the fine processes (arrows) and occasionally in the cytoplasm (arrowhead). (C) Labeling for S-100 is strong in the cytoplasm and stronger in the nucleus (n), while mitochondria (arrows) and chromatin have relatively few gold particles over them. Labeling is also present in the fine processes. (D) Labeling for α1Na,K-ATPase is moderate and specific mostly to the plasma membrane, especially the fine processes, and less commonly in the cytoplasm. Scale bars: A–C = 2 µm; D = 1 µm.
In type III fibrocytes (Figure 5), caldesmon labeling was moderate and present in both the cytoplasm and nucleus. There was little detectable membrane labeling. Labeling for AQP1 was moderate to strong and primarily present along the plasma membrane. Some weak cytoplasmic labeling was evident, and less densely still gold particles were seen in the nucleus. Labeling for S-100 was weakly present in both the nucleus and cytoplasm, often near the plasma membrane in the latter. The α1Na,K-ATPase labeling was weak to moderate in nuclei and cytoplasm, with a sparse amount of plasma membrane labeling.
Figure 5.
Immunogold labeling of type III cells. (A) Labeling for caldesmon (CALD) is moderate and present in both the cytoplasm and nucleus. (B) Labeling for AQP1 is also moderate but present primarily on membranes of the cell body and processes (inset) and occasionally in the cytoplasm (arrowhead). (C) Labeling for S-100 is weak in the cytoplasm and slightly stronger in the nucleus. (D) Labeling for α1Na,K-ATPase is weak to moderate and mostly in the cytoplasm, although with some plasma membrane labeling. Scale bars: A–C = 2 µm; B inset and D = 1 µm.
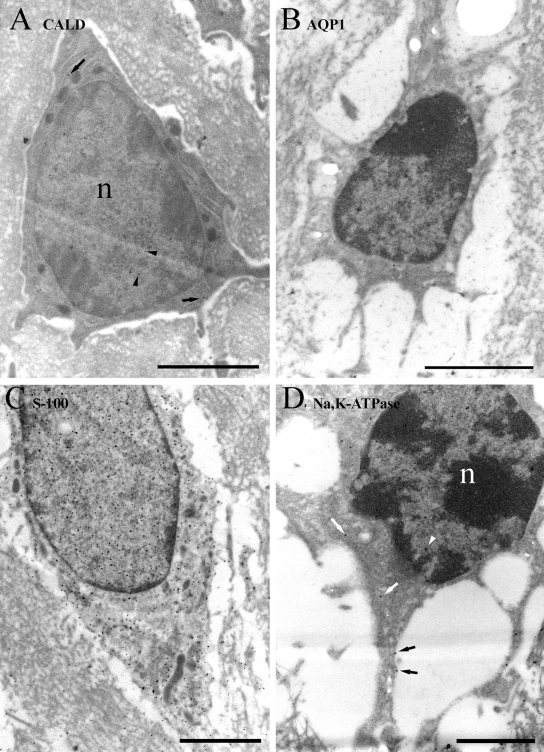
In type IV fibrocytes (Figure 6), caldesmon labeling, while weak, was most evident in the nucleus, with sparser cytoplasmic labeling. Labeling for AQP1 was very sparse and not notably specific to any structure. Labeling for S-100 was moderate to strong in the cytoplasm and nucleus, sparing mitochondria and chromatin as before. Labeling for α1Na,K-ATPase was weak but present in the nucleus, cytoplasm, and plasma membrane processes.
Figure 6.
Immunogold labeling of type IV cells. (A) Labeling for caldesmon (CALD) is weak and present in both the cytoplasm (arrows) and nucleus (arrowheads). (B) Labeling for AQP1 is virtually absent. (C) Labeling for S-100 is moderate to strong in the cytoplasm and slightly stronger in the nucleus. (D) Labeling for α1Na,K-ATPase is weak to moderate and in the cytoplasm (white arrows), nucleus (white arrowheads), and on the plasma membrane (black arrows). Scale bars = 2 µm.
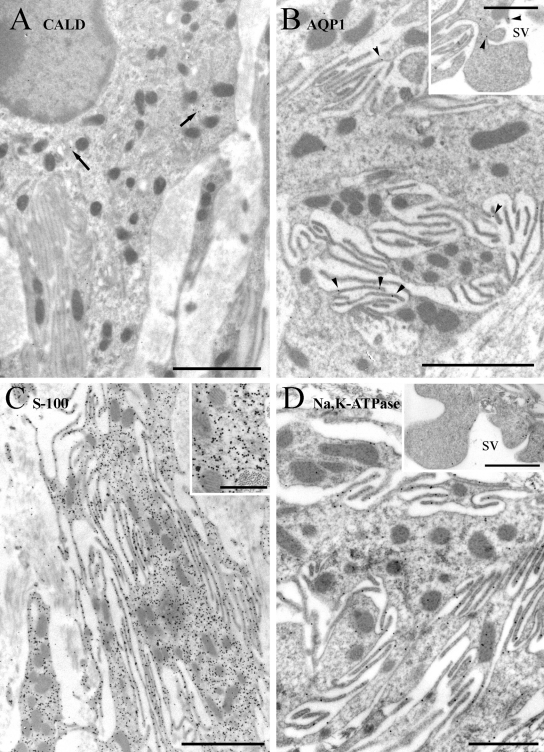
In type V fibrocytes (Figure 7), caldesmon labeling was sparse and mainly cytoplasmic. Labeling for AQP1 was weak but specific to the plasma membrane of the many fine processes that these cells have, including expanded processes that project into scala vestibuli. Labeling for S-100 was also strongly present in the cytoplasm, sparing mitochondria, and fine processes, and in nuclei, sparing chromatin (data not shown), as in the other cells. Labeling for α1Na,K-ATPase was weakly cytoplasmic and moderate to strongly present on the fine processes, presumably in the plasma membrane, as in type II cells, and also on the wider processes that extend into the scala vestibuli, as noted for AQP1.
Figure 7.
Immunogold labeling of type V cells. (A) Labeling for caldesmon (CALD) is weak and present mainly in the cytoplasm (arrows). (B) Labeling for AQP1 is weak to moderate and primarily on the membranes of fine processes near the cell body (arrowheads) and wider processes that extend into the scala vestibuli (sv) (inset). (C) Labeling for S-100 is moderate to strong in the cytoplasm of the cell body and fine processes, sparing the mitochondria (inset). (D) Labeling for α1Na,K-ATPase is moderate and primarily on the plasma membrane in both fine processes and the wider processes extending into scala vestibuli (sv) (inset). Scale bars: A–C = 2 µm; B inset, D, and D inset = 1 µm; C inset = 0.25 µm.
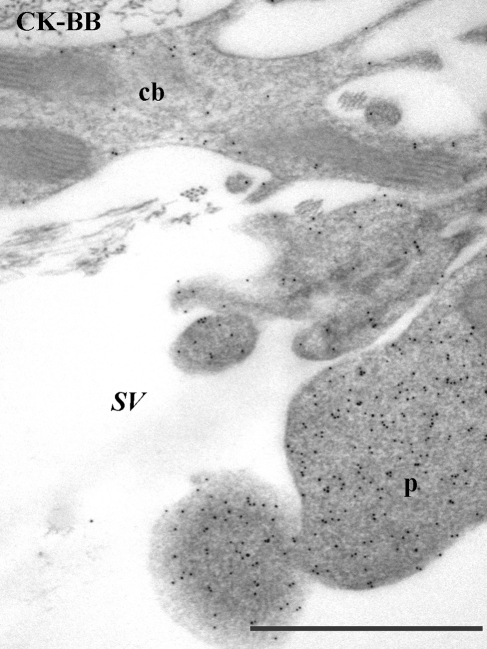
Labeling for CK-BB was found to be strongest in type II and type V cells (data not shown) but was distinctive in that, in type V cells, labeling was not evenly distributed throughout the cell but was more concentrated in the processes that extend out into the scala vestibuli (Figure 8).
Figure 8.
Labeling for CK-BB in type V fibrocytes. The labeling is weaker in the cell body (cb) than the processes (p), which extend out into the scala vestibuli (sv). Scale bar = 1 µm.
Semiquantitative Analysis of Labeling
To provide a more quantitative analysis of the distributions of labeling, the density of gold particles was assessed in each fibrocyte type. Because we cannot directly compare the amount of labeling between animals and preparations, one way to normalize the data is to calculate relative labeling across the different cell types for each marker and then pool the data from several animals (Furness et al. 2009). This is the mean contribution of the density of particles in each cell type as a proportion of the total (expressed as one). Hence, this is considered to be a semiquantitative analysis.
Four different mouse cochleae were analyzed for each antibody, and for AQP1, S-100, and α1Na,K-ATPase, the same samples were employed. For each antibody, one spiral ligament section was analyzed for all fibrocyte types and pictures taken at the same magnification for each marker so that the relative labeling density could be calculated. For caldesmon labeling, as noted above, additional spiral ligaments from four different mice were embedded in Lowicryl HM20.
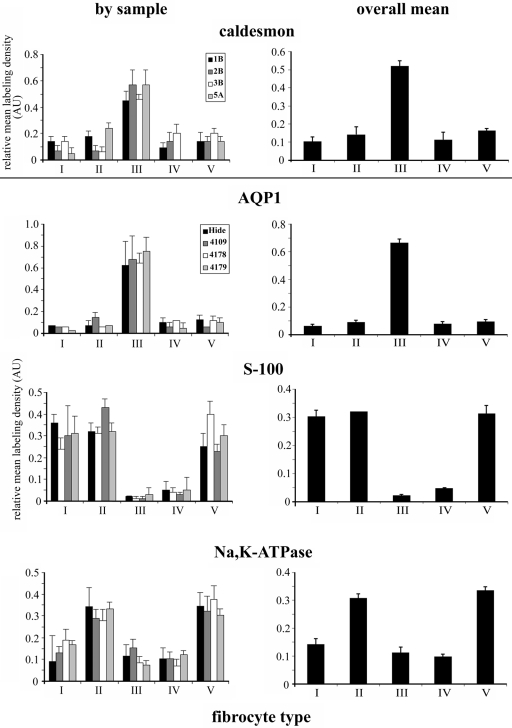
The relative labeling density in each cell type for each mouse with each antibody that worked at the EM level, except CK-BB, and the means across all the mice are shown in Figure 9. The relative labeling was very consistent across different samples and showed that caldesmon and AQP1 were significantly higher in type III fibrocytes than the others (ANOVA for the whole group followed by Wilcoxon signed-rank test for pairwise comparison; p<0.05), which were not significantly different. The caldesmon in type III was greater by about 3-fold and the AQP1 by at least 5- to 6-fold. S-100 was significantly higher in type I, II, and V fibrocytes (ANOVA followed by Wilcoxon signed-rank test; p<0.05), with 6- to 8-fold more than in type IV cells and virtually nonpresent in type III. The differences between types I, II, and V were not significant. Between type II and type V fibrocytes, the α1Na,K-ATPase labeling was not significantly different, but both were significantly higher, by 2- to 3-fold than all the other types (ANOVA followed by Wilcoxon signed-rank test; p<0.05). Because type III cells were labeled more strongly than other cells by AQP1 and caldesmon, with the former more effectively, it became apparent that AQP1 could replace caldesmon as a marker. The relative labeling density of CK-BB was similar to that of α1Na,K-ATPase (data not shown).
Figure 9.
Histograms showing the relative labeling density in fibrocytes from each sample (left) and the mean across all four samples (right) for caldesmon (above line) (samples 1B, 2B, 3B, and 5A), AQP1, S-100, and α1Na,K-ATPase (below line) (samples Hide, 4109, 4178, and 4179). Caldesmon and AQP1 are most highly expressed in type III fibrocytes, with the latter to a greater extent. S-100 is expressed to a similar extent in types I, II, and V and is only weakly present in types III and IV. α1Na,K-ATPase is expressed most strongly and to a similar degree in type II and type V fibrocytes and more weakly in types I, III, and IV. Bars = SEM.
Subcellular Distributions of Na,K-ATPase
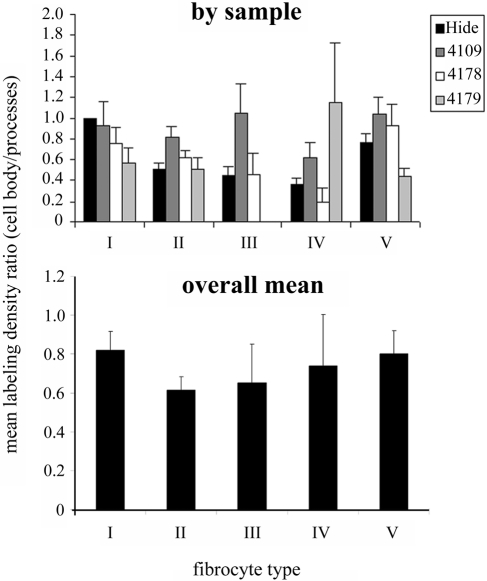
The qualitative observations suggested that, at least for some cell types, plasma membrane labeling with antibodies to α1Na,K-ATPase was greater on the fine processes than on the cell body. We therefore analyzed the density along the processes in comparisons with the cell body, expressed as the ratio of cell body density/process density (Figure 10). If there were no difference, the ratio would be one; if there were a higher density on the processes, it would be less than one. The pattern was less consistent than for the overall quantitative analyses described above, and the ratio was always close to one or less. This implies that there is a subcellular targeting of the α1Na,K-ATPase to the fine processes. In the cells expressing this protein highly, types I, II, and V, this is most evident in type II cells where the ratio was significantly less than one (Wilcoxon signed-rank test; p<0.05). In the other cell types, the ratios were not significantly different from one.
Figure 10.
Histograms showing the ratio of labeling density for α1Na,K-ATPase on the cell body to labeling density on fine processes for all types of fibrocytes in all samples (upper) and the mean across the four samples (lower). In nearly all samples and fibrocytes, the ratio is less than one, showing a tendency for α1Na,K-ATPase to be enriched on the plasma membrane of the fine processes rather than the cell body. From the mean values, this ratio is lowest for type II cells and highest for type I cells. Bars = SEM.
Relative Labeling within Each Type
Because different antibodies have different efficiencies of labeling (Furness et al. 2005), fully quantitative comparison between them would require the labeling to be calibrated against known protein concentrations (Hackney et al. 2003). Therefore, the absolute values of labeling density do not directly reflect differences in the amount of each protein between cells. Nevertheless, comparing the amount of labeling for each antibody within each type of fibrocyte provides a unique identifier that could be used to assess fibrocyte type in instances where a subset or even only one type may be present (e.g., cultures, or where degeneration has occurred, or where cells have been transplanted). Because caldesmon labeling effectively produced the same pattern as AQP1, and was not possible at the EM level on the same animals as the other markers, it has been omitted from this comparison, which is shown in Table 2 for two of the samples used. The ratio of markers (expressed as AQP1:α1Na,K-ATPase:S-100) is unique to each fibrocyte type, with the exception of type II and type V, which could be confused in this analysis as they differed between the two samples. Note also the labeling density was consistently lower in one sample than the other, suggesting differences in preservation of antigenicity. Thus, absolute values cannot be used, only ratios or relative values calibrated appropriately.
Table 2.
A Summary of the Comparative Labeling Densities for Three Markers
| Marker (Absolute Values) |
Single Labeling Ratio |
Triple Labeling Ratio |
|||||||
|---|---|---|---|---|---|---|---|---|---|
| Sample | AQP | Na,K-ATPase | S-100 | AQP:Na,K-ATPase:S-100 | AQP:Na,K-ATPase:S-100 | ||||
| 4109 | |||||||||
| I | 0.032 | 8.1 | 7.424 | 1 | 253 | 232 | 1 | 1.8 | 5.3 |
| II | 0.08 | 34 | 9.472 | 1 | 425 | 118 | 1 | 4.9 | 7.2 |
| III | 0.368 | 9 | 0.448 | 1 | 24 | 1 | 1 | 0.24 | 0.45 |
| IV | 0.032 | 3.8 | 1.184 | 1 | 119 | 37 | 1 | 0 | 0.3 |
| V | 0.032 | 28.7 | 12.512 | 1 | 897 | 391 | 1 | 1.4 | 2.6 |
| 4178 | |||||||||
| I | 0.016 | 5.7 | 5.792 | 1 | 356 | 362 | NA | NA | NA |
| II | 0.016 | 20.1 | 8.128 | 1 | 1256 | 508 | NA | NA | NA |
| III | 0.176 | 2 | 0.192 | 1 | 11 | 1 | NA | NA | NA |
| IV | 0.032 | 1.3 | 0.512 | 1 | 41 | 16 | NA | NA | NA |
| V | 0.032 | 17.83 | 4.448 | 1 | 557 | 139 | NA | NA | NA |
Note: The absolute values of labeling density (particle density in arbitrary units, adjusted for magnification) and the ratio of density of labeling per fibrocyte type for the three antibodies to AQP1, Na,K-ATPase, and S-100 are given for single labeling in two different animal samples (4109 and 4178) and equivalent ratios for triple-labeled sections of animal 4109. NA = not applicable.
Triple Labeling
The ratio method applied above could also be employed by labeling serial sections for each antibody individually or after triple labeling a single section. It is evident from Table 2 that labeling density in some samples can be greater than others; this presumably reflects differences in processing and preservation of antigenicity. We therefore chose to triple label sections from a sample with high labeling efficiency (4109). Because all the primary antibodies are raised in the rabbit, to ensure that there was no cross-labeling, the first and second procedures were each followed by exposure to paraformaldehyde vapor for 1 hour at 60C (Mahendrasingam et al. 2003). Paraformaldehyde vapor treatment for greater than 30 minutes at 80C eliminates cross-reactivity of the secondary antibodies to the primary species in ultrathin cryosections (Bastholm et al. 1987). We adapted this procedure slightly by reducing the temperature to minimize loss of antigenicity in the tissue while lengthening the procedure to ensure maximal reduction of cross-reactivity. However, the paraformaldehyde step itself reduces antigenicity with the second or third antibody; thus, antibodies in the second or third procedure following the paraformaldehyde step usually show reduced labeling. We therefore labeled sequentially for AQP1, α1Na,K-ATPase, and S-100 in order of increasing labeling strength when used individually. Finally, gold particle size also affects labeling efficiency, with higher labeling density produced by smaller particles in otherwise similar conditions. Because S-100 labels very strongly, we only partially applied this last criterion; we elected to use a larger particle size for S-100 (15 nm) than the others, even though it was the last antibody in the sequence. For AQP1, the first antibody, we used 10 nm gold, and for Na,K-ATPase, the second antibody, we used 5 nm gold to enhance its labeling relative to AQP1.
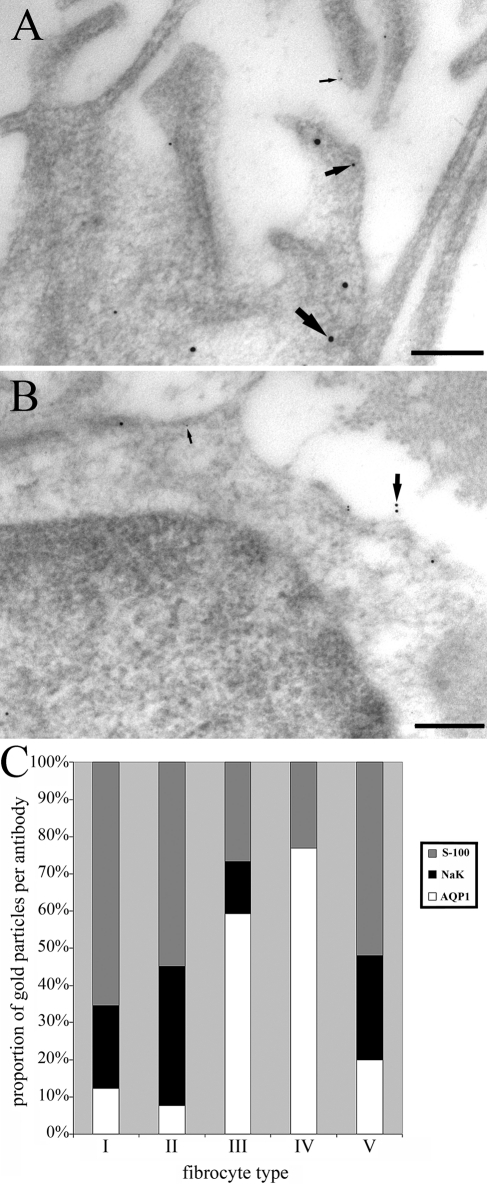
Examples of a type II cell (rich in Na,K-ATPase and S-100) and a type III cell (rich in AQP1) after triple labeling are shown for comparison in Figure 11. These cells came from the same section of spiral ligament, within a short distance of each other, and the labeling pattern is consistent with the individual labeling runs performed on all the other samples. The labeling density for AQP1 was high in type III and low in type II, while for S-100 and Na,K-ATPase, the opposite occurred as predicted from the individual runs. We took 10 random pictures of all five types of fibrocytes from the same section, including both apical and basal spiral ligament to ensure a sufficient sample size, and counted the number of gold particles of each size per cell (Figure 11). This showed the same pattern of relative labeling as seen in individual samples but gave a more equitable ratio than that obtained by comparing the actual labeling density across different sections because of the depression of labeling density for Na,K-ATPase and S-100 (Table 2). The patterns for each cell type were unique (Figure 11) but closest for type V and type II, as noted previously (Table 2), indicating there was little cross-reactivity. We conclude that triple labeling is an effective way to evaluate cell type in any given sample.
Figure 11.
Triple labeling for AQP1, Na,K-ATPase, and S-100. (A) In type II fibrocytes, labeling with all three markers is visible, as indicated by the large, intermediate, and small arrows indicating 15 nm (S-100), 10 nm (AQP1), and 5 nm (Na,KATPase) gold particles, respectively. (B) In type III fibrocytes, only the 10 nm and 5 nm particles are visible in this example because of the lower expression of S-100. Scale bars = 200 nm. (C) Histogram showing the relative amount of labeling for each antibody in the triple-labeled sample. Counts were conducted in 10 images of each fibrocyte type in one section and the proportion of each particle size displayed for each type. The patterns are unique for each type, but note that the most similar pattern is found between type II and type V fibrocytes, which are hard to distinguish.
Discussion
In this study, we have provided quantification of expression of several different possible fibrocyte marker proteins and obtained information on their subcellular localization. The calcium-cytoskeletal–regulating protein, caldesmon (Wang 2008), is present in the cytoplasm of all fibrocytes and sometimes in the nucleus but is strongest in type III cells. The water-transporting channel, AQP1 (Carbrey and Agre 2009), is associated with the plasma membranes, as would be expected, and also in cytoplasm. It is expressed in all cells but most strongly by a factor of about 6 times more in type III cells than any other. This implies that these cells have some function associated with water regulation. The protein S-100, a member of a family of intracellular and extracellular calcium-modulated signaling proteins (Donato 2001), is expressed in all the cells but is markedly more strongly present in types I, II, and V. Its pattern is primarily cytoplasmic, as might be expected, and it is also strongly present in the nucleus. The α1Na,K-ATPase, a sodium potassium pump (Jorgensen 1985), is primarily membrane associated; moderate in types I, III, and IV; and high in type II and type V cells. The qualitative data, however, indicate that there is also cytoplasmic labeling, which may be indicative of high turnover, and this cytoplasmic labeling is more evident than in the membrane in type III cells. This raises the possibility that type III cells could be recruited to express this protein functionally if, for example, other fibrocytes degenerate, as can happen in some mouse models (Wu and Marcus 2003; Mahendrasingam et al. 2011). The enzyme, CK-BB, is cytoplasmic, involved in energetic/metabolic processes (Wallimann et al. 1992), and follows a similar distribution pattern, in terms of relative labeling density, to Na,K-ATPase. Interestingly, like Na,K-ATPase, this labeling was denser in the processes than the cell body in type V cells. The significance of this is unclear.
The data presented here show that antibodies used to these five marker proteins will distinguish between all of the types of fibrocytes, except between type II and type V fibrocytes. By looking across all the fibrocyte types, type III can be distinguished from all of the others by strong cytoplasmic labeling for caldesmon or membrane labeling for AQP1. When coupled with S-100 labeling, which is strongly cytoplasmic in types I, II, and V, type IV can be distinguished because it does not label strongly for any of these proteins. Type I can be distinguished from types II and V by its weaker α1Na,K-ATPase labeling, which is similar to that of type III and IV fibrocytes. In fact, the caldesmon antibodies are less useful at the EM level because AQP1 labeling produces an even stronger distinction between type III and other fibrocytes; given that a different embedding procedure is needed for caldesmon labeling, at least with the antibodies used here, this simplifies the characterization, requiring only LR White (Agar Scientific) embedding. Thus, labeling with AQP1, S-100, and α1Na,K-ATPase will be as effective as with all four antibodies, although caldesmon is still useful at the LM level.
In some respects, these results differ from those of other studies. For example, Qu et al. (2007) suggested that type V fibrocytes have a lower expression of Na,K-ATPase than type II; our data suggest that these two cell types have a similar profile of all the markers tested and are also similar for the glutamate transporter GLAST (Furness et al. 2009). In fact, their morphological similarity and their protein expression suggest that these cells are probably functionally very similar and differ primarily in their location. Other markers are also possible; connective tissue growth factor (CTGF), a possible marker for type IV fibrocytes, according to Adams (2009), also labeled other cell types in our immunofluorescence and failed to label well at the EM level (unpublished observations), so it has not been reported quantitatively here. Another alternative for type IV cells, transforming growth factor β (Adams 2009), might also be a useful indicator, but we have not used it here, as distinguishing type IV cells is achievable with the antibodies we have used. The major difficulty we have encountered is distinguishing type II from type V cells.
In addition to providing good quantification of the labeling, another advantage of the EM technique for characterizing the protein expression in fibrocytes is that it allows better subcellular localization. To illustrate this, we tested a prediction, based on the qualitative observations, that plasma membrane labeling of α1Na,K-ATPase was denser on the fine processes than on the membrane around the cell bodies. This was quantified and showed a significant difference between the two in all fibrocyte types in nearly all samples. The difference was most evident in type II cells, which may allow them to be distinguished from type V fibrocytes, which otherwise do not differ from type II.
To apply this technique to characterize native fibrocytes or cells that have been transplanted where multiple comparisons between different types are possible is relatively straightforward, by labeling with the three antibodies, AQP1, α1Na,K-ATPase, and S-100 on different sections. Application of the method in situations where only one or two cell types are present, however, would be more challenging. This would be the case, for instance, in cultures that may contain only one type or where some fibrocytes have degenerated such as in the aging cochlea (Mahendrasingam et al. 2011) or where cells have been transplanted and no native cells are present. Here, the best way may be to look at the ratio of labeling between the different antibodies on a single cell. Although this labeling could be performed on serial sections through a cell, each incubated in a separate antibody, triple labeling on a single section is also a good way to provide this information. When this was performed on our material, ratios of absolute values of labeling density for AQP1, α1Na,K-ATPase, and S-100 profiles could be obtained from both different sections or from triple labeling of a single section that distinguished all except type II and V cells.
In cultures or sections of the lateral wall, triple labeling at the LM level with three antibodies on the same cells—caldesmon or AQP1, S-100, and α1Na,K-ATPase—while it is not quantitative to the same extent as EM, may provide sufficient information to identify cell type. However, culture cells, like the lateral wall, can also be embedded and sectioned for EM (Qu et al. 2007), so in principle, triple labeling or labeling on serial sections with immunogold could also be performed to assess the relative amount of protein expression. In the latter case, the labeling could be simultaneously calibrated by labeling sections of native spiral ligament containing all fibrocyte types from tissue fixed and embedded at the same time as the culture samples, using the same protocol. With these refinements, application of this approach should be invaluable in identifying fibrocyte types in culture or after cellular transplantation. A combination of these techniques as appropriate would give reliable identification of the different fibrocyte types.
Footnotes
The author(s) declared no potential conflicts of interest with respect to the authorship and publication of this article.
The authors disclosed receipt of the following financial support for the research and/or authorship of this article: This work was supported by Deafness Research UK, The Grand Charity, and the Henry Smith Charity.
Literature Cited
- Adams JC. 2009. Immunocytochemical traits of type IV fibrocytes and their possible relations to cochlear function and pathology. J Assoc Res Otolaryngol. 10:369–382 [DOI] [PMC free article] [PubMed] [Google Scholar]
- Bastholm L, Nielsen MH, Larsson LI. 1987. Simultaneous demonstration of two antigens in ultrathin cryosections by a novel application of an immunogold staining method using primary antibodies from the same species. Histochemistry. 87:229–231 [DOI] [PubMed] [Google Scholar]
- Carbrey JM, Agre P. 2009. Discovery of the aquaporins and development of the field. Handb Exp Pharmacol. 190:3–28 [DOI] [PubMed] [Google Scholar]
- Donato R. 2001. S100: a multigenic family of calcium-modulated proteins of the EF-hand type with intracellular and extracellular functional roles. Int J Biochem Cell Biol. 33:637–668 [DOI] [PubMed] [Google Scholar]
- Furness DN, Katori Y, Mahendrasingam S, Hackney CM. 2005. Differential distribution of beta- and gamma-actin in guinea-pig cochlear sensory and supporting cells. Hear Res. 207:22–34 [DOI] [PubMed] [Google Scholar]
- Furness DN, Lawton DM, Mahendrasingam S, Hodierne L, Jagger DJ. 2009. Quantitative analysis of the expression of the glutamate-aspartate transporter and identification of functional glutamate uptake reveal a role for cochlear fibrocytes in glutamate homeostasis. Neuroscience. 162:1307–1321 [DOI] [PubMed] [Google Scholar]
- Furness DN, Lehre KP. 1997. Immunocytochemical localization of a high-affinity glutamate-aspartate transporter, GLAST, in the rat and guinea-pig cochlea. Eur J Neurosci. 9:1961–1969 [DOI] [PubMed] [Google Scholar]
- Gratton MA, Schulte BA, Hazen-Martin DJ. 1996. Characterization and development of an inner ear type I fibrocyte cell culture. Hear Res. 99:71–78 [DOI] [PubMed] [Google Scholar]
- Hackney CM, Mahendrasingam S, Jones EM, Fettiplace R. 2003. The distribution of calcium buffering proteins in the turtle cochlea. J Neurosci. 23:4577–4589 [DOI] [PMC free article] [PubMed] [Google Scholar]
- Hirose K, Liberman MC. 2003. Lateral wall histopathology and endocochlear potential in the noise-damaged mouse cochlea. JARO. 4:339–352 [DOI] [PMC free article] [PubMed] [Google Scholar]
- Jørgensen PL. 1985. Molecular basis for active Na,K-transport by Na,K-ATPase from outer renal medulla. Biochem Soc Symp. 50:59–79 [PubMed] [Google Scholar]
- Kamiya K, Fujinami Y, Hoya N, Okamoto Y, Kouike H, Komatsuzaki R, Kusano R, Nakagawa S, Satoh H, Fujii M, Matsunaga T. 2007. Mesenchymal stem cell transplantation accelerates hearing recovery through the repair of injured cochlear fibrocytes. Am J Pathol. 171:214–226 [DOI] [PMC free article] [PubMed] [Google Scholar]
- Mahendrasingam S, Macdonald JA, Furness DN. 2011. Relative time course of degeneration of different cochlear structures in the CD/1 mouse model of accelerated aging. J Assoc Res Otolaryngol. 12:437–453 [DOI] [PMC free article] [PubMed] [Google Scholar]
- Mahendrasingam S, Wallam CA, Hackney CM. 2003. Two approaches to double post-embedding immunogold labeling of freeze-substituted tissue embedded in low temperature Lowicryl HM20 resin. Brain Res Brain Res Protoc. 11:134–141 [DOI] [PubMed] [Google Scholar]
- Minowa O, Ikeda K, Sugitani Y, Oshima T, Nakai S, Katori Y, Suzuki M, Furukawa M, Kawase T, Zheng Y, et al. 1999. Altered cochlear fibrocytes in a mouse model of DFN3 nonsyndromic deafness. Science. 285:1408–1411 [DOI] [PubMed] [Google Scholar]
- Miyabe Y, Kikuchi T, Kobayashi T. 2002. Comparative immunohistochemical localizations of aquaporin-1 and aquaporin-4 in the cochleae of three different species of rodents. Tohoku J Exp Med. 196:247–257 [DOI] [PubMed] [Google Scholar]
- Mutai H, Nagashima R, Fujii M, Matsunaga T. 2009. Mitotic activity and specification of fibrocyte subtypes in the developing rat cochlear lateral wall. Neuroscience. 163(4):1255–1263 [DOI] [PubMed] [Google Scholar]
- Nakazawa K, Spicer SS, Schulte BA. 1995. Ultrastructural localization of Na,K-ATPase in the gerbil cochlea. J Histochem Cytochem. 43:981–991 [DOI] [PubMed] [Google Scholar]
- Qu C, Liang F, Smythe NM, Schulte BA. 2007. Identification of ClC-2 and CIC-K2 chloride channels in cultured rat type IV spiral ligament fibrocytes. J Assoc Res Otolaryngol. 8:205–219 [DOI] [PMC free article] [PubMed] [Google Scholar]
- Spicer SS, Schulte BA. 1991. Differentiation of inner ear fibrocytes according to their ion transport related activity. Hear Res. 56:53–64 [DOI] [PubMed] [Google Scholar]
- Suko T, Ichimiya I, Yoshida K, Suzuki M, Mogi G. 2000. Classification and culture of spiral ligament fibrocytes from mice. Hear Res. 140:137–144 [DOI] [PubMed] [Google Scholar]
- Wallimann T, Wyss M, Brdiczka D, Nicolay K, Eppenberger HM. 1992. Intracellular compartmentation, structure and function of creatine kinase isoenzymes in tissues with high and fluctuating energy demands: the ‘phosphocreatine circuit’ for cellular energy homeostasis. Biochem J. 281:21–40 [DOI] [PMC free article] [PubMed] [Google Scholar]
- Wang CL. 2008. Caldesmon and the regulation of cytoskeletal functions. Adv Exp Med Biol. 644:250–272 [DOI] [PMC free article] [PubMed] [Google Scholar]
- Wangemann P. 2006. Supporting sensory transduction: cochlear fluid homeostasis and the endocochlear potential. J Physiol. 576:11–21 [DOI] [PMC free article] [PubMed] [Google Scholar]
- Wu T, Marcus DC. 2003. Age-related changes in cochlear endolymphatic potassium and potential in CD/1 and CBA/CaJ mice. J Assoc Res Otolaryngol. 4:353–362 [DOI] [PMC free article] [PubMed] [Google Scholar]


