
Figure 2. GABA release onto DPO neurons is unusually frequency-dependent and this characteristic is not developmentally restricted.
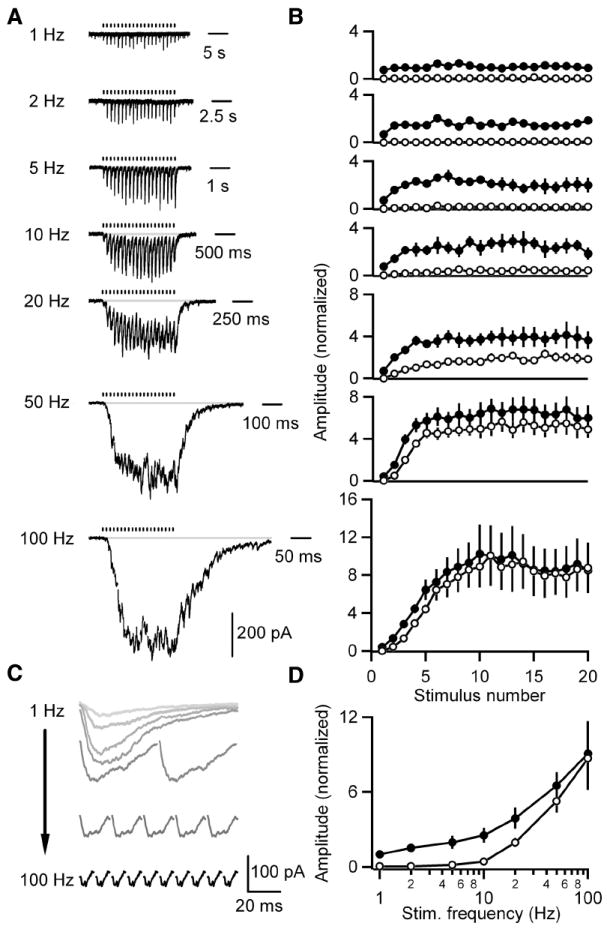
A-D, IPSCs evoked by 1, 2, 5, 10, 20, 50 or 100 Hz trains of 20 stimuli were recorded from DPO neurons in slices from P23-25 rats. T-type calcium and Ih currents were pharmacologically blocked to prevent subthreshold membrane potential oscillations from obscuring IPSCs. A, Representative averaged traces of currents recorded from a DPO cell are shown. Tick marks indicate stimulation times. B, Summary plots of the peak (closed circles) and baseline (open circles) currents for each stimulus normalized to the average peak for 1 Hz stimulation (n = 5 cells) are shown. C, Representative traces of the average evoked IPSC following each of the last ten stimuli from the cell in A are shown. D, A summary plot of the average peak (closed circles) and average baseline (open circles) of the last ten stimuli in the train at each frequency for cells in B. Data are means ± SEM.