
Figure 4. GABA release is further slowed during >5 Hz trains.
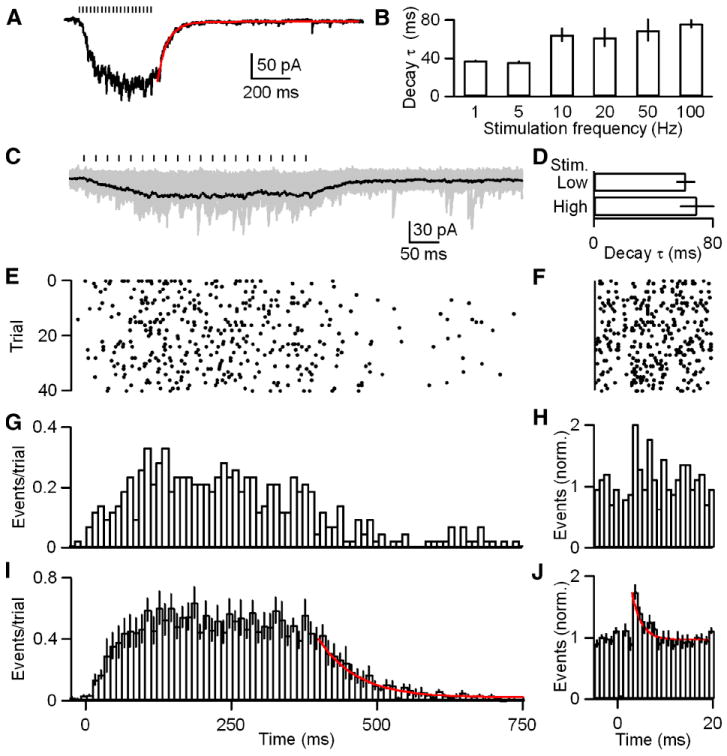
A-B, IPSCs were evoked with trains of 20 stimuli at 1, 5, 10, 20, 50 and 100 Hz. A, Representative averaged trace of 50 Hz trials is provided with an exponential fit to the decay (red; τ decay = 53 ms). B, A bar plot of the decay τ for 1, 5, 10, 20, 50 and 100 Hz trains is shown (n = 5 cells). C-J, IPSCs were evoked with trains of 20 stimuli at 50 Hz. C, Raw traces from a representative cell are shown (gray) with their average (black). Stimulus intensity was adjusted to allow identification of unitary events. Tick marks indicate stimulation times. D, A bar plot of the decay τ for low- and high-intensity stimulation with 50 Hz trains. E, A raster of the event times for the data in C. F, A raster of event times for quanta released during the interstimulus interval for the last ten stimuli during each trial in E (bin widths = 1 ms). G, A histogram of the events per trial for the data in E (bin width = 10 ms). H, A histogram of the event times for F. I, A summary histogram of experiments (n = 6 cells) as performed in C with an exponential fit to the decay (red; τ decay = 65 ms). J, A summary histogram of event times during the interstimulus interval for the last ten stimuli during each trial as in H for the data in I. An exponential fit to the decay (red; τ decay = 2 ms) is provided. Data are means ± SEM.