Pre-mRNA structure impacts many cellular processes, including splicing in genes associated with disease. The contemporary paradigm of RNA structure prediction is biased toward secondary structures that occur within short ranges of pre-mRNA, although long-range base-pairings are known to be at least as important. Here, using an enhanced method that detects base-pairings at all possible combinations of splice sites within each gene, the authors report RNA structures that could be involved in the regulation of splicing in mammals. Statistically, they demonstrate strong association between the occurrence of conserved RNA structures and alternative splicing, where local RNA structures are generally more frequent at alternative donor splice sites, while long-range structures are more associated with weak alternative acceptor splice sites. Their results suggest that previous genome-wide screens uncovered only a fraction of RNA structures associated with splicing and that, even by modest estimates, there must be thousands of such potentially regulatory structures conserved throughout the evolutionary history of mammals.
Keywords: RNA secondary structure, looping-out, long-range, alternative splicing, SF1, HNRNPK, ZFX, ZIP7, SLC39A7, ZNF384, SRSF7, PRPF39
Abstract
Pre-mRNA structure impacts many cellular processes, including splicing in genes associated with disease. The contemporary paradigm of RNA structure prediction is biased toward secondary structures that occur within short ranges of pre-mRNA, although long-range base-pairings are known to be at least as important. Recently, we developed an efficient method for detecting conserved RNA structures on the genome-wide scale, one that does not require multiple sequence alignments and works equally well for the detection of local and long-range base-pairings. Using an enhanced method that detects base-pairings at all possible combinations of splice sites within each gene, we now report RNA structures that could be involved in the regulation of splicing in mammals. Statistically, we demonstrate strong association between the occurrence of conserved RNA structures and alternative splicing, where local RNA structures are generally more frequent at alternative donor splice sites, while long-range structures are more associated with weak alternative acceptor splice sites. As an example, we validated the RNA structure in the human SF1 gene using minigenes in the HEK293 cell line. Point mutations that disrupted the base-pairing of two complementary boxes between exons 9 and 10 of this gene altered the splicing pattern, while the compensatory mutations that reestablished the base-pairing reverted splicing to that of the wild-type. There is statistical evidence for a Dscam-like class of mammalian genes, in which mutually exclusive RNA structures control mutually exclusive alternative splicing. In sum, we propose that long-range base-pairings carry an important, yet unconsidered part of the splicing code, and that, even by modest estimates, there must be thousands of such potentially regulatory structures conserved throughout the evolutionary history of mammals.
INTRODUCTION
One of the major difficulties in predicting the outcome of pre-mRNA splicing is that the primary cis-acting elements (donor and acceptor splice sites, branch point, and polypyrimidine tract) per se provide insufficient information for intron detection (Wang and Burge 2008). Additional instructions for the splicing machinery are encoded in other cis-elements such as splicing enhancers or silencers, which recruit trans-acting protein factors to execute the program of splicing (Smith and Valcarcel 2000). Different tissues at different developmental stages contain different sets of such trans-factors, resulting in alternative splicing pathways, while the set of cis-elements in the transcript remains unchanged (Pistoni et al. 2010). Since the discovery of introns in 1977, it has been discussed to what extent the pre-mRNA secondary structure in cis-regulatory regions affects splicing (Solnick 1985; Balvay et al. 1993; Buratti and Baralle 2004; Warf and Berglund 2010); however, the cases when interactions of cis-acting elements with each other play a more substantial role than do their interactions with trans-factors are believed to be rare or exceptional. Here we revisit this discussion and demonstrate that secondary structure-based mechanisms of splicing could actually be more widespread than it is assumed currently.
To date, only a few sporadic cases of RNA secondary structures that influence pre-mRNA splicing have been documented (for review, see Buratti and Baralle 2004; Warf and Berglund 2010). In spite of low abundance, these structures are found in many diverse organisms, including yeast, plants, flies, and vertebrates, and have been increasingly reported as being involved in human pathogenic states such as muscular dystrophy, neurofibromatosis, cystic fibrosis, spinal muscular atrophy, fronto-temporal dementia, and parkinsonism (Matsuo et al. 1992; Grover et al. 1999; Kaufmann et al. 2002; Hefferon et al. 2004; Singh et al. 2007). Two major groups of functional mechanisms, by which RNA structure can affect splicing, have been proposed (Buratti and Baralle 2004). The first mechanism assumes occlusion or exposure of primary cis-acting elements, i.e., modulation of their accessibility to splicing factors. This appears to be the case, for instance, in the human tau gene, where a hairpin structure interferes with the recognition of the donor splice site (Grover et al. 1999), or in the fruit fly Adh gene, where a stem structure indirectly promotes the use of a branch point by keeping it in single-stranded conformation (Chen and Stephan 2003). The second mechanism is indirect and has to do with structure-mediated changes in spatial positioning of cis-acting elements with respect to each other. Examples include the chicken β-tropomyosin gene (Sirand-Pugnet et al. 1995) and the human dystrophin gene (Matsuo et al. 1992); in both cases the RNA structure forms a loop that incites the splicing machinery to remove the intron. The effect of looping-out can be explained mechanistically by the hindrance of splice sites that are enclosed in a loop and/or by spatial approximation of distant cis-acting elements (Nasim et al. 2002). An extreme example of splicing by the looping-out mechanism is the Dscam gene, where competing RNA structures regulate alternative splicing of as many as 48 mutually exclusive exons (May et al. 2011).
Recently, we performed a large-scale search and reported a set of ∼200 highly conserved RNA secondary structures in introns of Drosophila genes (Raker et al. 2009). The computational strategy was to search directly for long stretches of complementary nucleotides (seeds) in intronic sequences surrounding splice sites, select evolutionarily conserved sequences, and extend them to larger complementary regions called boxes. Technically, it was achieved by using hash tables that establish the correspondence between seeds and sequences in which they were found. The advantages of this approach compared to the methods used in other studies are that (1) it does not require multiple sequence alignments as an input, and (2) it works equally well for the detection of local and long-range base-pairing interactions.
In this work we proceed with this technique in several directions. First, besides fruit flies we also explore other taxonomic groups and predict functional and evolutionarily conserved RNA structures that could be involved in splicing regulation in placental mammals. We estimate that splicing of thousands of mammalian genes is dependent on RNA structures, including ones which act over long ranges. Second, we modified the original approach to look for complementary seeds in arbitrary combinations of sequences surrounding splice sites within each gene. Compared to the procedure in Raker et al. (2009), which was confined to short windows around the ends of annotated introns, the current approach allows for detection of RNA structures located at arbitrary combinations of donor and acceptor splice sites, some of which do not correspond to any annotated splicing event That is, we not only obtained candidate RNA structures that could be responsible for splicing of known introns but also predicted novel splicing events based on the presence and positioning of the predicted RNA structures. To account for a relatively high false positive rate (from 25% to 45%), we rank the predicted RNA structures by computing individual P-values. Box pairs are classified based on their location with respect to splice sites, and a representative RNA structure is provided for each class. Some genes contained only one pair of complementary boxes (for instance, ZFX, X-linked zinc finger gene, HNRNPK, heterogeneous nuclear ribonucleoprotein gene, ZNF384, CAS-interacting zinc finger protein, SRSF7, SR-rich splicing factor, and PRPF39, pre-mRNA-processing factor), while others contained two or even more box pairs (SF1, Splicing Factor 1, and Slc39a7, zinc transporter). Interestingly, many of these genes are splicing factors. As an illustration, we tested one of the predicted structures experimentally using minigenes in human HEK293 cells. Point mutations introduced into the complementary boxes found in the intron between exons 9 and 10 of the human SF1 gene to disrupt the base-pairing between these boxes also changed the splice site choice so that a stronger acceptor site 21 nt downstream from the endogenous acceptor site of exon 10 was used instead. The compensatory mutations which changed box sequences but reestablished their base-pairing also restored the wild-type splicing. In spite of a relatively high false positive rate, we argue that many of the predicted RNA structures could be involved in splicing regulation and reserve their experimental validation to the future work.
RESULTS
Classification of box pairs
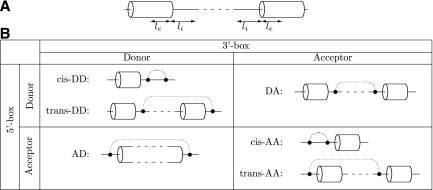
Our main postulate is that a pair of complementary boxes is associated with splicing if they are located within short windows around splice sites. The windows are not symmetric and consist of le nucleotides of the exonic part and li nucleotides of the intronic part of the sequence (Fig. 1A). As will be explained below, we keep le = 0 to reduce the false positive rate, but extending the window into the exon still remains an option. The RefSeq database was used to retrieve primary information about splice sites in humans; the candidate orthologs of splice sites were found by using pairwise genome sequence alignments (see Materials and Methods). In what follows, by a splice site we assume a human donor or acceptor splice site (according to the RefSeq annotation) which has sufficiently many orthologs in other mammals.
FIGURE 1.
(A) Sequence windows surrounding donor and acceptor splice sites, le nucleotides within exon, and li nucleotides within intron. (B) Arrangements of complementary boxes. Each of the two complementary boxes (5′-box and 3′-box) can be located either at donor or at acceptor splice site. If both 5′- and 3′-box (filled circles) are located at the same splice site (different splice sites), the corresponding structure is referred to as cis-structure (trans-structure, respectively). There is no limit on the distance between boxes. Complementary boxes are denoted by dotted arcs. The two-letter code denotes the location of boxes so that, for instance, DA stands for Donor-Acceptor location of 5′- and 3′-boxes (in this order).
Since each of the two complementary boxes can be located either in a neighborhood of a donor splice site or in a neighborhood of an acceptor splice site, there are four possible arrangements of box pairs (Fig. 1B). In what follows, they are abbreviated as DD, DA, AD, and AA, with the first letter referring to the splice site of the 5′-box and the second letter referring to that of the 3′-box. Additionally, in the DD and AA arrangements, the two boxes can be located either at the same splice site, forming a local stem–loop structure, or at two different splice sites (both donors or both acceptors) with base-pairings spanning over longer ranges. These two options are referred to as cis- and trans-arrangements, respectively (Fig. 1B).
Control procedure
The classic control procedure for the evaluation of significance of predicted RNA structures is to repeat the same search protocol for shuffled nucleotide sequences (Babak et al. 2007). However, this approach has fundamental problems when applied to the seed search because the nucleotide shuffling is to be done concordantly in all species, thus involving the construction of multiple sequence alignments as a necessary step. Even if nucleotide sequences were aligned, the shuffling procedure would need to preserve dinucleotide frequencies in order to model the random context for generating RNA structures (Babak et al. 2007). For single sequences this is achieved by using Markov models, while for multiple sequences more sophisticated models are required (Gesell and Washietl 2008). In the previous work, we used a so-called rewiring procedure, in which donor and acceptor splice sites were taken at random from different genes and matched to create a hybrid set of donor-acceptor pairs not corresponding to any existing intron (Raker et al. 2009). Here we used a similar strategy in which we randomly picked a pair of splice sites from different genes and exchanged their surrounding sequence windows simultaneously in all species for orthologous splice sites (see Materials and Methods). The exchange was done repeatedly and resulted in a set of quasi-genes, each consisting of noncognate sequence windows drawn from different genes but still equivalent to the original genes in terms of their splicing pattern (splicing annotation did not change).
Since the occurrence of complementary boxes is confounded with nucleotide composition and sequence conservation, the control procedure was used in combination with additional restrictions on the elementary sequence exchange act. The requirement that only sequences with similar GC-content can be exchanged was introduced to account for different probabilities of forming RNA structures in AT- and GC-rich contexts. We also had to account for the fact that it is less unlikely to observe conserved complementary boxes in the nucleotide context with a high overall conservation rate, and thus, we introduced the additional requirement of exchanging sequences that were similar by both GC-content and nucleotide conservation rate.
The rewiring procedure does not make sense for cis-structures because the sequences around splice sites remain unchanged and, therefore, the number of complementary box pairs in cis-AA and cis-DD arrangements after rewiring must be exactly the same as the number of box pairs in the original set. To estimate the rate of false positive predictions for the RNA structures in the cis-arrangement, a procedure that involved shuffling columns of multiple sequence alignments was used instead. The degree at which column shuffling changes dinucleotide frequencies was used as a predictor for the number of complementary box pairs and allowed for estimation of the false discovery rate from a linear model (see Materials and Methods).
Predictions and false positive rate
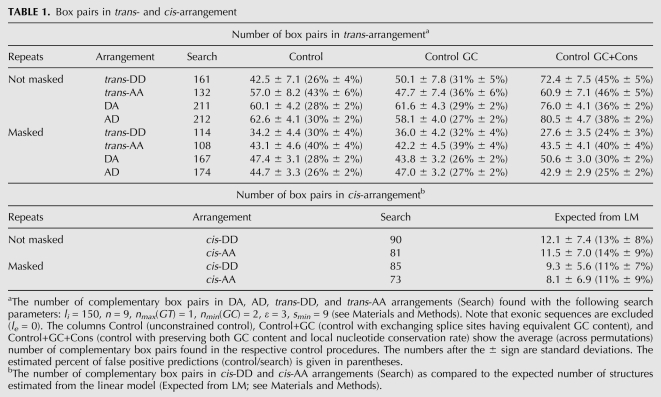
First we compared the number of complementary box pairs found in windows around splice sites of mammalian genes to the number of box pairs found in control sets (summary statistics in upper part of Table 1; the complete list of predictions is in Supplemental Table S1). Jointly for trans- and cis-arrangements, the total of 888 box pairs were found by using 9-nt seeds with at most one GT base pair and at least two GC base pairs (see Materials and Methods); the average box length and equilibrium free energy were 9.50 ± 0.96 nt and −17.22 ± 4.46 kcal, respectively. In each of the four arrangements, DA, AD, trans-DD, and trans-AA, the upper estimate for the false positive prediction rate varied between 26% and 46%, generally increasing with tightening the control procedure constraints. These figures are significantly higher compared to ones in our previous study (Raker et al. 2009), where the false positive rate was below 10% (because fruit flies are more evolutionarily divergent than mammals), but still are acceptable compared to the estimates reported in other full-genome studies related to RNA structure analysis (Rose et al. 2007).
TABLE 1.
Box pairs in trans- and cis-arrangement
Repeating the same search with 10-, 11-, and 12-nt-long seeds results in average false positive rates of 11%, 4%, and <1%, respectively, at the expense of decreasing the total number of predictions to 211, 44, and 9, respectively. Although it might look more advantageous to use 10-nt seeds than 9-nt seeds, the 9-nt cutoff is more reasonable from the thermodynamic point of view. The data on dinucleotide repeats in the human CFTR gene suggest that the free energy of ∼15 kcal/mol is generally sufficient for a secondary structure to induce exon skipping (Hefferon et al. 2004). This energy roughly corresponds to an average perfect 8-nt helix, and thus a 9-nt helix with, at most, one Wobble base pair must be more than sufficient.
While 10-nt-long seeds lead to a significant reduction in the false positive rate, they are also likely to result in a dramatic increase in the false negative rate because the requirement of at most one GT pair per 9-nt seed is already too restrictive for the naturally occurring RNA structures. Note that the hairpins in the β-tropomyosin gene (Sirand-Pugnet et al. 1995) and in the dystrophin gene (Matsuo et al. 1992) do not exceed the limit of seven consecutive Watson-Crick base pairs. The long-range interactions proposed for the docking site and selector sequences of exons 6.5 and 6.12 of the D. melanogaster Dscam gene consist of longer continuous helices, but the longest stretch of complementary bases with, at most, one GT pair consists of exactly 9 nt (Fig. 6 in Graveley [2005]). We thus decided to keep the 9-nt threshold throughout this report (n = 9 and nGT, max = 1) since it comes out naturally from the biological context of the problem and is consistent with the parameters used in our previous work (Raker et al. 2009); the predictions for n = 10 and nGT, max = 1 are listed in Supplemental Table S2.
Different structure arrangements are associated with different false positive rates (Table 1, upper part). Most of the statistical questions we will ask later are related to the DA arrangement, where the false positive rate is estimated to be between 28% and 36%. In fact, it is a pessimistic estimate because our procedure for estimation of the false positive rate suffers from systematic bias: sequences that contain similar or repetitive signals lead to increased likelihood of having a complementary match even after they are swapped. We thus analyzed the same set of sequences with repeats masked (see Materials and Methods) and found a significant decrease in the number of box pairs predicted for all three control sets, both in terms of absolute values and relative proportions. This confirms that the occurrence of complementary box pairs is enhanced by the repetitive nucleotide context, as was reported previously in the case of exon skipping induced by dinucleotide repeats (Hefferon et al. 2004).
Although 30% is a pessimistic upper estimate of the false positive rate for the DA arrangement, it still indicates that it is, indeed, not too unlikely to find conserved complementary 9-mers at a pair of randomly chosen mammalian splice sites. We thus ranked our predictions by computing P-values for each individual box pair (see Supplemental Table S1); it was done by taking into account the nucleotide context and local nucleotide conservation rate, as in Raker et al. (2009).
Cis-DD and cis-AA structures were subject to a different control procedure. The false positive rate estimated from the linear model was much lower compared to the figures obtained for the rewiring control (Table 1, lower part). Most likely, this difference is not due to a fundamental distinction between cis- and trans-structures but rather reflects the fact that the two control procedures are referencing different null hypotheses. Since the estimates obtained from the linear model are inherently confounded with the stage of multiple sequence alignment, we did not pursue this control procedure any further.
We took a separate look at the complementary boxes in five primates (human, chimpanzee, rhesus, orangutan, and gorilla). The total of 53,774 box pairs was predicted to be conserved in these species vs. ∼37,500 ± 2500 box pairs in GC- and conservation-constrained controls. Even considering the 95%-confidence upper limit of two standard deviations from the mean, we are left with some 10,000 splicing-associated box pairs conserved in five primates.
Statistical properties of box pairs
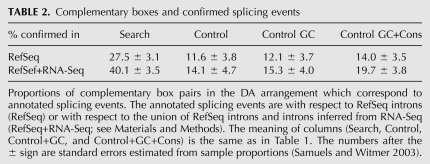
Recall that we search for conserved complementary sequences at all possible combinations of splice sites within each gene, not necessarily for ones that were reported as splicing events (here, by a splicing event we assume a pair of splice sites that are known to be intron ends). We thus asked what fraction of predicted complementary box pairs correspond to annotated splicing events relative to two annotations: the smaller set of introns was taken from RefSeq; the bigger set contained both RefSeq introns and the results of mapping of the RNA-Seq data from Illumina Human Body Map on all possible exon junctions generated from RefSeq (see Materials and Methods). Introns contained in these two databases are referred to as RefSeq-confirmed and RefSeq+RNA-Seq-confirmed, respectively (an intron is said to be confirmed by RNA-Seq if the corresponding splice junction is covered by a number of reads in any of the Human Body Map tissues). In what follows, we count the proportion of box pairs in DA arrangement that correspond to RefSeq-confirmed or RefSeq+RNA-Seq-confirmed introns.
We observed that ∼30% of predicted box pairs were associated with RefSeq-confirmed splicing events, while in the control sets, the respective fraction was approximately twofold smaller (Table 2). The addition of introns derived from RNA-Seq data increased the proportion of predicted box pairs corresponding to confirmed splicing events to ∼40%, with the proportional increase to ∼20% in the control sets. It would be quite unlikely to observe such a difference in proportions (P-value ≅ 0) unless some of these boxes were, indeed, associated with splicing. At that, the proportion of box pairs corresponding to actual splicing events must be even higher since many splice isoforms could be specific to certain tissues, conditions, or developmental stages. For instance, a previously unknown splicing event was reported for the insect Atrophin gene along with a splicing-related RNA structure (Raker et al. 2009). Here, we also report a suboptimal splice site for the human SF1 gene (see below).
TABLE 2.
Complementary boxes and confirmed splicing events
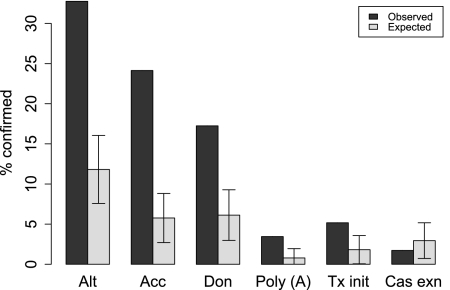
Different subtypes of splicing events were not evenly represented among annotated splicing events for which complementary box pairs were predicted. We now ask what fraction of box pairs in the DA arrangement correspond to RefSeq-annotated splicing events. Figure 2 shows that ∼33% of such box pairs correspond to alternative splicing events, while only 10% is expected for a random sample of the same size (P-value ≅ 0). Relative to all splicing events, almost all subtypes of alternative splicing were observed with frequencies that were higher than could be expected for a simple random sample of the same size. However, when compared to alternative splicing events, the alternative acceptor site usage category remains significantly overrepresented (data not shown). A similar pattern, including overrepresentation of boxes in introns with alternative acceptor site usage and overrepresentation in introns containing an alternative polyadenylation site, was previously seen in insect introns (Raker et al. 2009).
FIGURE 2.
Classes of annotated splicing events associated with RNA structures in DA arrangement. The observed proportions are shown relative to the total number of predicted structures corresponding to RefSeq-confirmed splicing events. The expected percentages were computed based on the population proportions for a random sample of the same size. Error bars denote standard errors for proportions (Samuels and Witmer 2003). Types of splicing events (not mutually exclusive) are: alternative (Alt; see Materials and Methods for definition), alternative acceptor site (Acc), alternative donor site (Don), intron-containing internal polyadenylation site (PolyA), intron-containing alternative transcription initiation site (Tx init), intron containing one or multiple cassette exons (Cas Exn).
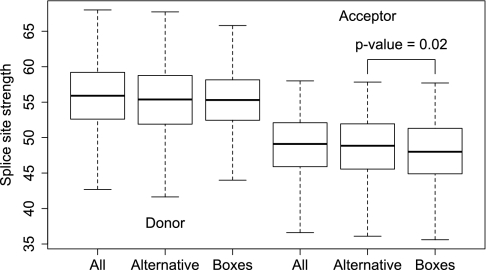
Several studies reported inhibitory impact of RNA structures on the selection of weak splice sites (Singh et al. 2007; Raker et al. 2009). We thus asked whether complementary box pairs are associated with splice sites which differ from the other splice sites in terms of their strengths defined by the scoring matrices which measure the distance between the splice site sequence and the consensus. Figure 3 shows box plots for strengths of human donor and acceptor splice sites. As expected, alternative donor and alternative acceptor splice sites were, on average, weaker than the respective populations. However, acceptor splice sites with boxes were, on average, even weaker than alternative acceptor splice sites (t-test, P-value = 0.021), while strengths of donor splice sites with boxes did not differ significantly from those of all alternative donor sites (P-value ≥ 0.05). In conjunction with the consistent overrepresentation of boxes in introns with alternative acceptor site usage, these results imply that RNA secondary structures that affect splicing are preferentially associated with weak alternative acceptor splice sites.
FIGURE 3.
Distributions of splice sites strengths (see Materials and Methods) of donor (left three box plots) and acceptor (right three box plots) splice sites associated with RNA structures (Boxes) compared to the corresponding distributions of strengths of all (All) and alternative (Alternative) splice sites. Acceptor, but not donor splice sites, associated with RNA structures are (on average) weaker compared to alternative splice sites.
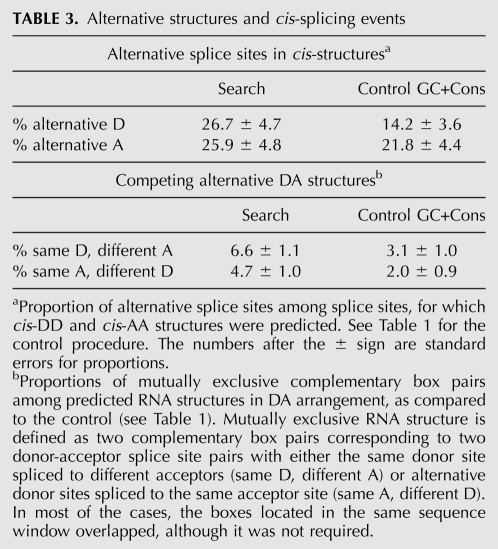
This association, however, seems to be dependent on the arrangement of complementary boxes at splice sites, as suggested by the proportions of cis-DD and cis-AA boxes located at splice sites that are used alternatively (Table 3, lower part). Alternative donor splice sites contain local complementary box pairs more frequently than would be expected at random (t-test, P-value = 0.014), consistent with what has been reported previously for local RNA structures at human splice sites (Shepard and Hertel 2008). Alternative acceptor splice sites are not significantly enriched with local RNA structures (P-value ≥ 0.05). We thus hypothesize that local and long-range RNA structures serve different purposes when regulating alternative donor and acceptor splice site usage. The tendency is that local structures are more likely to be associated with alternative donor splice sites, while long-range structures (ones forming intronic loops) prefer to be involved in the selection of alternative acceptor splice sites.
TABLE 3.
Alternative structures and cis-splicing events
The essential feature of the group of RNA structures reported for the Dscam exon 6 cluster is that the mutually exclusive pattern of splicing appears as a result of mutually exclusive base-pairing between the docking site and the selector sequences (May et al. 2011). We thus asked whether similar patterns occur among our predictions. To address this, we again considered the DA arrangement of boxes and computed the proportion of donor-acceptor splice site pairs, in which one of the splice sites is associated with more than one complementary box (Table 3, lower part). These differences in proportions are statistically significant (P-value < 0.05), suggesting that Dscam is not the only example of mutually exclusive RNA structures affecting alternative splicing. Indeed, the structure-based mechanism of exon selection in Dscam seems to be a fundamental principle of splicing pertaining to living systems much more ancient than fruit flies. It has been conserved for over 40 million years of evolution of Drosophila species, so there is no reason to believe that a similar mechanism would be lost in mammals. A possible mammalian gene that could be spliced in an RNA structure-dependent manner is Titin. According to our predictions, Titin has 22 pairs of conserved complementary boxes, many of which overlap (Supplemental Table S1). Whether or not these structures are functionally related to splicing, their complete list and to what extent they explain intricate splicing patterns of Titin will be explored in future studies.
Case studies
Below, we discuss in detail several mammalian genes for which conserved complementary box pairs were predicted and conjecture on the mechanistic aspects of their splicing regulation (Figs. 4–9). The examples were chosen to illustrate the four possible box arrangements, DA (Figs. 4B–D, 6C), AD (Fig. 7B), DD (Figs. 4C, 6B, 9B,D), and AA (Fig. 8B,D). The first two examples, SF1 (Fig. 4) and ZIP7 (Fig. 6), also serve to demonstrate mutually exclusive RNA structures. In spite of a high overall false positive rate, these particular predictions are significant statistically, as indicated by the P-values (see below). The complete list of all predicted box pairs with corresponding P-values is given in Supplemental Table S1.
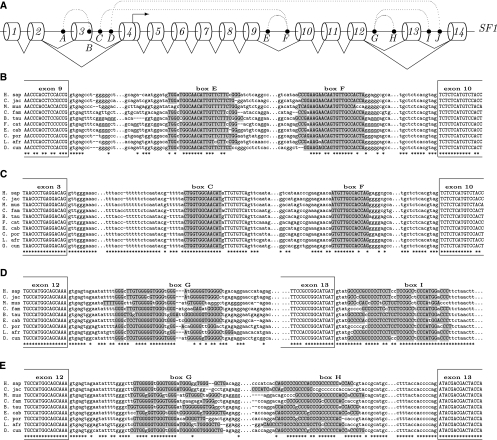
FIGURE 4.
(A) Splicing schema of the human SF1 gene (Splicing Factor 1). Cylinders denote exons, which are enumerated in the 5′-to-3′ direction; filled circles denote boxes; dotted arcs denote complementarity between boxes; solid lines denote splicing; the arrow denotes an alternative transcription start. Box C is complementary to box F (P-value ≅ 10−17), which is also complementary to box E (P-value ≅ 10−19). Box G is complementary to both box H (P-value ≅ 10−12) and box I (P-value ≅ 10−14). (B–E) Multiple sequence alignments describing box E-box F pairing (B), box C-box F pairing (C), box G-box I pairing (D), and box G-box H pairing (E). Complementary nucleotides are highlighted. Framed capital nucleotides denote exons. Asterisks denote conserved positions.
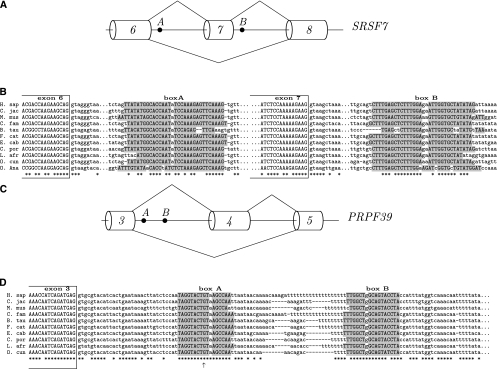
FIGURE 9.
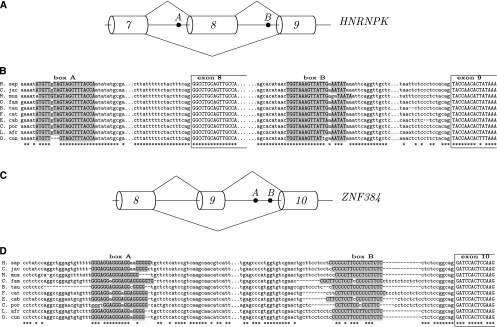
Structures in DD arrangement. (A) Trans-DD structure in SRSF7 gene (P-value ≅ 10−21). (C) Cis-DD structure in PRPF39 gene (P-value ≅ 10−11). Box A overlaps with the cryptic donor splice site pointed to by the arrow in the multiple sequence alignment shown in D. The consensus score of the cryptic site sequence GUAAGC is higher than that of the endogenous donor site (GUGCGU). (B,D) As in Figure 4.
FIGURE 6.
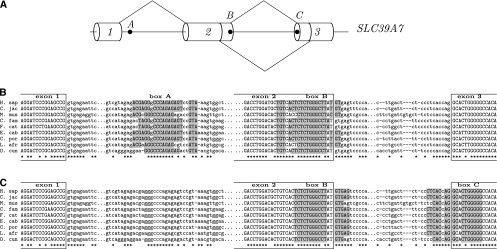
(A) Splicing schema of the gene Slc39a7 (also known as Ke4, ZIP7), which encodes a transporter involved in zinc homeostasis (Huang et al. 2005). Box A is complementary to box B (DD arrangement, P-value ≅ 10−18). Box B is complementary to box C (DA arrangement, P-value ≅ 10−13). The 3′-most donor splice site of exon 2 and the 5′-most acceptor splice site of exon 3 are either both used or both not used, as shown by the lines. (B,C) The rest of the legend is the same as in Figure 4.
FIGURE 7.
(A) Splicing schema of the gene ZFX exemplifies the AD-arrangement of boxes. Exon 10 is surrounded by complementary boxes, box A and box B (P-value ≅ 10−13). (B) As in Figure 4.
FIGURE 8.
Structures in AA arrangement. (A) Trans-AA structure in the HNRNPK gene (P-value ≅ 10−9). (C) Cis-AA structure in the ZNF384 gene. The structure formed by box A and box B (P-value ≅ 10−7) is masking the polypyrimidine tract preceding exon 10. (B,D) As in Figure 4.
Multiple box pairs in SF1 gene
The mammalian gene SF1 (Splicing Factor 1) consists of fourteen exons, some of which are spliced alternatively, and contains ten conserved boxes, as shown in Figure 4A. Some of the boxes form mutually exclusive combinations: For instance, only one of the two boxes, box C or box E, can base pair with box F (Fig. 4B–D). Note that nucleotide sequences of all boxes are longer than 12 nt and are well-conserved across mammals. The individual P-values for these predictions are: 10−19 for the box E-box F pair, 10−17 for the box C-box F pair, 10−14 for the box G-box I pair, and 10−12 for the box G-box H pair, that is, the structures formed by these box pairs are very unlikely to occur at random, considering the nucleotide context and the sequence conservation rate at the corresponding splice sites.
We hypothesize that the intron spanning between exons 9 and 10 would not be spliced unless box E is paired to box F (Fig. 4B). Indeed, the acceptor site of exon 10 is much weaker than are acceptor splice sites on average (z = −2.61) since it ends with TAG and is missing most of its polypyrimidine tract (PPT). Additionally, the intron between exons 9 and 10 contains a premature stop codon and, if retained, would have led to degradation of the SF1 mRNA by nonsense-mediated decay (NMD). Unless degradation by NMD is an endogenous pathway of SF1 silencing, it can be escaped by alternative splicing. As suggested by the box F-box C structure, one of the alternative splicing options is to excise the entire region between exon 3 and exon 10 (Fig. 4C). Indeed, splicing from exon 3 to exon 10 is supported by exon junctions in the RNA-Seq data (ERX011193, lymph node, and ERX011194, thyroid tissue). Remarkably, box C and box F are separated by 6000 nt, which makes their complementarity essentially invisible for most of the methods based on thermodynamic RNA folding.
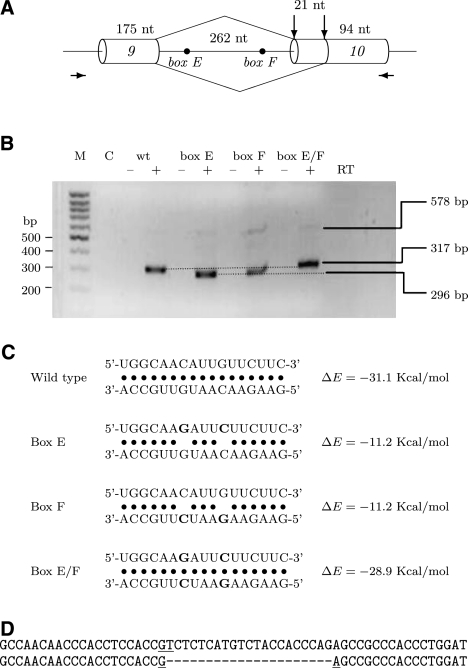
In the minigene that contained a part of SF1 spanning exons 9 and 10, we introduced two point mutations to the sequence of either box E or box F to disrupt their base-pairing (Fig. 5A,C). Contrary to what was expected, it resulted in the excision of a longer intron, while the intron retention was only a minor splicing product (Fig. 5B). Further sequencing revealed that a distal acceptor site located 21 nt downstream from the endogenous acceptor site of exon 10 was used in these mutants (Fig. 5D). However, the distal acceptor site was suppressed, and the splicing pattern returned to that of the wild type when the base-pairing was reestablished by mutating both boxes simultaneously (box E/F) (Fig. 5B). We thus conclude that the structure formed by box E and box F is critical for the wild-type splicing of this intron.
FIGURE 5.
Splicing to alternative acceptor site in the SF1 minigene is regulated by the stem structure formed by the conserved box sequences. (A) Schematic representation of the SF1 minigene, which contains the chromosomal region chr11:64,535,223-64,535,752 (UCSC Genome Browser) from exon 9 to exon 10 of the SF1 gene. Alternative acceptor sites are shown by vertical arrows; locations of primers used for amplification of minigene are indicated by horizontal arrows. (B) Secondary structure formed by the conserved boxes affects acceptor site usage. mRNA products expressed from wild-type (wt) minigene and minigenes mutated within conserved boxes E, F, or both (E/F) were reverse-transcribed and analyzed in 2% agarose gel. (M) size markers (100 bp DNA ladder), (C) control (PCR in the absence of template). The addition (+) or absence (−) of the reverse transcriptase (RT) enzyme to the reaction is indicated. The positions of unspliced (578-bp) and spliced (317- bp and 296-bp) products are shown on the right. (C) Predicted base-pairing for the wild type, box E, box F, and box E/F mutants (point mutations are shown in boldface), with the estimated equilibrium free energies. The box E sequence is shown above the box F sequence. (D) Comparing the nucleotide sequences of alternatively spliced products of minigenes: wild type and box E/F mutant (upper) and box E and box F mutant (lower).
Since the base-pairing does not seem to block any cis-elements and the sequence of the downstream acceptor site is closer to the consensus than is the sequence of the endogenous acceptor, the most plausible mechanistic explanation is that the stem formed by box E and box F changes the RNA conformation so that the endogenous acceptor site gets a competitive advantage over the distal splice site. This makes it critically different from the RNA structure modulating alternative acceptor site usage in the Atrophin gene, where the base-pairing was also long-range but repressive (Raker et al. 2009).
Additionally, we searched through the EST databases and found that the usage of the distal acceptor site of exon 10 was also observed in an adenocarcinoma cell line of breast cancer (GenBank Acc: BU538236), in an adenocarcinoma cell line of uterine cancer (GenBank Acc: BE562836), in a transitional papilloma cell line (GenBank Acc: BG286746), as well as in normal adult and fetal brain tissues (GenBank Acc: DA030484 and D56431). The alternative splicing product corresponding to the distal acceptor site of exon 10 is missing the heptapeptide SLMSTTQ, in which the middle serine residue (S52) is likely to be a phosphorylation site, as predicted by NetPhos 2.0 Server (Blom et al. 1999). We thus hypothesize that the SF1 protein lacking the S52 phosphorylation site, possibly as a result of structural changes in its pre-mRNA, has an altered function that could be implicated in carcinogenesis.
Another pair of competing RNA structures in the SF1 transcript is located between exons 12 and 13 (box G and box H), with an additional box I downstream from exon 13. Box H and box I are both complementary to box G and cannot pair with it at the same time. The nucleotide sequence of box G consists mainly of G and T residues forming repetitive patterns (such as GGGT), while box H and box I are both C-rich. We hypothesize that base-pairing between box G and box I would lead to splicing of the intron from exon 12 to exon 14 (Fig. 4D). Then, it is plausible that the structure formed by box G and box H would loop out the intron between exons 12 and 13, thereby promoting exon 13 inclusion (Fig. 4E). Both exon 12 to exon 13 and exon 12 to exon 14 splicing patterns are confirmed by RefSeq (Karolchik et al. 2003). However, it could also be that box H constitutes a part of the PPT preceding the acceptor splice site of exon 13, and then the base-pairing of box G and box H would suppress splicing of the intron between exons 12 and 13. Here we are reminded that the observed association between occurrence of complementary boxes at splice sites does not allow any conclusion about causality or even the direction of splicing regulation.
Other case studies
Another pair of mutually exclusive RNA structures was found in the Slc39a7 gene (also known as ZIP7) which encodes a transporter involved in zinc homeostasis of the Golgi apparatus (Huang et al. 2005). The Slc39a7 mRNA (Fig. 6A) contains two pairs of complementary boxes, box A-box B (P-value ≅ 10−18) and box B-box C (P-value ≅ 10−13). In spite of having two donor sites in exon 2 and two acceptor sites in exon 3, not all four possible combinations of these splice sites are expressed. In all transcripts of this gene, the 3′-most donor site of exon 2 is used together with the 5′-most acceptor site of exon 3 or, vice versa, the 5′-most donor site of exon 2 is used with the 3′-most acceptor site of exon 3. Scoring matrices show that the former pair of splice sites is stronger than the latter pair and, thus, the longer intron is excised when the RNA structure formed by box B and box C masks stronger splice sites (Fig. 6B). Interestingly, a part of the sequence of box B is also complementary to box A located in the upstream intron, and the RNA structure formed by box A and box B is more stable compared to the one formed by box B and box C (Fig. 6C). Thus, if box B is paired with box A, then it cannot pair with box C, releasing stronger splice sites and promoting excision of a shorter intron, while if box A is not available, then box B can pair with box C, occlude the pair of strong splice sites, and lead to excision of a longer intron. Although the structure formed by box A and box B overlaps very little with the U2AF binding region of the 3′-most donor splice site of exon 2, it is not clear to what extent this donor site can be accessed by the spliceosome. Our prediction that the structure formed by box A and box B can induce exon 2 skipping is supported by the RNA-Seq data (ERX011184, ovary tissue), which contains exon 1-exon 3 junctions.
Although introns containing cassette exons are associated with boxes as frequently as are other alternative splicing events, we find many interesting examples of complementary boxes corresponding to looping-out of cassette exons. One of these examples is the X-linked zinc finger gene ZFX, which contains a pair of boxes in AD arrangement flanking the ends of exon 10 (Fig. 7A). The positioning of box A and box B (P-value ≅ 10−13) suggests that they form a loop that can promote exon 10 skipping (Fig. 7B). Another example is the heterogeneous nuclear ribonucleoprotein gene HNRNPK with two complementary boxes in trans-AA arrangement (P-value ≅ 10−9) (Fig. 8A,B). In both ZFX and HNRNPK, the exons flanked by complementary boxes are known to be spliced as cassette exons (Karolchik et al. 2003). Another AA structure, this time in cis-arrangement, is located upstream of exon 10 of the ZNF384 gene, which encodes a CAS-interacting zinc finger protein (P-value ≅ 10−7) (Fig. 8C). In this case, the G-rich box A is complementary to the C-rich box B, which presumably constitutes a part of the PPT preceding exon 10 (Fig. 8D). Although the acceptor site of exon 10 is used in all splice isoforms of this gene either in combination with the donor site of exon 8 or exon 9, it still could be suppressed in the conditions when box A is paired to box B. Examples of RNA structures masking PPT or a branch point have been reported (Chen and Stephan 2003).
The complementary boxes in the SRSF7 gene, the serine/arginine-rich splicing factor, are arranged in trans at the donor splice sites of exons 6 and 7 (P-value ≅ 10−21) (Fig. 9A). According to splicing annotation, the exon between box A and box B is a cassette exon, suggesting that the mechanism of splicing of this exon could also be related to the RNA structure formed by box A and box B (Fig. 9B). The conservation of boxes can be traced up to platypus, with the seed conserved across almost all placental mammals and the rest of the box divergent in terms of nucleotide sequence but conserved in terms of base-pairing. If the seed region were not conserved up to platypus, this method would not have been able to detect such structure because of the limitation on the number of mismatches between seeds found in different species.
The cis-DD structure observed in the PRPF39 gene (pre-mRNA-processing factor 39) is a stem–loop located downstream from the donor splice site of exon 3 (P-value ≅ 10−11) (Fig. 9C). This splice site was reported to be used in all variants of PRPF39 mRNA with the exception of a few minor isoforms (BG704939), in which a downstream cryptic splice site was used (shown by the arrow in the alignment in Figure 9D). The sequence of this downstream cryptic splice site has a higher consensus score compared to that of the endogenous donor site (GUAAGC vs. GUGCGU), thus suggesting that the stem–loop structure formed by box A and box B is used to suppress aberrant splicing.
It can be noted that many of the genes in Figures 4–9 are functionally related to RNA processing: SF1 is a splicing factor, SRSF7 is a serine/arginine-rich protein, PRPF39 is a pre-mRNA-binding factor. In fact, RNA metabolic processes (GO:0016070), multicellular organismal development (GO:0007275), and system development (GO:0048731) were the top three biological process ontologies significantly overrepresented in the set of genes associated with RNA structures (P-values < 10−25). Molecular functions of genes in this set were significantly biased toward nucleic acid binding (GO:0003676) and RNA binding (GO:0003723) (P-values < 10−10). This observation could support the hypothesis that the alternative splicing of genes that are responsible for RNA binding and possibly constitute parts of the spliceosome could be regulated by a mechanism that avoids the use of protein trans-factors, which would particularly include products of these genes themselves.
DISCUSSION
The main advantage of the approach presented in this work is that it does not depend on multiple sequence alignments and works equally well for local and long-range RNA structures. This is achieved by using hash tables, which appoint to each n-mer subsequence (seed) the list of sequence windows (or, equivalently, splice sites), in which it occurs. The position of the seed within the window is not important; it only matters that a given n-mer is observed at a given splice site. After that, the question of complementarity or sequence conservation translates into the set-theoretic language of intersections and reverse complements of hash tables. Despite computation time being linear, the storage grows exponentially with increasing seed length, so the approach becomes almost impractical for n > 12. However, for a large enough n (namely, for n ≥ 8), the occurrence of a pair of conserved complementary n-mers becomes a rare enough event that it can be used as an indicator for the existence of a secondary structure, however at the false positive rate as high as was reported.
One important feature of the RNA structure is its ability to form groups of mutually exclusive boxes that switch between alternative splicing pathways. As shown in Figures 4 and 6, the RNA structures associated with multiple splicing events within one gene can function both independently (for instance, box E-box F vs. box G-box H in Fig. 4) and cooperatively (box A-box B vs. box B-box C in Fig. 6). Considering that the evolution of cis-regulatory elements generally occurs faster compared to the modules, in which cis-elements are evolving together with trans-activating factors, this opens the possibility for creating regulatory networks of tremendous combinatorial complexity, which could control expression of thousands of splice isoforms from a single gene. A well-known but, as we predict, not the only example of such a network of regulatory RNA structures is the Dscam gene, which is able to produce as many as 38,000 isoforms by alternative splicing of four variable exon clusters (May et al. 2011).
One of the main arguments against the occurrence of long-range RNA structures is that the distantly located parts of the pre-mRNA may have little or no chance to interact, although in some cases such interactions have been reported to be essential for the proper folding and functioning of large biologically active RNAs (Parsch et al. 1997; Conn and Draper 1998). This argument concerns, for instance, the interaction between box C and box F and the role it plays in splicing of the SF1 gene (Fig. 4). Indeed, splicing from exon 3 to exon 10 is supported by RNA-Seq reads in at least two tissues. The equilibrium free energy of the 13-nt helix formed by these boxes, which loops-out some 6000 nt, is ∼−24.6 kcal/mol, which corresponds to the order of decay times of ∼several years (Danilova et al. 2006). Perhaps, it is not a question of whether or not the free energy gain from base-pairing is sufficient to cover the free energy cost of loop formation but rather a question of what is the likelihood of box C-box F nucleation relative to the time frame of splicing reaction. In order to address this, one needs to know the actual size of the loop between box C and box F, which depends on how the entire pre-mRNA molecule is folded in between these boxes, and also take into account kinetic factors, including the rate of pre-mRNA production. Our recent results on the Nmnat gene in Drosophila indicate that the mechanism by which long-range RNA structures affects splicing is tightly coupled to transcription and polyadenylation (Raker et al. 2009).
Recently, a large number of RNA structures were predicted to affect pre-mRNA splicing by genome-wide surveys based on thermodynamic folding alone (Hiller et al. 2007) or on its combination with phylogenetic approaches (Rose et al. 2007; Shepard and Hertel 2008). Thermodynamic folding, however, is efficient only for short sequences, thus restricting the search space to local RNA structures and leaving the looping-out mechanism out of consideration. The constraint of no pseudoknots, which is inherent to the dynamic programming core of thermodynamic models, reduces the search space to nested structures and also results in incorrect predictions: the further apart complementary sequences are from each other, the higher the chance that one of them will be looped-out by local base-pairings and become invisible for the other. All attempts to apply the thermodynamic folding outside of the nested paradigm eventually encountered the problem of loop energy estimation, which undermined their experimentally measured thermodynamic virtues (Zhang et al. 2009). Yet another fundamental problem in many genome-wide studies stems from the ab initio use of genomic sequence alignments. Multiple sequence alignments, by definition, assume sequence, not structure conservation, leading to a dramatic increase in the number of misaligned structures when the nucleotide conservation rate is low (Meyer and Miklós 2005).
The cotranscriptional nature of RNA folding is another argument against the use of purely thermodynamic models for predicting secondary structure of long RNA molecules. Kinetic aspects significantly impact spliceosomal assembly, including the order in which cis-regulatory elements get exposed to splicing factors, and lead to the formation of suboptimal structures which, in principle, have to be considered as a part of the folding path of nascent RNA molecules (Meyer and Miklós 2005). Besides that, the free energy-based model contains numerous parameters along with a noticeable degree of sensitivity to their numerical values, which is particularly important for longer molecules where energy calculations accumulate huge statistical errors (Layton and Bundschuh 2005). While there is no doubt that the thermodynamic folding is the best and the most realistic way to model secondary structure of small RNA molecules, at a megabase scale and with many auxiliary factors bound to pre-mRNA in the living cell, a more coarse structure prediction instrument such as the one described here seems to be of better use.
The cross-species pattern of presence or absence of RNA structures (Supplemental Table S1) could be related to species-specific alternative splicing. For instance, one might expect that if a pair of boxes is present in one species and absent in another, then the corresponding intron would be spliced in the former but not the latter. However, currently there is still not enough expression data to reliably address this. Although the presence of RNA structure at alternatively used splice sites is a good indicator of a regulatory mechanism associated with it, the set of regulating factors is yet to be identified and, generally, there is no reason to expect the same splicing outcome in different species even when the RNA structure is completely conserved. Additionally, the links to phenotype are confounded with quantitative changes. For instance, the disease phenotype of cystic fibrosis results from the changes in relative amounts of two splice isoforms of the CFTR gene as a consequence of changes in the amount, not simply the presence or absence of RNA structure (Hefferon et al. 2004).
In sum, we propose that the previous genome-wide studies uncovered only a small fraction of RNA structures that are functionally related to splicing. Even with the false positive rate as high as reported here, we find strong statistical evidence for association between alternative splicing and conserved complementary sequences located near mammalian splice sites, including ones that are separated by thousands of nucleotides. Taken together with our previous report on conserved RNA structures in Drosophila (Raker et al. 2009), these results strongly suggest that RNA secondary structure plays an important, yet underestimated role in the regulation of pre-mRNA splicing.
MATERIALS AND METHODS
Splicing database
The splicing database was created from the human RefSeq data (Feb. 2009 human genome assembly, GRCh37) obtained from Karolchik et al. (2003). It contained ∼383,000 splice sites, 200,000 introns, and 213,000 exons. Additionally, a data set consisting of 80,000 introns was inferred from the mapping of RNA-Seq data onto intra-genic splice junctions formed by RefSeq exons (see below). Where required, the repeats from RepeatMasker and Tandem Repeats Finder (with the period of 12 nt or less) were masked (Karolchik et al. 2003).
The orthologs of human splice sites in other species were derived using pairwise nucleotide BLASTZ chain alignments (Karolchik et al. 2003) of Homo sapiens with each of the following species (abbreviations in parentheses denote UCSC version numbers): Callithrix jacchus (calJac3), Mus musculus (mm9), Canis familiaris (canFam2), Felis catus (felCat4), Bos taurus (bosTau4), Equus caballus (equCab2), Cavia porcellus (cavPor3), Loxodonta africana (loxAfr3), Oryctolagus cuniculus (oryCun2), Ornithorhynchus anatinus (ornAna1), Anolis carolinensis (anoCar1). If a splice site was contained in more than one chain, we selected the combination of chains to maximize the number of splice sites aligned per gene. Approximately 301,000 splice sites had orthologs in at least 9 of 12 species. In the analysis of five primates, we used pairwise alignments of H. sapiens with Pan troglodytes (panTro3), Gorilla gorilla (gorGor1), Pongo abelii (ponAbe2), and Macaca mulatta (rheMac2). Approximately 365,000 splice sites had orthologs in all five species.
RNA-seq data analysis
The human transcriptome sequencing data were retrieved from the NCBI Sequence Read Archive (Illumina Human Body Map 2.0 Project, SRA ID ERP000546). Sixteen 2 × 50 bp paired end data sets corresponding to various tissues were mapped to all possible intragenic splice junctions composed of exonic sequences of a length 45 bp from the splice site. The junction length was set to 2 × 45 bp to avoid reads mapping to one half of the junction only. Paired end reads of 2 × 50 bp were selected because longer reads would lead to skipping of shorter exons while mapping to splice junctions.
Reads were aligned to the splice junctions with the program Bowtie (Langmead et al. 2009). The number of allowed mismatches was set to two. On average, 9.0% of reads were mapped uniquely to splice junctions (230 of 2557 million reads in sum). Reads that mapped to multiple locations in the human genome were discarded (0.8%, or 21 million reads). Normalization steps such as computation of RPKMs were not necessary because tissues were not compared to each other and a positive number of reads was counted as a confirmation regardless of their quantity.
Seed search and controls
The seed search algorithm and the corresponding control procedure are explained in detail in Supplemental Material. The default parameters were: le = 0, li = 150, n = 9, nmax(GT) = 1, nmin(GC) = 2, ɛ = 3, and smin = 9. Local sequence homology was estimated as explained in Edgar (2004a,b). The core of the method was implemented in C++ (seed search); the source code is available at http://bioinf.fbb.msu.ru/∼dp/rna/. The auxiliary procedures for representation of the results were implemented using PERL, R-statistics, and LATEX.
Consensus scores of splice sites
Splice site strengths were computed based on scoring matrices inferred from the position-weight matrix (Mount et al. 1992). The windows of 3 nt upstream of and 5 nt downstream from (12 nt upstream of and 2 nt downstream from) donor (respectively, acceptor) splice sites were considered. Nucleotide frequencies were converted using log2-transform and scaled from 0 to 100 for each position. The strength of an individual (donor or acceptor) splice site was computed as a sum of scores over all positions in the respective windows (−3 to +5 for donors; −12 to +2 for acceptors) and converted to a Z-score by subtracting the average splice site score and dividing the result by the standard deviation (separately for donors and acceptors). In all species, the respective distributions were mound-shaped and fairly symmetric (data not shown), so it was not unreasonable to assume a normal distribution for splice site strengths.
Statistical inference
Throughout the article, we report one-tailed P-values. The computation of P-values for individual box pairs was carried out as in Raker et al. (2009) (see Supplemental Material for details). The significance level of 5% was assumed in all tests. Tests of significance for proportions were performed using the one-sample z-test for np > 5, and using the Poisson approximation to the binomial distribution for n ≤ 5, where n is the sample size and p is the population proportion. The reference population was defined uniquely by the context in each test. The number that follows the ± sign denotes the standard deviation. Statistical analysis of gene functions was carried out by using the GOstat software with the Benjamini correction for multiple tests (Beißbarth and Speed 2004).
Minigenes and splicing assay
A minigene containing part of exon 9, intron 9, and part of exon 10 of the human SF1 gene was amplified from genomic DNA using High Fidelity PCR Enzyme Mix (Fermentas), cloned in pGEM-T Easy vector (Promega), and verified by sequencing. The minigene was inserted into the pRK5 plasmid containing CMV enhancer/promoter and SV40 polyadenylation signal. Human HEK293 cells were transfected using Lipofectamine (Invitrogen). Cells were harvested 24 h later, and RNA was purified using RNAspin Mini kit (GE Healthcare). Reverse transcription was carried out on 1 μg of RNA with oligo-dT primer using the ImProm-II Reverse Transcription System (Promega). PCR was performed with the plasmid-specific forward primer and the reverse primer specific for exon 10 of the SF1 gene in 1/40 of reverse transcription mixture. Controls were done without the addition of reverse transcriptase to differentiate between RNA and DNA amplification. Amplicons of splicing products were visualized on 2% agarose gels, and bands were excised from the gel. DNA fragments were isolated with GFX PCR DNA and the Gel Band Purification kit (GE Healthcare), cloned into pGEM-T Easy vector (Promega), and identified by sequencing. Mutagenesis was performed using two rounds of PCR with mutagenic primers, and resulting mutants were verified by sequencing.
SUPPLEMENTAL MATERIAL
Supplemental material is available for this article.
ACKNOWLEDGMENTS
This research was funded by the Russian Foundation for Basic Research (grants 10-04-00783 and 09-04-92742), State Contracts (02.740.11.0101, 14.740.11.0003, and 07.514.11.4007), and the programs “Molecular and Cellular Biology” and “Basic Science for Medicine.” We thank Inessa Y. Skripkina and Alla V. Ryndich from the Institute of Molecular Biology and Genetics NAS of Ukraine for their experimental efforts and discussions.
Author contributions: D.D.P. and A.A.M. designed the computational part; D.D.P. and E.E.K. performed the computational part; M.Yu.P. and P.M.R. performed the experimental validation; all authors analyzed and discussed the data; and D.D.P. and M.S.G. wrote the paper.
Footnotes
Article published online ahead of print. Article and publication date are at http://www.rnajournal.org/cgi/doi/10.1261/rna.029249.111.
REFERENCES
- Babak T, Blencowe B, Hughes T 2007. Considerations in the identification of functional RNA structural elements in genomic alignments. BMC Bioinformatics 8: 33 doi: 10.1186/1471-2105-8-33 [DOI] [PMC free article] [PubMed] [Google Scholar]
- Balvay L, Libri D, Fiszman MY 1993. Pre-mRNA secondary structure and the regulation of splicing. Bioessays 15: 165–169 [DOI] [PubMed] [Google Scholar]
- Beißbarth T, Speed TP 2004. GOstat: Find statistically overrepresented gene ontologies within a group of genes. Bioinformatics 20: 1464–1465 [DOI] [PubMed] [Google Scholar]
- Blom N, Gammeltoft S, Brunak S 1999. Sequence and structure-based prediction of eukaryotic protein phosphorylation sites. J Mol Biol 294: 1351–1362 [DOI] [PubMed] [Google Scholar]
- Buratti E, Baralle FE 2004. Influence of RNA secondary structure on the pre-mRNA splicing process. Mol Cell Biol 24: 10505–10514 [DOI] [PMC free article] [PubMed] [Google Scholar]
- Chen Y, Stephan W 2003. Compensatory evolution of a precursor messenger RNA secondary structure in the Drosophila melanogaster Adh gene. Proc Natl Acad Sci 100: 11499–11504 [DOI] [PMC free article] [PubMed] [Google Scholar]
- Conn GL, Draper DE 1998. RNA structure. Curr Opin Struct Biol 8: 278–285 [DOI] [PubMed] [Google Scholar]
- Danilova L, Pervouchine D, Favorov A, Mironov A 2006. RNAKinetics: A web server that models secondary structure kinetics of an elongating RNA. J Bionf and Comp Biol 4: 1–8 [DOI] [PubMed] [Google Scholar]
- Edgar RC 2004a. Local homology recognition and distance measures in linear time using compressed amino acid alphabets. Nucleic Acids Res 32: 380–385 [DOI] [PMC free article] [PubMed] [Google Scholar]
- Edgar RC 2004b. MUSCLE: A multiple sequence alignment method with reduced time and space complexity. BMC Bioinformatics 5: 113 doi: 10.1186/1471-2105-5-113 [DOI] [PMC free article] [PubMed] [Google Scholar]
- Gesell T, Washietl S 2008. Dinucleotide controlled null models for comparative RNA gene prediction. BMC Bioinformatics 9: 248 doi: 10.1186/1471-2105-9-248 [DOI] [PMC free article] [PubMed] [Google Scholar]
- Graveley BR 2005. Mutually exclusive splicing of the insect Dscam pre-mRNA directed by competing intronic RNA secondary structures. Cell 123: 65–73 [DOI] [PMC free article] [PubMed] [Google Scholar]
- Grover A, Houlden H, Baker M, Adamson J, Lewis J, Prihar G, Pickering-Brown S, Duff K, Hutton M 1999. 5′ splice site mutations in tau associated with the inherited dementia FTDP-17 affect a stem-loop structure that regulates alternative splicing of exon 10. J Biol Chem 274: 15134–15143 [DOI] [PubMed] [Google Scholar]
- Hefferon TW, Groman JD, Yurk CE, Cutting GR 2004. A variable dinucleotide repeat in the CFTR gene contributes to phenotype diversity by forming RNA secondary structures that alter splicing. Trends Genet 101: 3504–3509 [DOI] [PMC free article] [PubMed] [Google Scholar]
- Hiller M, Zhang Z, Backofen R, Stamm S 2007. Pre-mRNA secondary structures influence exon recognition. PLoS Genetics 3: e204 doi: 10.1371journal.pgen.0030204 [DOI] [PMC free article] [PubMed] [Google Scholar]
- Huang L, Kirschke C, Zhang Y, Yu Y 2005. The ZIP7 gene (Slc39a7) encodes a zinc transporter involved in zinc homeostasis of the Golgi apparatus. J Biol Chem 280: 15456–15463 [DOI] [PubMed] [Google Scholar]
- Karolchik D, Baertsch R, Diekhans M, Furey TS, Hinrichs A, Lu YT, Roskin KM, Schwartz M, Sugnet CW, Thomas DJ, et al. 2003. The UCSC genome browser database. Nucleic Acids Res 31: 51–54 [DOI] [PMC free article] [PubMed] [Google Scholar]
- Kaufmann D, Leistner W, Kruse P, Kenner O, Hoffmeyer S, Hein C, Vogel W, Messiaen L, Bartelt B 2002. Aberrant splicing in several human tumors in the tumor suppressor genes neurofibromatosis type 1, neurofibromatosis type 2, and tuberous sclerosis 2. Cancer Res 62: 1503–1509 [PubMed] [Google Scholar]
- Langmead B, Trapnell C, Pop M, Salzberg SL 2009. Ultrafast and memory-efficient alignment of short DNA sequences to the human genome. Genome Biol 10: R25 doi: 10.1186/gb-2009-10-3-r25 [DOI] [PMC free article] [PubMed] [Google Scholar]
- Layton DM, Bundschuh R 2005. A statistical analysis of RNA folding algorithms through thermodynamic parameter perturbation. Nucleic Acids Res 33: 519–524 [DOI] [PMC free article] [PubMed] [Google Scholar]
- Matsuo M, Nishio H, Kitoh Y, Francke U, Nakamura H 1992. Partial deletion of a dystrophin gene leads to exon skipping and to loss of an intra-exon hairpin structure from the predicted mRNA precursor. Biochem Biophys Res Commun 182: 495–500 [DOI] [PubMed] [Google Scholar]
- May G, Olson S, McManus C, Graveley B 2011. Competing RNA secondary structures are required for mutually exclusive splicing of the Dscam exon 6 cluster. RNA 17: 222–229 [DOI] [PMC free article] [PubMed] [Google Scholar]
- Meyer IM, Miklós I 2005. Statistical evidence for conserved, local secondary structure in the coding regions of eukaryotic mRNAs and pre-mRNAs. Nucleic Acids Res 33: 6338–6348 [DOI] [PMC free article] [PubMed] [Google Scholar]
- Mount SM, Burks C, Herts G, Stormo GD, White O, Fields C 1992. Splicing signals in Drosophila: Intron size, information content, and consensus sequences. Nucleic Acids Res 20: 4255–4262 [DOI] [PMC free article] [PubMed] [Google Scholar]
- Nasim FU, Hutchison S, Cordeau M, Chabot B 2002. High-affinity hnRNP A1 binding sites and duplex-forming inverted repeats have similar effects on 5′ splice site selection in support of a common looping out and repression mechanism. RNA 8: 1078–1089 [DOI] [PMC free article] [PubMed] [Google Scholar]
- Parsch J, Tanda S, Stephan W 1997. Site-directed mutations reveal long-range compensatory interactions in the Adh gene of Drosophila melanogaster. Proc Natl Acad Sci 94: 928–933 [DOI] [PMC free article] [PubMed] [Google Scholar]
- Pistoni M, Ghigna C, Gabellini D 2010. Alternative splicing and muscular dystrophy. RNA Biol 19: 441–452 [DOI] [PMC free article] [PubMed] [Google Scholar]
- Raker VA, Mironov AA, Gelfand MS, Pervouchine DD 2009. Modulation of alternative splicing by long-range RNA structures in Drosophila. Nucleic Acids Res 37: 4533–4544 [DOI] [PMC free article] [PubMed] [Google Scholar]
- Rose D, Hackermüller J, Washietl S, Reiche K, Hertel J, Findeiß S, Stadler PF, Prohaska SJ 2007. Computational RNomics of drosophilids. BMC Genomics 8: 406 doi: 10.1186/1471-2164-8-406 [DOI] [PMC free article] [PubMed] [Google Scholar]
- Samuels ML, Witmer J.A 2003. Statistics for the life sciences. Prentice Hall, Upper Saddle River, NJ [Google Scholar]
- Shepard PJ, Hertel KJ 2008. Conserved RNA secondary structures promote alternative splicing. RNA 14: 1463–1469 [DOI] [PMC free article] [PubMed] [Google Scholar]
- Singh NN, Singh RN, Androphy EJ 2007. Modulating role of RNA structure in alternative splicing of a critical exon in the spinal muscular atrophy genes. Nucleic Acids Res 35: 371–389 [DOI] [PMC free article] [PubMed] [Google Scholar]
- Sirand-Pugnet P, Durosay P, d'Orval BC, Brody E, Marie J 1995. β-tropomyosin pre-mRNA folding around a muscle-specific exon interferes with several steps of spliceosome assembly. J Mol Biol 251: 591–602 [DOI] [PubMed] [Google Scholar]
- Smith CW, Valcarcel J 2000. Alternative pre-mRNA splicing: The logic of combinatorial control. Trends Biochem Sci 25: 381–388 [DOI] [PubMed] [Google Scholar]
- Solnick D 1985. Alternative splicing caused by RNA secondary structure. Cell 43: 667–676 [DOI] [PubMed] [Google Scholar]
- Wang Z, Burge C 2008. Splicing regulation: From a parts list of regulatory elements to an integrated splicing code. RNA 14: 802–813 [DOI] [PMC free article] [PubMed] [Google Scholar]
- Warf M, Berglund J 2010. Role of RNA structure in regulating pre-mRNA splicing. Trends Biochem Sci 35: 169–178 [DOI] [PMC free article] [PubMed] [Google Scholar]
- Zhang J, Dundas J, Lin M, Chen R, Wang W, Liang J 2009. Prediction of geometrically feasible three-dimensional structures of pseudoknotted RNA through free energy estimation. RNA 15: 2248–2263 [DOI] [PMC free article] [PubMed] [Google Scholar]


