

Abstract
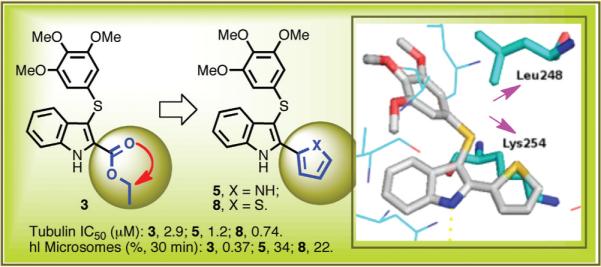
New arylthioindoles (ATIs) were obtained by replacing the 2-alkoxycarbonyl group with a bioisosteric 5-membered heterocycle nucleus. The new ATIs 5, 8, and 10 inhibited tubulin polymerization, reduced cell growth of a panel of human transformed cell lines, and showed higher metabolic stability than the reference ester 3. These compounds induced mitotic arrest and apoptosis at a similar level as combretastatin A-4 and vinblastine and triggered caspase-3 expression in a significant fraction of cells in both p53-proficient and p53-defective cell lines. Importantly, ATIs 5, 8, and 10 were more effective than vinorelbine, vinblastine, and paclitaxel as growth inhibitors of the P-glycoprotein-overexpressing cell line NCI/ADR-RES. Compound 5 was shown to have medium metabolic stability in both human and mouse liver microsomes, in contrast to the rapidly degraded reference ester 3, and a pharmacokinetic profile in the mouse characterized by a low systemic clearance and excellent oral bioavailability.
INTRODUCTION
Microtubules (MTs) are a broadly exploited target in the search for new effective anticancer agents.1-3 MTs are highly dynamic cylindrical structures principally composed of α,β-tubulin heterodimers. During their assembly, MTs continuously undergo regulated transitions between polymerization and depolymerization, a process known as dynamic instability. MTs are required for many essential cellular functions, including the maintenance of cell shape, cell motility, intracellular transport, and cell division. At the onset of mitosis, the interphase MTs rapidly disassemble, and newly polymerized MTs organize into the mitotic spindle, a symmetrical dynamic structure that drives chromosome segregation. Thus, the mitotic apparatus is cyclically assembled to ensure even chromosome distribution into two genetically identical daughter cells. Interfering with MT function, by either inhibiting tubulin polymerization or blocking MT dynamic transitions, causes cell damage and blocks cell division. Devising compounds that interfere with these cellular processes is therefore an established strategy to inhibit the proliferation of cancer cells.2-4
MT assembly can be inhibited by using colchicine (1),5,6 combretastatin A-4 (CSA4, 2)7 (Chart 1), and the Cathar-anthus alkaloids vincristine and vinblastine (VBL), all of which prevent tubulin polymerization. This results in MT destabilization, arrest of mitotic progression, and subsequent cell death. Another class of antimitotic drugs, including taxoids and epothilones, target a lumenal site on the β-subunit8,9 and enter the lumen through a binding site10 located at a pore on the MT surface formed by different tubulin heterodimers. In that group, paclitaxel (PTX) stimulates MT polymerization and stabilization at high concentrations, whereas at lower concentrations it inhibits MT dynamics with little effect on the proportion of tubulin in polymer.11 Thus, either inhibition or enhancement of tubulin assembly prevents proper functioning of the mitotic apparatus and ultimately blocks cell division.
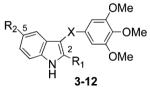
Chart 1. Structures of ATI Derivatives 3–12 and Reference Compounds 1 and 2a.
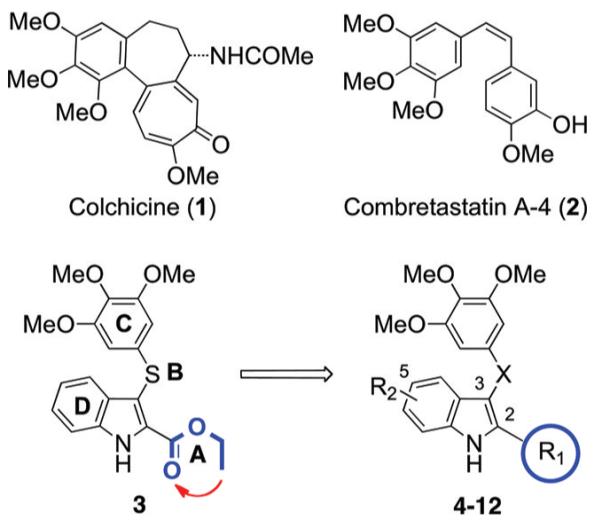
aA–D: ATIs’ binding regions. R1 = 1H-pyrrol-2-yl, 1H-pyrrol-3-yl, furan-2-yl, furan-3-yl, thiophen-2-yl, thiophen-3-yl; R2 = H, OMe; X = S, C=O, CH2.
MT-targeting drugs with different mechanisms of action have an empirical therapeutic efficacy in a variety of tumor types. Nevertheless, a number of unsolved problems still remain in their clinical use: (i) drug resistance appears often, with a poorly understood molecular basis, which makes it a difficult to predict phenomenon; (ii) secondary toxicity on nontransformed cells is often observed in clinical practice, partly independent of the antitubulin mechanism of action of any specific drug.12 There is therefore an urgent need to design and synthesize novel tubulin inhibitors of improved efficacy.13
Arylthioindole (ATI) antimitotic agents are potent inhibitors of tubulin polymerization and cancer cell growth. ATIs inhibit [3H]colchicine binding in the β-tubulin site close to its interface with α-tubulin within the α,β-dimer.14 Structure–activity relationship (SAR) studies of ATIs14-17 have been focused on the following: (A) the substituent at position 2 of the indole, (B) the sulfur atom bridge, (C) the 3-arylthio group, and (D) the substituent at position 5 of the indole (Chart 1). Previous SAR studies at the A region addressed the elongation of the 2-methoxy- or 2-ethoxycarbonyl group by means of C3–C5 alkoxy chains.14,15 Other ester functionalities were not explored, as the C3–C5 alkoxy chains led to decreases of both antitubulin and antiproliferative activities.15
In studies to be presented here, we found that ester derivative 3 was extensively degraded by mouse and human liver microsomes. Therefore, we decided to replace the ethoxycarbonyl group of 3 (A region) with a potentially more stable five-membered heterocyclic nucleus, the bioisosteric pyrrole, furan, and thiophene moieties.18 Preliminary modeling studies showed that, with respect to the small/medium linear chain,15 the five-membered heterocycle at position 2 of the indole nucleus could form new hydrophobic interactions with Lys254 and Leu248 of the colchicine site of tubulin (Supporting Information).
Here, we report that this strategy was successful. The analogues with a pyrrole (4, 5), furan (6, 7), or thiophene (8–12) moiety had enhanced activity against the target tubulin, and moreover, compound 5, in particular, displayed much better stability than 3 in the microsomal assays and good pharmacokinetic properties.
CHEMISTRY
Microwave (MW) reaction of an appropriate 2-heterocyclyl-1H-indole 13,19 14–17, or 19 with bis(3,4,5-trimethoxyphenyl)disulfide13 in the presence of sodium hydride in anhydrous DMF at 110 °C (150 W) for 2 min furnished 4–8 or 12 (Scheme 1).
Scheme 1. Synthesis of Compounds 4-12a.
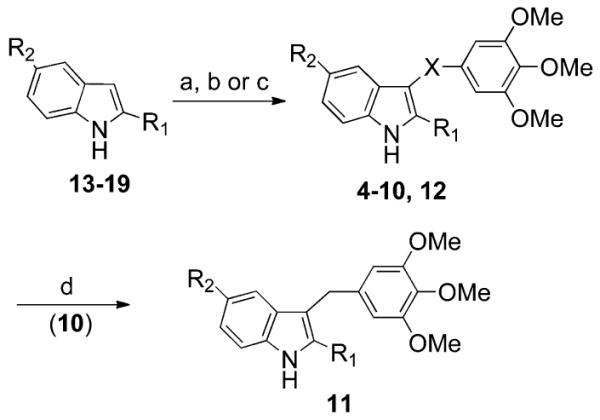
a4–12; see Table 1. 13:24 R1 = 1H-pyrrol-2-yl, R2 = H. 14: R1 = 1-(benzenesulfonyl)-1H-pyrrol-3-yl, R2 = H. 15: R1 = furan-2-yl, R2 = H. 16: R1 = furan-3-yl, R2 = H. 17: R1 = thiophen-2-yl, R2 = H. 18: R1 = thiophen-2-yl, R2 = OMe. 19: R1 = thiophen-3-yl, R2 = H. Reagents and reaction conditions: (a) (for 4–8 and 12) (i) NaH, anhydrous DMF, 25 °C, 10 min; (ii) bis(3,4,5-trimethoxyphenyl)disulfide, closed vessel, 150 W, 110 °C, 2 min, yield 10–83%; (b) (for 9) (i) NaH, anhydrous DMF, 0 °C, Ar stream, 15 min; (ii) bis(3,4,5-trimethoxyphenyl)disulfide, 110 °C, Ar stream, overnight, yield 70%; (c) (for 10) 3,4,5-trimethoxybenzoyl chloride, anhydrous AlCl3, 1,2-dichloroethane, closed vessel, 150 W, 110 °C, 2 min, yield 34%; (d) (for 11) NaBH4 (10 equiv), ethanol, reflux, 2.5 h, yield 21%.
Compound 10 was prepared from 17 and 3,4,5-trimethoxybenzoyl chloride in the presence of anhydrous aluminum chloride in 1,2-dichloroethane at 110 °C (150 W) for 2 min. Sodium borohydride (10 equiv) reduction of 10 in boiling ethanol provided 11. Derivative 9 was obtained by heating the corresponding indole 18 with the disulfide13 in the presence of sodium hydride in anhydrous DMF.
The acid chloride of 20 was treated with 1-(phenylsulfonyl)-1H-pyrrole in the presence of anhydrous aluminum chloride to give the intermediate 21, which underwent intramolecular cyclization to 14 with iron powder in glacial acetic acid at 60 °C (Scheme 2a). Treatment of 2-acetylfuran with phenylhydrazine hydrochloride in the presence of anhydrous sodium acetate in an open vessel at 80 °C (250 W) for 5 min furnished hydrazone 23, which was converted to 15 by heating at 110 °C with polyphosphoric acid (PPA) for 1 h (Scheme 2b). Reaction of 2-iodo-1H-indole20 (24) with the pinacol ester of furan-3-boronic acid in the presence of Pd(II) acetate and potassium carbonate in a closed vessel at 110 °C (200 W) for 15 min gave 16 (Scheme 2c).
Scheme 2. Synthesis of Compounds 14-19a.
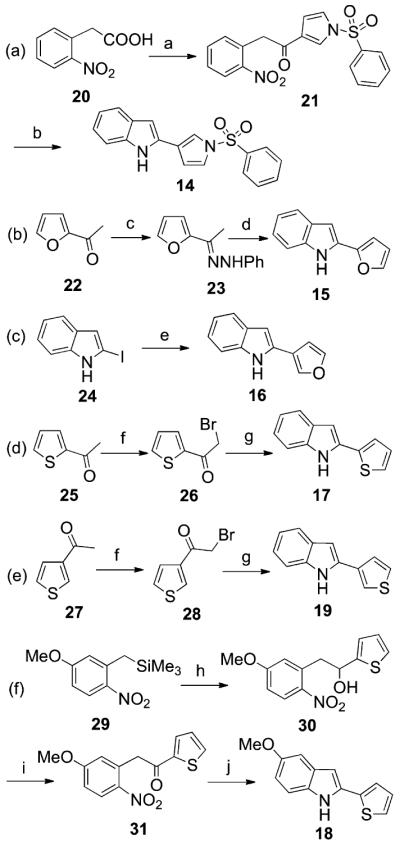
aReagents and conditions: (a) (i) oxalylchloride, catalytic anhydrous DMF, 1,2-dichloroethane, 0 °C, Ar stream, 30 min; (ii) 1-(phenylsulfonyl)-1H-pyrrole, AlCl3, 0 °C, Ar stream, 15 min, yield 10%; (b) Fe, AcOH, 60 °C, overnight, yield 10%; (c) phenylhydrazine hydrochloride, anhydrous CH3COONa, ethanol, open vessel, 250 W, PowerMAX, 80 °C, 5 min, yield 94%; (d) PPA, 110 °C, 1 h, yield 55%; (e) 3-furan boronic acid pinacol ester, Pd(II) acetate, potassium carbonate, 1-methyl-2-pyrrolidinone/water, closed vessel, 200 W, 110 °C, 15 min, yield 95%; (f) bromine, dichloromethane, 25 °C, 1 h, yield 57–80%; (g) (i) aniline, 25 °C, 3 h; (ii) catalytic anhydrous DMF, closed vessel, 150 W, 100 °C, 1 min, yield 16–40%; (h) thiophen-2-carboxaldehyde, TBAF, anhydrous THF, 25 °C, Ar stream, 15 min, yield 61%; (i) pyridinium chlorochromate, anhydrous CH2Cl2, 25 °C, 1.5 h, yield 56%; (j) tin(II) chloride dihydrate, AcOEt, reflux, 3 h, yield 21%.
2-Acetyl- (25) and 3-acetylthiophene (27) were brominated to 26 and 28 and transformed into 17 or 19, respectively, by reaction with aniline in the presence of a catalytic amount of DMF in a closed vessel at 100 °C (150 W) for 1 min (Scheme 2d and e). Reaction of (5-methoxy-2-nitrobenzyl)-trimethylsilane21 (29) with thiophen-2-carboxaldehyde in the presence of tetrabutylammonium fluoride (TBAF) provided alcohol 30, which was oxidized to 31 with pyridinium chlorochromate. Tin(II) chloride reduction of 31 and subsequent intramolecular cyclization of the amino intermediate furnished 18 (Scheme 2f).
RESULTS AND DISCUSSION
Inhibition of Tubulin Polymerization
In a first set of experiments, we assessed the ability of ATIs 4–12 to inhibit tubulin polymerization in vitro (Table 1). The new ATIs inhibited tubulin polymerization with IC50 values ranging from 0.74 to 1.9 μM, as compared with 1.0 μM for CSA4 (2), 3.2 μM for colchicine (1), and 2.9 μM for compound 3.14 As tubulin polymerization inhibitors, 6–10 and 12 were equal to or more potent than 2, with the most potent inhibitor being 8, which had an IC50 of 0.74 μM. Replacement of the sulfur bridging atom of 8 with a carbonyl functionality led to ketone 10, which inhibited tubulin polymerization with an IC50 of 1.0 μM.
Table 1. Inhibition of Tubulin Polymerization, Growth of MCF-7 Human Breast Carcinoma Cells, and Colchicine Binding by Compounds 1–12.
 |
||||||
|---|---|---|---|---|---|---|
| Compd | R1 | R2 | X | Tubulin Assemblya IC50 ± SD (μM) |
MCF-76b IC50 ± SD (nM) |
Inhibition of Colchicine Bindingc (% ± SD) |
| 4 |
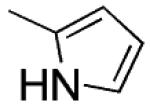
|
H | s | 1.1 ±0.05 | 18±6 | 92 ± 0.6 |
| 5 |
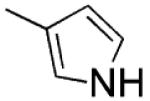
|
H | s | 1.2 ±0.2 | 20 ±0 | 85±1 |
| 6 |
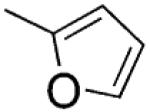
|
H | s | 1.0±0.1 | 45 ±4 | 80 ±1 |
| 7 |
|
H | s | 1.0±0.1 | 33 ±5 | 93 ±4 |
| 8 |

|
H | s | 0.74 ± 0.05 | 39±10 | 88 ±2 |
| 9 |

|
OMe | s | 0.98 ±0.08 | 58 ±4 | 86 ±2 |
| 10 |
|
H | CO | 1.0±0.1 | 36 ±6 | 75 ±3 |
| 11 |

|
H | CH2 | 1.9 ±0.2 | 200 | 48 ±5 |
| 12 |
|
H | S | 0.91 ±0.2 | 60 ±20 | 85 ± 0.4 |
| 1 | - | - | - | 3.2 ±0.4 | 5±1 | - |
| 2 | - | - | - | 1.0 ±0.1 | 13 ±3 | 99 ±0.3 |
| 3 d | COOEt | H | s | 2.9 ±0.1 | 40 ±2 | 51 ±3 |
Inhibition of tubulin polymerization. Tubulin was 10 μM during polymerization.
Inhibition of growth of MCF-7 human breast carcinoma cells.
Inhibition of [3H]colchicine binding: tubulin was at 1 μM, both [3H]colchicine and inhibitor were at 5 μM.
Reference 11.
The new ATIs were also examined for potential inhibition of the binding of [3H]colchicine to tubulin (Table 1). All except 11 were strong inhibitors of the binding reaction (75–92% inhibition, although not quite as potent as CSA4). In this assay, the strongest inhibition was observed with compounds 4 and 7.
Cell Growth Inhibition
All the new ATIs, except compound 11, inhibited the growth of human MCF-7 nonmetastatic breast cancer epithelial cells with IC50 values ranging from 18 to 60 nM, with the most active compounds being 4 and 5 (Table 1). The antiproliferative effect of compounds 5 and 8–11 was evaluated in four additional cancer cell lines in comparison with 2 and doxorubicin (DOX), a DNA-targeting drug often employed in association with antimitotic agents (Table 2). Compounds 8 and 10 were generally 1 order of magnitude more potent as growth inhibitors of HeLa (cervix), PC3 (prostate), HT-29 (colon), A549 (nonsmall cell lung), and 231-MDA (metastatic breast) carcinoma-derived cell lines as compared with DOX. The effect of 9 went from 2- to 3-fold more potent than DOX to equimolar, depending on the cell line.
Table 2. Inhibition of Growth of HeLa, PC3, HT29, and A549 Cell Lines by Compounds 5 and 8–11a,b.
| IC50 ± SD (μM) |
||||
|---|---|---|---|---|
| compd | HeLa | PC3 | HT-29 | A549 |
| 5 | 0.4 ± 0.02 | 0.5 ± 0.1 | 0.1 ± 0.03 | 0.08 ± 0.02 |
| 8 | 0.09 ± 0.002 | 0.2 ± 0.05 | 0.15 ± 0.03 | 0.09 ± 0.02 |
| 9 | 0.4 ± 0.02 | 0.8 ± 0.08 | 0.4 ± 0.02 | 0.3 ± 0.09 |
| 10 | 0.07 ± 0.004 | 0.1 ± 0.08 | 0.08 ± 0.01 | 0.08 ± 0.01 |
| 11 | 1 ± 0.03 | 2 ± 0.1 | 1 ± 0.05 | 2 ± 0.08 |
| 2 | 0.2 ± 0.005 | 0.4 ± 0.02 | >10 | >10 |
| DOXc | 1.5 ± 0.03 | 1.7 ± 0.02 | 1.0 ± 0.04 | 1.0 ± 0.08 |
Growth inhibition of the indicated cell lines (MTT method); incubation time was 48 h.
Plots of 231-MDA and A549 cell growth inhibition by compounds 5 and 8–10 are shown in Figures 1S–4S of the Supporting Information.
Doxorubicin as reference compound.
Compound 5 was highly effective in the HT-29 and A549 cell lines and had efficacy comparable with that of 9 in the HeLa and PC3 cell lines. As growth inhibitors of HeLa and PC3 cells, compounds 8 and 10 were more potent than 2, while 5 and 9 were generally less potent. As compared with 2, compounds 5 and 8-11 were superior as inhibitors of the growth of HT-29 and A549 cell lines. Compound 11 was generally comparable with DOX, but it was less potent than 2 as inhibitor of HeLa and PC3 cells growth. These data underscore the effectiveness of ATIs 5 and 8–10 in transformed cell types. Such results also highlighted a differential sensitivity to MT-targeting drugs displayed by cell lines with different genetic backgrounds, consistent with results obtained with other drugs that target the mitotic apparatus.22,23
We analyzed growth inhibition in an ovarian cancer model with high drug sensitivity (A2780wt), its cisplatin-resistant counterpart (A2780-CIS), and a cell line derived from a cisplatin-resistant patient (OVCAR-3) (Table 3). For the acquired cisplatin-resistance (RI-1) model, compounds 5 and 10 yielded even lower IC50 values than in the parental line, in contrast to the almost 20-fold resistance to cisplatin. On the other hand, such an increase was not detectable in the endogenous resistance model, as the resistance values (RI-2) for the two ATIs were essentially identical to that obtained with cisplatin in OVCAR-3.
Table 3. Growth Inhibition in A2780wt Cells, Its Cisplatin Resistant Counterpart A2780-CIS, and OVCAR-3 by Compounds 5 and 10.
| IC50 ± SD (nM) |
|||||
|---|---|---|---|---|---|
| compd | A2780wt | A2780-CIS | OVCAR-3 | RI-1a | RI-2b |
| 5 | 21.5 ± 1.2 | 6.3 ± 1.8 | 81 ± 21 | 0.29 | 3.8 |
| 10 | 30.5 ± 0.7 | 29.3 ± 3.2 | 117 ± 18 | 0.96 | 3.8 |
| cisplatin | 485 ± 60 | 8980 ± 565 | 1816 ± 254 | 18.5 | 3.7 |
RI-1 (Resistant Index-1) was calculated by dividing the IC50 obtained in A2780-CIS by the IC50 obtained in A2780wt.
RI-2 (Resistant Index-2) was calculated by dividing the IC50 obtained in OVCAR-3 by the IC50 obtained in A2780wt. A value >1 or <1 means either increased cisplatin-resistance or sensitivity, respectively.
Pgp Overexpressing MDR Cell Lines
Compounds 5, 8, and 10 were compared with vinorelbine (VRB), vinblastine (VBL), PTX, and 2 in the OVCAR-8 and NCI/ADR-RES cell lines (Table 4). Derived from OVCAR-8, NCI/ADR-RES is a DOX-resistant cell line that overexpresses P-glycoprotein (Pgp), resulting in the type 1 multidrug-resistance phenotype. Compounds 5, 8, and 10 were uniformly more active in the NCI/ADR-RES line than in the parental OVCAR-8 line. In contrast, VRB and VBL showed the typical multidrug resistance differential, as did PTX.
Table 4. Growth Inhibition of OVCAR-8 and NCI/ADR-RES Cells Lines by Compounds 5, 8, and 10 and Reference Compounds VRB, VBL, PTX, and 2.
| IC50 ± SDa (nM) |
||
|---|---|---|
| compd | OVCAR-8b | NCI/ADR-RESc |
| 5 | 70 ± 30 | 25 ± 7 |
| 8 | 45 ± 20 | 25 ± 7 |
| 10 | 20 ± 10 | 15 ± 7 |
| VRBd | 300 ± 0 | 5000 ± 1000 |
| VBLe | 15 ± 7 | 200 ± 0 |
| PTX | 2 ± 0.7 | 1500 ± 700 |
| 2 | 1.3 ± 0.6 | 1.3 ± 0.6 |
Cells were grown in RPMI 1640 medium with 5% FBS, 5% CO2 atmosphere at 37 °C, for 96 h.
OVCAR-8: ovarian tumor cell line 8.
NCI/ADR-RES: DOX-resistant cell line derived from OVCAR-8.
Vinorelbine, tubulin assembly inhibition = 3.1 ± 0.2 μM.
Vinblastine, tubulin assembly inhibition = 1.1 ± 0.2 μM.
CSA4 yielded the same IC50 in both cell lines and clearly was not a Pgp substrate. Most importantly, as NCI/ADR-RES cell growth inhibitors, ATIs 5, 8, and 10 were all superior to VRB, VBL, and PTX. These compounds were from 200- (5 and 8) to 333-fold (10) more potent than VRB, from 13- (5 and 8) to 8-fold (10) more potent than VBL, and from 100- (5 and 8) to 60-fold (10) more potent than PTX.
Nontransformed Cell Lines
A recurrent problem with MT-targeting drugs is their widespread toxicity on normal cells when used in human patients.2,24,25 We therefore used nontransformed cells to evaluate potential differences between compounds 5 and 11, as representatives of one of the more potent ATIs and the least potent in the current series (Table 5). Both compounds 5 and 11 had somewhat greater antiproliferative effects in MCF-7 breast cancer cells as compared with several nontransformed cell lines, with the difference being greater for 5 than 11. Both compounds showed less differential activity, however, than did PTX, and 2 was the least selective of the compounds evaluated.
Table 5. Growth Inhibition of MCF-7, HOSMAC, A10, PtK2, and HUVEC Cell Lines by Compounds 2, 5, and 11 and PTX.
| IC50 ± SDa (nM) |
|||||
|---|---|---|---|---|---|
| compd | MCF-7 | HAOSMCb | A10c | PtK2d | HUVECe |
| 5 | 20 ± 0 | 33 ± 10 | 40 ± 30 | 60 ± 0 | 30 ± 0 |
| 11 | 200 ± 0 | 250 ± 90 | 150 ± 90 | 300 ± 0 | 180 ± 40 |
| 2 | 13 ± 3 | 5 ± 3 | 1±1 | 3±1 | 1 ± 1 |
| PTXf | 3 ± 0.5 | 6±6 | 38 ± 10 | 21 ± 8 | 7±4 |
SD of 0 indicates the same value was obtained in all experiments.
HAOSMC: human aortic smooth muscle cells (ATCC #CLR-1999).
A10, rat embryonic aortic smooth muscle cells (ATCC #CRL-1476).
PtK2: Potorous tridactylis kidney epithelial cells (ATCC #CLL-56).
HUVEC: human umbilical vein endothelial cells (ATCC #CRL-2873).
Data from ref 16.
Cell Cycle Analysis
To further characterize the cell growth inhibitory properties of the new ATIs, compounds 5 and 8–11 were analyzed for their effects on the cell cycle in parallel with VBL and 2 (Figure 1). Twenty-four hours after plating, HeLa cells were exposed to each compound for 24 h, and the cell cycle profile was subsequently analyzed by flow cytometry. We found that, for 5, 8, and 10 at 100 nM, live cell imaging (Figure 1, column A) indicates that cultures exposed to these ATIs progressed in the cell cycle up to the point where they would normally assemble the mitotic apparatus; at this point, the ATIs inhibited this assembly and prevented further progression into mitosis, inducing 70–90% of all the cells to accumulate with a G2/M DNA content (Figure 1, panels B–C), similar to VBL and 2 (80–90% G2/M arrest).
Figure 1.

Effect of ATIs on HeLa cell cycle progression. (A) Bright-field panels from HeLa cell cultures exposed for 24 h to solvent (DMSO) or to the indicated compounds (VBL and 2 are shown at 20 nM; all other compounds at 100 nM). Rounded, highly refractive cells blocked in mitosis are clearly distinguishable from flattened interphase cells (10× objective). (B) Representative flow cytometry profiles of cultures exposed to compounds at the same concentrations as in part A. Cells stained with propidium iodide (PI) were separated according to their DNA content, calculated from the emitted PI fluorescence (x axis); the y axis indicates the number of cells. The 2C peak (diploid DNA content) identifies G1 cells; the 4C peak (tetraploid DNA content) identifies G2/M cells. Cells with intermediate DNA contents are in the S phase. C. Bars represent the percent of G2/M cells (4C genomic content) (mean values ± SD were from two to six independent experiments).
The cell cycle effects of ATIs 8 and 10 were further examined in the A549 and HT29 cell lines. Both 8 and 10 induced a gradual accumulation of cells in the G2/M phase of the cell cycle in a dose-dependent manner, and this could be detected as early as 7 h after initiation of treatment. In these cells we evaluated both the cell cycle profile and the accumulation of cyclin B1, following treatment with the compounds (Figure 2).
Figure 2.

Dose-dependent cell cycle effects of ATI 10 in A549 and HT29 cell cultures. (A) Typical cell cycle profiles after flow cytometric analysis of A549 cell populations treated with DMSO only or with ATI 10 (100 nM, 7 h). (B) The histograms represent the percent of cells with G1, S, and G2/M DNA content, based on flow cytometric analyses of A549 cells exposed to increasing micromolar concentrations of ATIs 8 and 10 (7 h). (C) Cyclin B1 accumulation in A549 and HT29 cell lines exposed to the indicated micromolar concentrations of 10 (7 h), with actin (Act) as a loading control (Santa Cruz Biotechnology).
Mitotic Index
Both flow cytometry and the Western blot assay for cyclin B1 provide information about the entire cell population. Yet, these experiments do not provide definitive proof that the cells are actually arrested in mitosis. True arrest in mitosis would be a desirable outcome of tubulin inhibitory treatment from a therapeutic perspective, because (1), by definition, dividing cells would be selectively targeted while resting, interphase cells would be spared and (2) sustained mitotic arrest can trigger a specific cell death pathway with molecular features, such as the independence from p53, common to many tumors.26 The mitotic cell death pathway can therefore operate effectively in tumor cells, including those harboring p53 mutations, differently from the classical apoptotic response induced by DNA damage that requires functional p53. To ascertain whether ATIs with cell cycle inhibitory activity induce true mitotic arrest, we processed treated cells for immunofluorescence by staining with an antibody directed against α-tubulin and with the DNA dye 4′,6-diamidino-2-phenylindole (DAPI). Treated and control cells were then scored for their mitotic index (MI), calculated as mitotic cells/(mitotic + interphase cells). In control cultures, about 10% of cells were in the various stages of mitosis, with well-formed spindles interacting with condensed chromosomes (Figure 3A). In cultures exposed to ATI 5, 8, or 10, over 60% of the cells were arrested in a prometaphase-like state, with condensed chromosomes and sparse foci of tubulin that failed to elongate to form the spindle microtubules (Figure 3B). Thus, the accumulation of G2/M cells detected by flow cytometry reflected a true mitotic arrest. The MI in cell populations treated with 5, 8, and 10 was significantly higher compared with treatment with the weak tubulin inhibitor 11. The MIs observed with 5 and 10 were in the same range as with 2 and VBL, although a higher concentration of the ATIs was required (Figure 3C). Compound 9 was less effective in inducing mitotic arrest and reproducibly yielded a MI of about 35%.
Figure 3.
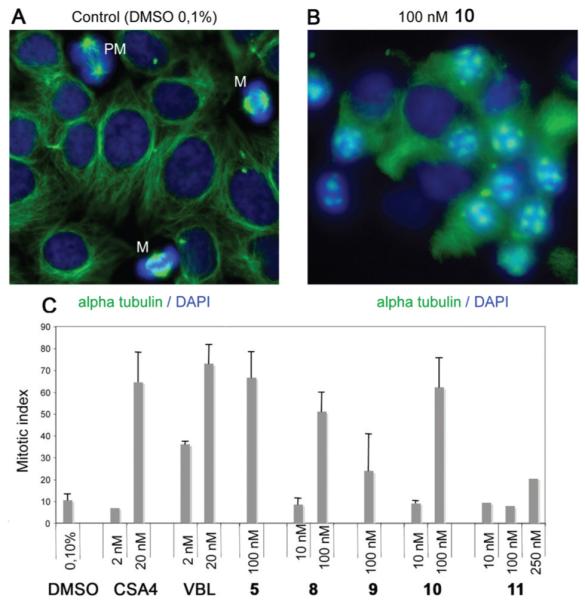
Induction of mitotic arrest by ATIs. (A) HeLa control cultures exposed to DMSO solvent (0.1%, 24 h). MTs were visualized by α-tubulin staining (green) and chromosomes by DNA staining (blue). Most cells were in the interphase. Cells in mitosis (PM, prometaphase; M, metaphase) are indicated. (B) A typical field from a HeLa culture exposed to ATI 10 (100 nM, 24 h). Note that most cells were arrested in early mitotic stages, with condensed chromosomes and a failure to assemble proper MTs. Disorganized tubulin foci are seen throughout the mitotic cells. (C) MIs in HeLa cell cultures that were treated with DMSO solvent, with known anti-MT compounds, or with ATIs 5 and 8–11 (mean values ± SD were calculated from two to four independent experiments).
Caspase-3 Expression
The data at this point indicated that most ATIs that effectively inhibited tubulin polymerization in vitro arrested mitotic progression in cultured cells, thereby causing decreased cell proliferation in human transformed cell lines. To investigate more closely the link between mitotic arrest and reduced cell growth, we analyzed HeLa cell populations exposed to 5 and 8–11 for induction of cell death under the same conditions used in the mitotic arrest experiments. Control cultures were compared with cultures treated with ATIs 5, 8, and 10 for their reactivity to annexin V, which binds to phosphatidylserine residues that are translocated from the inner to the outer cell membrane in early apoptosis. Annexin V-reactive cells were quantitated by flow cytometry (Figure 4A). The results showed that 5, 8, and 10 induced apoptosis as efficiently as 2 and VBL at the concentrations examined. To extend these results, we analyzed the induction of caspase-3 expression at the single cell level. Caspase-3 regulates the induction of apoptosis in mitotic cells, and it is required for the apoptotic response to MT-targeting drugs.1,27 Immunofluorescence showed that 5, 8, and 10, but not 11, induced caspase-3 activity in a significant fraction of cells (an apoptotic cell treated with 10 is shown in Figure 4B), further demonstrating the strong link between the ability of ATIs to arrest mitotic progression and to induce apoptosis.
Figure 4.

Induction of apoptosis by ATIs. (A) Typical flow cytometry studies of HeLa cell populations incubated with annexin V after exposure to DMSO only (control) or to 10 (100 nM). The histograms represent the percent apoptotic cells, as determined by annexin V-reactivity, after exposure to the indicated compounds for 24 h (means ± SD were calculated from two to three experiments). (B) Single-cell level immunofluorescence analysis revealed induction of active caspase-3 (recognized by a specific antibody). The panels depict typical fields from HeLa cultures exposed to only DMSO (note the two cells progressing through mitosis) or to 10 (a mitotic cell expressing active caspase-3 is indicate by the arrow among a group of cells arrested in mitosis).
Metabolic Stability
An initial study with compound 3 confirmed our fears that it would be metabolically unstable, arguing against its potential as a therapeutic agent. With both mouse and human microsomal preparations, 3 was totally degraded in 30 min (Table 6). Having prepared 5, 8, and 10 and the other five-member heterocycle ATIs with the idea that they should overcome this metabolic instability, we examined these compounds in a standard microsomal stability assay (Table 6), in comparison with the control compounds 7-ethoxycoumarin and propanolol. This assay, using both human and mouse liver microsomes, estimates compound stability to phase I oxidative metabolism. Compounds 5 and 10 showed medium and low metabolic stability (see Table 6 legend for definitions of relative stabilities), respectively, with both the human and mouse liver microsomes, while 8 exhibited medium stability with the human microsomes and low stability with the mouse microsomes. The metabolic stability of 5, 8, and 10 may be dependent on the nature of the 2-heterocyclic nucleus rather than the structure of the bridging group. Such an effect may be explained by the steric hindrance exerted by the two aromatic moieties attached to the bridging group.
Table 6. Metabolic Stability of 5, 8, and 10 with Human and Mouse Liver Microsomesa.
| % remaining at 30 minb |
||
|---|---|---|
| compd | human liver microsomes | mouse liver microsomes |
| 5 | 34.8 ± 1.4 | 23.1 ± 0.6 |
| 8 | 22.0 ± 1.0 | 2.2 ± 0.3 |
| 10 | 4.6 ± 0.2 | 0.60 ± 0.01 |
| 3 | 0.37 ± 0.01 | 0.5 ± 0.03 |
| 7-ethoxycoumarinc | 6.6 ± 0.2 | 0.07 ± 0.02 |
| propanololc | 54.1 ± 0.4 | 20.6 ± 0.5 |
Metabolic stability: >95, high; 50–95, good; 10–50, medium; <10, low.
Results are expressed as mean ± SD, n = 2.
The standard compounds 7-ethoxycoumarin and propanolol showed metabolic stability in agreement with the literature and internal validation data.28
Aqueous Solubility
The aqueous solubility of 5 was 4 times greater than that of compound 3, as a result of the substitution of the pyrrole nucleus for the ester moiety. The aqueous solubility of 5 at pH 7.4 was 20 μM, while under the same conditions the solubility of 3 was 5 μM. This improvement in the aqueous solubility of 5 may be the explanation for the greater activity of 5 relative to 3 as an inhibitor of tubulin polymerization and MCF-7 cell growth, although the molecular modeling studies presented above suggest that 5 should bind more tightly than 3 to tubulin.
iv and os Pharmacokinetics
Finally, the intravenous pharmacokinetic and oral bioavailability of 5 was investigated in the mouse. Pharmacokinetic studies were carried out in male CD-1 mice. The compound was administered either in single intravenous (iv) injections of 5 mg/kg or in an oral (os) dose of 15 mg/kg. The main pharmacokinetic parameters obtained are summarized in Table 7. Compound 5 showed a systemic plasma clearance slightly lower than the hepatic blood flow of 86 mL/min·kg in mice, an estimated elimination half-life of 40 min, and a calculated steady state volume of distribution suggestive of good tissue distribution. Moreover, the compound was quickly absorbed after oral administration and showed a very high oral bioavailability. Profiles of distribution in plasma of 5 after iv and os administration and a comparison of the kinetic profiles are shown in Figures 5S and 6S, respectively, in the Supporting Information.
Table 7. Pharmacokinetic Properties of 5 in Mice.
| parameter | value |
|---|---|
| Cmaxa(iv) (ng/mL) | 35.67 |
| AUC0–∞b(iv) (ng·min/mL) | 174346 |
| t½c (min) | 40 |
| Cld (mL/min·kg) | 28.6 |
| Vsse (L/kg) | 1.59 |
| Cmaxa(os) (ng/mL) | 1340 |
| tmaxf(os) (min) | 120 |
| AUC0–∞b(os) (ng·min/mL) | 583315 |
| Fg (%) | 110 |
Maximum concentration.
Area under the curve calculated up to the 0–∞ time point.
Half-time.
Clearance.
Mean distribution volume.
max-time.
Oral bioavailability.
CONCLUSION
We designed new ATIs by replacing the 2-methoxy-/ ethoxycarbonyl group (A region) with a bioisosteric 5-membered heterocycle nucleus. The newly synthesized ATIs showed effective tubulin inhibitory properties in vitro and potential therapeutic value in cancer treatment. The ATIs described here have significantly improved efficacy compared with the previously synthesized 3 used as a reference and compared well with classical MT inhibitors. In particular, the new ATIs 5, 8, and 10 showed a valuable biological profile: (i) they were potent tubulin polymerization inhibitors in the low/ submicromolar range of concentration; (ii) such compounds were uniformly more active in the Pgp-overexpressing NCI/ADR-RES cell line than in the parental OVCAR-8 line and were superior to VRB, VBL, and PTX; (iii) compounds 5 and 10 showed selective activity against cells with acquired cisplatin resistance; (iv) they reduced cell growth in a panel of human transformed cell lines via arrest of mitotic progression and induction of cell death; (v) the induction of mitotic arrest in cell populations treated with these ATIs was in the same range as was observed with CSA4 and VBL; (vi) they induced apoptosis in the same range or above the level induced by VBL and CSA4 and triggered caspase-3 activation; (vii) the sulfur bridging group of ATIs showed satisfactory metabolic stability. We would like to highlight their effectiveness in the HeLa and 231-MDA cell lines, both of which lack functional p53: this indicates that the cell death pathway triggered by ATIs is p53-independent. This is of relevance from a therapeutic perspective, given that about 50% of all human tumors are defective for p53 function and cannot respond to DNA-targeting drugs, which induce p53-dependent apoptosis. On the whole, the present data strongly support the therapeutic potential and further development of the new ATIs described here. Finally, the metabolic stability of compound 5, obtained in both mouse and human microsomes, along with the excellent mouse pharmacokinetic profile, warrant further in vivo efficacy studies.
EXPERIMENTAL SECTION
Chemistry
MW-assisted reactions were performed on a Discover S-Class (CEM) single mode reactor, controlling instrument parameters with PC-running Synergy 1.4 software. Temperature, irradiation power, maximum pressure (Pmax), PowerMAX (in situ cooling during the MW irradiation), ramp and hold times, and open and closed vessel modes were set as indicated. Reactions in an open vessel were carried out in 100 mL round-bottom flasks equipped with a Dimroth reflux condenser and a cylindrical stirring bar (length 20 mm, diameter 6 mm). Reactions in a closed vessel were performed in capped MW-dedicated vials (10 mL) with a cylindrical stirring bar (length 8 mm, diameter 3 mm). The temperature of the reaction was monitored with a built-in infrared (IR) sensor. After completion of the reaction, the mixture was cooled to 25 °C via air-jet cooling. Melting points (mp’s) were determined on a SMP1 apparatus (Stuart Scientific) and are uncorrected. IR spectra were run on a SpectrumOne FT-ATR spectrophotometer (Perkin-Elmer). Band position and absorption ranges are given in inverse centimeters. Proton nuclear magnetic resonance (1H NMR) spectra were recorded on a 400 MHz FT spectrometer (Bruker) in the indicated solvent. Chemical shifts are expressed in δ units (ppm) from tetramethylsilane. Mass spectra were recorded on a Bruker MicroTOF LC column. Column chromatography was performed on columns packed with alumina from Merck (70–230 mesh) or silica gel from Macherey-Nagel (70–230 mesh). Aluminum oxide thin layer chromatography (TLC) cards from Fluka (aluminum oxide precoated aluminum cards with fluorescent indicator visualizable at 254 nm) and silica gel TLC cards from Macherey-Nagel (silica gel precoated aluminum cards with fluorescent indicator visualizable at 254 nm) were used for TLC. Developed plates were visualized with a Spectroline ENF 260C/FE UV apparatus. Organic solutions were dried over anhydrous sodium sulfate. Evaporation of the solvents was carried out on a Büchi Rotavapor R-210 equipped with a Büchi V-850 vacuum controller and Büchi V-700 and V-710 vacuum pumps. Elemental analyses of the new compounds were found within 0.4% of the theoretical values. The purity of tested compounds was >95%. Compounds 20, 22, 25, and 27 were purchased from Sigma-Aldrich.
General Procedure for the Preparation of Compounds 4–8 and 12. Example. 2-(1H-Pyrrol-2-yl)-3-[(3′,4′,5′-trimethoxyphenyl)thio]-1H-indole (4)
2-(1H-Pyrrol-2-yl)-1H-indole19 (13) (0.25 g, 0.0014 mol) was carefully added to a suspension of sodium hydride (60% in mineral oil, 0.13 g, 0.0031 mol) in anhydrous DMF (2 mL) while stirring. After 10 min, bis(3,4,5-trimethoxyphenyl)disulfide13 (0.62 g, 0.0015 mol) was added, and the reaction mixture was placed into the MW cavity (closed vessel mode, Pmax = 250 PSI). MW irradiation of 150 W was used, the temperature being ramped from 25 to 110 °C while stirring. Once 110 °C was reached, taking about 1 min, the reaction mixture was held there for 2 min. The mixture was diluted with water and extracted with ethyl acetate. The organic layer was washed with brine and dried. Removal of the solvent gave a residue that was purified by column chromatography (alumina, chloroform as eluent) to furnish 4 (0.1 g, 19%), mp 215–218 °C (from ethanol). 1H NMR (DMSO-d6): δ 3.52 (s, 6H), 3.55 (s, 3H), 6.18 (t, J = 2.9 Hz, 1H), 6,34 (s, 2H), 6.81 (d, J = 2.4 Hz, 1H), 6.96 (br s, 1H), 7.04–7.08 (m, 1H), 7.12–7.16 (m, 1H), 7.42 (d, J = 8.1 Hz, 2H), 11.11 (br s, 1H, disappeared on treatment with D2O), 11.64 ppm (br s, 1H, disappeared on treatment with D2O). MS: ES+ = 381 (MH+). IR: ν 3329, 3422 cm−1. Anal. (C21H20N2O3S (380.46)) C, H, N, S.
2-(1H-Pyrrol-3-yl)-3-[(3′,4′,5′-trimethoxyphenyl)thio]-1H-indole (5)
Synthesized as 4, starting from 14, yield 10% as a brown solid, mp 200–204 °C (from ethanol). 1H NMR (DMSO-d6): δ 3.52 (s, 6H), 3.56 (s, 3H), 6.33 (s, 2H), 6.75–6.77 (m, 1H), 6.84–6.86 (m, 1H), 7.00–7.04 (m, 1H), 7.08–7.12 (m, 1H), 7.39 (d, J = 8.6 Hz, 2H), 7.48–7.50 (m, 1H), 11.11 (br s, 1H, disappeared on treatment with D2O), 11.58 ppm (br s, 1H, disappeared on treatment with D2O). MS: ES+ = 381 (MH+). IR: ν 3358, 3390 cm−1. Anal. (C21H20N2O3S (380.46)) C, H, N, S.
2-(Furan-2-yl)-3-[(3′,4′,5′-trimethoxyphenyl)thio]-1H-indole (6)
Synthesized as 4, starting from 15, yield 38% as a white solid, mp 180–184 °C (from ethanol). 1H NMR (CDCl3): δ 3.65 (s, 6H), 3.77 (s, 3H), 6.38 (s, 2H), 6.54 (q, J = 1.8 Hz, 1H), 7.17–7.20 (m, 1H), 7.24–7.25 (m, 2H), 7.44 (d, J = 8 Hz, 1H), 7.50 (m, 1H), 7.67 (d, J = 8 Hz, 1H), 8.94 ppm (br s, 1H, disappeared on treatment with D2O). MS: ES+ = 382 (MH+). IR: ν 3333 cm−1. Anal. (C21H19NO4S (381.44)) C, H, N, S.
2-(Furan-3-yl)-3-[(3′,4′,5′-trimethoxyphenyl)thio]-1H-indole (7)
Synthesized as 4, starting from 16, yield 42% as a brown solid, mp 185–190 °C (from ethanol). 1H NMR (DMSO-d6): δ 3.64 (s, 6H), 3.76 (s, 3H), 6.34 (s, 2H), 6.87 (m, 1H), 7.16 (t, J = 7.5 Hz, 1H), 7.22–7.26 (m, 1H), 7.41 (d, J = 8.0 Hz, 1H), 7.51 (t, J = 1.6 Hz, 1H), 7.65 (dd, J = 0.6 and 7.8 Hz, 1H), 8.08–8.09 (m, 1H), 8.50 ppm (br s, 1H, disappeared on treatment with D2O). MS: ES+ = 382 (MH+). IR: ν 3330 cm−1. Anal. (C21H19NO4S (381.44)) C, H, N, S.
2-(Thiophen-2-yl)-3-[(3′,4′,5′-trimethoxyphenyl)thio]-1H-indole (8)
Synthesized as 4, starting from 17, yield 60% as a yellow solid, mp 195–198 °C (from ethanol). 1H NMR (DMSO-d6): δ 3.53 (s, 6H), 3.56 (s, 3H), 6.35 (s, 2H), 7.09–7.13 (m, 1H), 7.19–7.24 (m, 2H), 7.47–7.49 (m, 2H), 7.65 (dd, J = 1.1 and 5.0 Hz, 1H), 7.77 (dd, J = 1.1 and 3.7 Hz, 1H), 12.11 ppm (br s, 1H, disappeared on treatment with D2O). MS: ES+ = 398 (MH+). IR: ν 3317 cm−1. Anal. (C21H19NO3S2 (397.51)) C, H, N, S.
2-(Thiophen-3-yl)-3-[(3′,4′,5′-trimethoxyphenyl)thio]-1H-indole (12)
Synthesized as 4, starting from 19, yield 83% as a white solid, mp 220–225 °C (from ethanol). 1H NMR (CDCl3): δ 3.64 (s, 6H), 3.78 (s, 3H), 6.37 (s, 2H), 7.17–7.21 (m, 1H), 7.25–7.29 (m, 1H), 7.42–7.44 (m, 2H), 7.64 (dd, J = 1.3 and 5.0 Hz, 1H), 7.68 (d, J = 7.8 Hz, 1H), 7.85 (dd, J = 1.3 and 3.0 Hz, 1H), 8.62 ppm (br s, 1H, disappeared on treatment with D2O). MS: ES+ = 398 (MH+). IR: ν 3331 cm−1. Anal. (C21H19NO3S2 (397.51)) C, H, N, S.
5-Methoxy-2-(thiophen-2-yl)-3-[(3′,4′,5′-trimethoxyphenyl)thio]-1H-indole (9)
18 (0.19 g, 0.00083 mol) was added at 0 °C to a suspension of sodium hydride (60% in mineral oil, 0.05 g, 0.0012 mol) in anhydrous DMF (2 mL). After 15 min, bis(3,4,5-trimethoxyphenyl)disulfide14 (0.36 g, 0.00091 mol) was added, and the reaction was heated at 110 °C overnight under an Ar stream. After cooling, the mixture was carefully diluted with water and extracted with ethyl acetate. The organic layer was washed with brine and dried. Removal of the solvent gave a residue that was purified by column chromatography (silica gel, ethyl acetate/n-hexane 1:2 as eluent) to furnish 9 as a white solid (0.25 g, 70%), mp 55–58 °C (from ethanol). 1H NMR (CDCl3): δ 3.67 (s, 6H), 3.78 (s, 3H), 3.84 (s, 3H), 6.39 (s, 2H), 6.92 (dd, J = 2.5 and 8.7 Hz, 1H), 7.11–7.13 (m, 2H), 7.31 (dd, J = 0.5 and 8.7 Hz, 1H), 7.39 (dd, J = 1.1 and 5.1 Hz, 1H), 7.52 (dd, J = 1.1 and 3.7 Hz, 1H), 8.54 ppm (br s, 1H, disappeared on treatment with D2O). MS: ES+ = 428 (MH+). IR: ν 3301 cm−1. Anal. (C22H21NO4S2 (427.54)) C, H, N, S.
[2-(Thiophen-2-yl)-1H-indol-3-yl]-(3′,4′,5′-trimethoxyphenyl)methanone (10)
A mixture of 17 (0.25 g, 0.00125 mol), 3,4,5-trimethoxybenzoyl chloride (0.29 g, 0.00125 mol), and anhydrous aluminum chloride (0.17 g, 0.00125 mol) in anhydrous 1,2-dichloroethane (2 mL) was placed into the MW cavity (closed vessel mode, Pmax = 250 PSI). MW irradiation of 150 W was used, the temperature being ramped from 25 to 110 °C with stirring. Once 110 °C was reached, taking about 1 min, the reaction mixture was held there for 2 min. The reaction mixture was quenched on 1 N HCl/crushed ice and extracted with chloroform. The organic layer was washed with brine and dried. Removal of the solvent gave a residue that was purified by column chromatography (silica gel, ethyl acetate/n-hexane 3:7 as eluent) to furnish 10 as a yellow solid (0.17 g, 34%), mp 155–159 °C (from ethanol). 1H NMR (DMSO-d6): δ 3.75 (s, 6H), 3.88 (s, 3H), 6.96–6.98 (m, 1H), 7.08 (s, 2H), 7.20–7.24 (m, 2H), 7.30–7.34 (m, 2H), 7.45 (d, J = 8.0 Hz, 1H), 7.80 (d, J = 7.8 Hz, 1H), 8.73 ppm (br s, 1H, disappeared on treatment with D2O). MS: ES+ = 394 (MH+). IR: ν 1570, 3214 cm−1. Anal. (C22H19NO4S (393.46)) C, H, N, S.
2-(Thiophen-2-yl)-3-(3′,4′,5′-trimethoxybenzyl)-1H-indole (11)
A mixture of 10 (0.1 g, 0.00025 mol) and sodium borohydride (0.1 g, 0.0025 mol) in ethanol (10 mL) was heated to reflux for 2.5 h. After cooling, the reaction mixture was diluted with water and extracted with ethyl acetate. The organic layer was washed with brine and dried. Removal of the solvent gave a residue that was purified by column chromatography (silica gel, ethyl acetate/n-hexane 3:7 as eluent) to furnish 11 as a brown solid (0.02 g, 21%), mp 43–47 °C (from ethanol). 1H NMR (CDCl3): δ 3.73 (s, 6H), 3.80 (s, 3H), 4.27 (s, 2H), 6.47 (s, 2H), 7.07–7.13 (m, 2H), 7.19–7.23 (m, 2H), 7.35–7.39 (m, 2H), 7.49 (d, J = 7.9 Hz, 1H), 8.17 ppm (br s, 1H, disappeared on treatment with D2O). MS: ES+ = 380 (MH+). IR: ν 3340 cm−1. Anal. (C22H21NO3S (379.47)) C, H, N, S.
2-(2-Nitrophenyl)-1-[1-(phenylsulfonyl)-1H-pyrrol-3-yl]-ethan-1-one (21)
Oxalyl chloride (2.46 g, 1.64 mL, 0.019 mol) and a catalytic amount of anhydrous DMF were added at 0 °C to 20 (3.52 g, 0.019 mol) in anhydrous 1,2-dichloroethane (88 mL) under an Ar stream. After 30 min, 1-(phenylsulfonyl)-1H-pyrrole (4.04 g, 0.0019 mol) and anhydrous aluminum chloride (2.59 g, 0.0019 mol) were added. The reaction mixture was stirred at 0 °C for 25 min, quenched on 1 N HCl/crushed ice, and extracted with chloroform. The organic layer was washed with brine and dried. Removal of the solvent gave a residue that was purified by column chromatography (silica gel, acetone/n-hexane 1:2 as eluent) to furnish 21 as a yellow solid (0.7 g, 10%), mp 135 °C (from ethanol). 1H NMR (DMSO-d6): δ 4.45 (s, 2H), 6.41–6.43 (m, 1H), 7.25–7.30 (m, 2H), 7.45–7.60 (m, 5H), 7.85–7.86 (m, 1H), 7.90–7.92 (m, 2H), 8.06 ppm (dd, J = 1.2 and 8.2 Hz, 1H). IR: ν 1680 cm−1. Anal. (C18H14N2O5S (370.38)) C, H, N, S.
2-[1-(Phenylsulfonyl)-1H-pyrrol-3-yl]-1H-indole (14)
A mixture of 21 (0.25 g, 0.0007 mol) and iron powder (0.27 g, 0.0049 mol) in glacial acetic acid (8 mL) was heated at 60 °C overnight. After cooling, the mixture was diluted with water while stirring and extracted with ethyl acetate. The organic layer was washed with brine and dried. Removal of the solvent gave a residue that was purified by column chromatography (silica gel, ethyl acetate/n-hexane 1:3 as eluent) to furnish 14 as a white solid (0.7 g, 10%), mp 180–185 °C (from ethanol). 1H NMR (DMSO-d6): δ 6.66 (d, J = 1.4 Hz, 1H), 6.83–6.85 (m, 1H), 6.93–6.97 (m, 1H), 7.02–7.07 (m, 1H), 7.31 (d, J = 8.0 Hz, 1H), 7.44–7.46 (m, 2H), 7.65–7.69 (m, 2H), 7.74–7.79 (m, 1H), 7.84 (t, J = 1.9 Hz, 1H), 7.98–8.00 (m, 2H), 11.30 ppm (br s, 1H, disappeared on treatment with D2O). IR: ν 3407 cm−1. Anal. (C18H14N2O2S (322.38)) C, H, N, S.
1-(1-(Furan-2-yl)ethylidene)-2-phenylhydrazine (23)
A mixture of phenylhydrazine hydrochloride (3.91 g, 0.027 mol), 22 (2.0 g, 1.82 mL, 0.018 mol), and anhydrous sodium acetate (2.21 g, 0.027 mol) in ethanol (25 mL) was placed into the microwave cavity (open vessel mode). Microwave irradiation of 250 W was used, the temperature being ramped from 25 to 80 °C. Once 80 °C was reached, taking about 1 min, the reaction mixture was held there for 5 min, while stirring and cooling. The reaction mixture was filtered to give 23 as an orange solid (2.9 g, 96%), mp 79–84 °C (from ethanol). 1H NMR (DMSO-d6): δ 2.19 (s, 3H), 6.54–6.55 (m, 1H), 6.70–6.71 (m, 1H), 6.74–6.77 (m, 1H), 7.18–7.23 (m, 4H), 7.68–7.69 (m, 1H), 9.22 ppm (broad s, disappeared on treatment with D2O, 1H). IR: ν 3342 cm−1. Anal. (C12H12N2O2 (200.24)) C, H, N.
2-(Furan-2-yl)-1H-indole (15)
23 (1.18 g, 0.006 mol) was added portionwise to PPA (10 g) preheated at 110 °C, and the reaction mixture was stirred at the same temperature for 1 h. After quenching on crushed ice, the mixture was stirred at 25 °C overnight; then it was made basic (pH = 10) with a saturated solution of potassium carbonate and extracted with ethyl acetate. The organic layer was washed with brine and dried. Removal of the solvent gave a residue that was purified by column chromatography (alumina, ethyl acetate/n-hexane 1:5 as eluent) to furnish 15 as a yellow solid (0.6 g, 55%), mp 123–125 °C (from ethanol). Lit.29 120–123 °C.
2-(Furan-3-yl)-1H-indole (16)
A mixture of 2-iodo-1H-indole29 (0.25 g, 0.001 mol), furan-3-boronic acid pinacol ester (0.26 g, 0.00134 mol), potassium carbonate (0.18 g, 0.00134 mol), and Pd(II) acetate (0.03 g, 0.000134 mol) in 1-methyl-2-pyrrolidinone (2.3 mL) containing 0.18 mL of water was degassed for 15 min and placed into the MW cavity (closed vessel mode, Pmax = 250 psi). MW irradiation of 200 W was used, the temperature being ramped from 25 to 110 °C while stirring. Once 110 °C was reached, taking about 2 min, the reaction mixture was held there for 15 min. After cooling, the mixture was diluted with water and extracted with ethyl acetate. The organic layer was washed with brine and dried. Removal of the solvent gave a residue that was purified by column chromatography (silica gel, ethyl acetate/n-hexane 1:5 as eluent) to furnish 16 as a white solid (0.18 g, 95%), mp 145–148 °C (from ethanol). 1H NMR (CDCl3): δ 6.61–6.62 (m, 1H), 6.70–6.71 (m, 1H), 7.09–7.19 (m, 2H), 7.36 (dd, J = 0.9 and 8.0 Hz, 1H), 7.50–7.52 (m, 1H), 7.58–7.60 (m, 1H), 7.75 (m, 1H), 8.10 ppm (broad s, disappeared on treatment with D2O, 1H). IR: ν 3417 cm−1. Anal. (C12H9NO (183.21)) C, H, N.
2-Bromo-1-(thiophen-2-yl)ethan-1-one (26)
A solution of bromine (2.53 g, 0.82 mL, 0.0158 mol) in dichloromethane (8 mL) was added dropwise to 25 (2.0 g, 1.71 mL, 0.0158 mol) in the same solvent (10 mL). The reaction mixture was stirred at 25 °C for 1 h and neutralized with a saturated solution of sodium hydrogen carbonate. The organic layer was washed with brine and dried. Removal of the solvent gave a residue that was purified by column chromatography (silica gel, ethyl acetate/n-hexane 5:95 as eluent) to furnish 26 as a yellow oil (2.60 g, 80%).30
2-(Thiophen-2-yl)-1H-indole (17)
A mixture of 26 (0.5 g, 0.0024 mol) and aniline (0.4 g, 0.4 mL, 0.0041 mol) was kept at 25 °C for 3 h with occasional stirring; then a catalytic amount of anhydrous DMF was added, and the reaction mixture was placed into the MW cavity (closed vessel mode, Pmax = 250 PSI). MW irradiation of 150 W was used, the temperature being ramped from 25 to 100 °C while stirring. Once 100 °C was reached, taking about 1 min, the reaction mixture was held there for 1 min. The mixture was diluted with 1 N HCl and extracted with ethyl acetate. The organic layer was washed with brine and dried. Removal of the solvent gave a residue that was purified by column chromatography (silica gel, ethyl acetate/n-hexane 3:7 as eluent) to furnish 17 as a yellow solid (0.19 g, 40%), mp 175–180 °C (from cyclohexane). Lit.31 167–168 °C (from hexane).
2-Bromo-1-(thiophen-3-yl)ethanone (28)
Synthesized as 26, starting from 27. Yield 57% as a brown solid, mp 60–65 °C (from ethanol). 1H NMR (CDCl3): δ 4.34 (s, 2H), 7.35–7.37 (m, 1H), 7.57 (dd, J = 1.3 and 5.1 Hz, 1H), 8.17–8.18 ppm (m, 1H). IR: ν 1672 cm−1. Anal. (C6H5BrOS (205.07)) C, H, Br, S.
2-(Thiophen-3-yl)-1H-indole (19)
Synthesized as 17, starting from 28. Yield 16% as a yellow solid, mp 210–215 °C (from cyclohexane). Lit.32 212–214 °C.
2-(5-Methoxy-2-nitrophenyl)-1-(thiophen-2-yl)ethanol (30)
TBAF (1 M in THF, 0.83 mL, 0.00083 mol) was dropped into a solution of 2926 (0.2 g, 0.00083 mol) and thiophen-2-carboxaldehyde (0.11 g, 0.092 mL, 0.001 mol) in anhydrous THF (5 mL) at 25 °C under an Ar stream. After 15 min, 37% HCl (0.83 mL) was added, and the reaction mixture was extracted with diethyl ether, washed with brine, and dried. Removal of the solvent gave a residue that was purified by column chromatography (silica gel, chloroform as eluent) to furnish 30 as a yellow oil (0.14 g, 61%). 1H NMR (CDCl3): δ 2.46 (d, J = 4.2 Hz, 1H), 3.37 (dd, J = 8.4 and 13.3 Hz, 1H), 3.55 (dd, J = 4.4 and 13.3 Hz, 1H), 3.84 (s, 3H), 5.31–5.35 (m, 1H), 6.77 (d, J = 2.8 Hz, 1H), 6.86 (dd, J = 2.8 and 9.1 Hz, 1H), 6.97–7.02 (m, 2H), 7.27–7.30 (m, 1H), 8.08 ppm (d, J = 9.1 Hz, 1H). IR: ν 3289 cm−1. Anal. (C13H13NO4S (279.31)) C, H, N, S.
2-(5-Methoxy-2-nitrophenyl)-1-(thiophen-2-yl)ethan-1-one (31)
A solution of 30 (0.74 g, 0.00265 mol) in anhydrous dichloromethane (1.7 mL) was dropped into a suspension of pyridium chlorochromate (0.87 g, 0.004 mol) in the same solvent (6 mL). The reaction mixture was stirred at 25 °C for 1.5 h and filtered. After removal of the solvent, the crude product was purified by column chromatography (silica gel, chloroform as eluent) to furnish 31 as a white solid (0.7 g, 56%), mp 140–145 °C (from ethanol). 1H NMR (CDCl3): δ 3.90 (s, 3H), 4.65 (s, 2H), 6.83 (d, J = 2.7 Hz, 1H), 6.93 (dd, J = 2.8 and 9.1 Hz, 1H), 7.14–7.20 (m, 1H), 7.65–7.69 (m, 1H), 7.84–7.92 (m, 1H), 8.22 ppm (d, J = 9.2 Hz, 1H). IR: ν 1654 cm−1. Anal. (C13H11NO4S (277.30)) C, H, N, S.
5-Methoxy-2-(thiophen-2-yl)-1H-indole (18)
A mixture of 30 (1.07 g, 0.0039 mol) and tin(II) chloride dihydrate (4.98 g, 0.019 mol) in ethyl acetate was heated to reflux for 3 h. After cooling, the reaction mixture was made basic (pH = 10) with a saturated potassium carbonate solution. The suspension was filtered and the layers were separated. The organic layer was washed with brine and dried. Removal of the solvent gave a residue that was purified by column chromatography (silica gel, dichloromethane as eluent) to furnish 18 as a yellow solid (0.19 g, 21%), mp 125 °C (from ethanol). Lit.33 124 °C.
Biology. Tubulin Assembly
The reaction mixtures contained 0.8 M monosodium glutamate (pH 6.6 with HCl in a 2 M stock solution), 10 μM tubulin, and varying concentrations of compound. Following a 15 min preincubation at 30 °C, samples were chilled on ice, GTP to 0.4 mM was added, and turbidity development was followed at 350 nm in a temperature controlled recording spectrophotometer for 20 min at 30 °C. Extent of reaction was measured. Full experimental details were previously reported.34
[3H]Colchicine Binding Assay
The reaction mixtures contained 1.0 μM tubulin, 5.0 μM [3H]colchicine, and 5.0 μM inhibitor and were incubated for 10 min at 37 °C. Complete details were described previously.35
Cell Cultures and Treatment
Cell lines were obtained from the American Tissue Culture Collection (ATCC), unless specified otherwise. Cells were grown in Dulbecco’s Modified Eagle medium (D-MEM) supplemented with 10% fetal bovine serum (FBS) at 37 °C with 5% CO2. In all experiments 300.000 cells were plated in 9 cm2 dishes and exposed to test compound dissolved in DMSO (0.1% final concentration) at the indicated concentrations.
The methodology for the evaluation of the growth of human MCF-7 breast carcinoma, OVCAR-8, and NCI/ADR-RES cells, obtained from the National Cancer Institute drug screening laboratory, was previously described, except that cells were grown for 96 h for IC50 determinations.46 HeLa, PC3, HT29, and A549 cell lines were grown at 37 °C in D-MEM containing 10 mM glucose supplemented with 10% FBS, 100 units/mL each of penicillin and streptomycin, and 2 mM glutamine. At the onset of each experiment, cells were placed in fresh medium and cultured in the presence of test compounds from 0.01 to 25 μM. 231-MDA and A549 cells were cultured in DMEM supplemented with 10% FBS for 24, 48, and 72 h in a 96-well tissue culture plate at 37 °C and 5% CO2 in the absence or presence of different drug concentrations.
The Potorus tridactylis PtK2 cells, the A10 rat embryonic aortic smooth muscle cells, the human umbilical vein endothelial cells, and the human aortic smooth muscle cells were obtained from ATCC and grown as recommended, except that a 5% CO2 atmosphere was used with all cells.
Evaluation of growth inhibition of the A2780wt, A2780-CIS, and OVCAR-3 cell lines was performed as previously reported.36
Cell Viability Assay
Cell viability was generally determined using the MTT colorimetric assay. The test is based on the ability of mitochondrial dehydrogenase to convert, in viable cells, the yellow MTT reagent into a soluble blue formazan dye. Cells were seeded into 96-well plates to a density of 7 × 10³/100 μL well. After 24 h of growth to allow attachment to the wells, compounds were added at various concentrations (from 0.01 to 25 μM). After 48 h of growth and removal of the culture medium, 100 μL/well of medium containing 1 mg/mL of MTT was added. Cell cultures were further incubated at 37 °C for 2 h in the dark. The solution was then gently aspirated from each well, and the formazan crystals within the cells were dissolved with 100 μL of DMSO. Optical densities were read at 550 nm using a Multiskan Spectrum Thermo Electron Corporation reader. Results were expressed as percentage relative to vehicle-treated control (0.5% DMSO was added to untreated cells), and IC50 values were determined by linear and polynomial regression. Experiments were performed in triplicate.
231-MDA and A549 cells were plated at different cellular densities in order to test the compounds on logarithmic phase cells. Test compounds were added after cell adhesion. On the day of the assay, 10 μL MTT (5 mg/mL) was added to each well, and cells were incubated for 2 h (37 °C, 5% CO2). When dark crystals appeared at the well bottom, culture medium was discarded, and ethanol (100 μL) was added to each well to solubilize the crystals, yielding a purple solution. Absorbance was read with an enzyme-linked immunosorbent assay (ELISA) reader at 570 nm.
Immunofluoresence Assay
Cells to be processed for immunofluoresence were grown on sterile poly-l-lysine (SIAL) coated coverslips. After treatment, cells were either simultaneously fixed and permeabilized in MeOH for 6 min at −20 °C or, alternatively, first fixed in 3.7% paraformaldehyde (PFA) for 10 min followed by permeabilization in 0.1% Triton-X 100. The following antibodies were used: anti-β-tubulin unconjugated (Sigma clone B5.1.2, 1:2000) or FITC-conjugated (Sigma, 1:150); anti-γ-tubulin (Sigma, 1:1000); antiprocessed caspase-3 (Cell Signaling Technology, 9661, 1:500). Antibodies attached to their antigens were detected using secondary antibodies: antimouse Texas Red (Vector, TI-2000, 1:800), antimouse FITC (Jackson Immunoresearch Laboratories, 115-095-068, 1:200), antimouse AMCA (1:50), antirabbit FITC (Santa Cruz, sc-2090, 1:100), antirabbit Cy3 (Jackson Immunoresearch Laboratories, 711-165-152, 1:1000). The DNA was stained with DAPI (Sigma, 0.05 μg/mL in H2O). Slides were finally mounted in Vectashield (Vector).
Microscopy
Bright-field images of growing cells were taken under an inverted fluorescence microscope (Nikon TE 300) equipped with a DMX1200-type CCD (resolution 1280 pixels × 1024), using ACT-1 software. Immunofluoresence images were obtained under an epifluorescence Olympus AX70 microscope equipped with a CCD camera (Diagnostic Instruments, Spot RT slider model 2.3.0) or a Nikon Eclipse 90i microscope equipped with Qimaging camera and the NisElements AR 3.1 software (Nikon).
Flow Cytometry
Cell cycle distribution was analyzed after cell incubation with propidum iodide (Sigma). Apoptosis was analyzed after incubation of cells with annexin V-FITC (Immunofluorescence Science). Cell samples were analyzed in a Coulter Epics XL cytofluorometer (Beckman Coulter) equipped with EXPO 32 ADC software. Data for at least 10000 cells per sample were acquired.
Western Blotting Analysis
Cells were plated in flasks (1 × 10⁶ cells) and incubated with or without an ATI compound. At the indicated times, cells were lysed using ice cold lysis buffer (50 mM Tris, 150 mM NaCl, 10 mM EDTA, 1% Triton) supplemented with protease inhibitor cocktail (antipain, bestatin, chymostatin, leupeptin, pepstatin, phosphoramidon, Pefabloc, EDTA, and aprotinin, all from Boehringer). Whole cell extracts were loaded on 8–12% sodium dodecyl sulfate polyacrylamide gels and electrophoresed, followed by blotting onto nitrocellulose membranes (BioRad). After membrane blocking with 5% (w/v) fat-free milk powder, 0.1% Tween 20 in Tris buffered saline (TBS), the membrane was incubated overnight at 4 °C with specific antibodies at the concentrations indicated by the manufacturers (Cell Signaling Technology and Santa Cruz Biotechnology) in Tris-buffered saline/Tween-20/5% milk. Following incubation with horseradish peroxidase-conjugated secondary antibody, bands were detected by enhanced chemiluminescence (ECL kit, Amersham). Each filter was reprobed with mouse monoclonal antiactin antibody. The signal intensity of detected bands was quantified by NIH ImageJ 1.40 after normalization with actin.
Metabolic Stability
Test compounds in duplicate at the final concentration of 1 μM were dissolved in DMSO and preincubated for 10 min at 37 °C in potassium phosphate buffer (pH 7.4) containing 3 mM MgCl2. The rat liver microsomes (Xenotech) were at a final concentration of 0.5 mg/mL. After the preincubation period, reactions were started by adding the cofactors mixture (NADP, glucose-6-phosphate, glucose-6-phosphate dehydrogenase). Samples were taken at times 0, 5, 10, 15, 20, and 30 min and added to acetonitrile to stop the reaction, and the timed samples were centrifuged. Supernatants were analyzed and quantified by LC-MS/MS. A control sample without cofactors was always added in order to check the stability of test compounds in the reaction mixtures. 7-Ethoxycoumarin and propanolol were used as a reference standards. A fixed concentration of verapamil was added in every sample as an internal standard for LC-MS/MS.
Samples were analyzed on a UPLC (Waters) interfaced with a Premiere XE Triple Quadrupole (Waters). Eluents were as follows: phase A: 95% H2O, 5% acetonitrile + 0.1% HCOOH; phase B: 5% H2O, 95% acetonitrile + 0.1% HCOOH. Flow rate, 0.6 mL/min; column, Acquity BEH C18, 50 × 2.1 mm, 1.7 μm at 50 °C; injection volume, 5 μL. Samples were analyzed under the following conditions: electron spray ionization positive, desolvation temperature 450 °C, capillary 3.5 kV, extractor 5 V. The percent of test compound remaining after a 30 min incubation period was calculated from the peak area relative to the area of the compound at time zero.
Aqueous Solubility
The solubility of compound 5 was measured by means of the HTS. Samples were placed in a 96-well filter plate and incubated at room temperature for 90 min. The plate was then filtered, and solutions were analyzed by LC/MS-UV.
In Vivo Drug Pharmacokinetic Studies
Pharmacokinetic experiments were performed using 4 week old male nude CD-1 mice (Charles River Laboratories). Animals were quarantined for approximately 1 week prior to the study. They were housed under standard conditions and had free access to water and a standard laboratory rodent diet. Compound 5 was dissolved in a mixture of 3% DMSO + 30% PEG400 + NaCl 0.9% at the concentration for iv (rapid bolus) administration or a mixture of 5% DMSO + 20% PEG400 + water for the oral (gavage) dose (dose volume 5 mL/kg). Compound 5 was administered to mice either by the iv or the oral route, and blood samples were collected after different time points after dosing. Plasma was separated immediately after blood sampling by centrifugation, plasma proteins were precipitated using Sirocco filtration plates or Oasis HLB elution plates according to the distributor’s instructions, and the plasma samples were kept frozen at −80 °C until LC/MS/MS analysis. Sample analysis was performed on an Acquity UPLC using either a Acquity BEH C18 column (50 mm × 2.1 mm × 1.7 μm) or a Acquity HSS T3 column (50 mm × 2.1 mm × 1.8 μm), coupled with a sample organizer and interfaced to a triple quadrupole Premiere XE (Waters). The mass spectrometer was operated using an electrospray interface (ESI) with a capillary voltage of 3–4 kV, a cone voltage of 25–52 V, a source temperature of 115–120 °C, a desolvation gas flow of 800 L/h, and a desolvation temperature of 450–480 °C. The collision energy was optimized for each compound. LC–MS/MS analyses were carried out using a positive electrospray ionization interface in multiple reaction monitoring mode. Pharmacokinetic parameters were calculated by a noncompartmental method using WinNolin 5.1 software (Pharsight).
Statistical Analysis
Data were analyzed using Prism 4.0 (GraphPad Software, Inc.). Results are expressed as mean ± SEM.
Supplementary Material
ACKNOWLEDGMENTS
This research was supported by PRIN 2008 Grant No. 200879X9N9, and Progetti di Ricerca di Università, Sapienza Università di Roma. A.C. thanks Istituto Pasteur—Fondazione Cenci Bolognetti for his Borsa di Studio per Ricerche in Italia.
ABBREVIATIONS USED
- MT
microtubule
- ATI
arylthioindole
- CSA4
combretastatin A-4
- VBL
vinblastine
- PTX
paclitaxel
- VBR
vinorelbine
- SAR
structure–activity relationship
- MW
microwave
- Pmax
maximum pressure
- PPA
polyphosphoric acid
- TBAF
tetrabuty-lammonium fluoride
- MI
mitotic index
- DAMA-colchicine
N-deacetyl-N-(2-mercaptoacetyl)colchicine
- DAPI
4′,6-diamidino-2-phenylindole
- Pgp
P-glycoprotein
- FBS
fetal bovine serum
- PFA
paraformaldehyde
Footnotes
ASSOCIATED CONTENT
Supporting Information
Additional chemical and biological material. This material is available free of charge via the Internet at http://pubs.acs.org.
REFERENCES
- (1).Bhalla KN. Microtubule-targeted anticancer agents and apoptosis. Oncogene. 2003;22:9075–9086. doi: 10.1038/sj.onc.1207233. [DOI] [PubMed] [Google Scholar]
- (2).Jordan MA, Wilson L. Microtubules as a target for anticancer drugs. Nat. Rev. Cancer. 2004;4:253–265. doi: 10.1038/nrc1317. [DOI] [PubMed] [Google Scholar]
- (3).Teicher BA. Newer cytotoxic agents: attacking cancer broadly. Clin. Cancer Res. 2008;14:1610–1617. doi: 10.1158/1078-0432.CCR-07-2249. [DOI] [PubMed] [Google Scholar]
- (4).Honore S, Pasquier E, Braguer D. Understanding microtubule dynamics for improved cancer therapy. Cell. Mol. Life Sci. 2005;62:3039–3056. doi: 10.1007/s00018-005-5330-x. [DOI] [PMC free article] [PubMed] [Google Scholar]
- (5).Bhattacharyya B, Panda D, Gupta S, Banerjee M. Anti-mitotic activity of colchicine and the structural basis for its interaction with tubulin. Med. Res. Rev. 2008;28:155–183. doi: 10.1002/med.20097. [DOI] [PubMed] [Google Scholar]
- (6).Ravelli RB, Gigant B, Curmi PA, Jourdain I, Lachkar S, Sobel A, Knossow M. Insight into tubulin regulation from a complex with colchicine and a stathmin-like domain. Nature. 2004;428:198–202. doi: 10.1038/nature02393. [DOI] [PubMed] [Google Scholar]
- (7).Lin MC, Ho HH, Pettit GR, Hamel E. Antimitotic natural products combretastatin A-4 and combretastatin A-2: studies on the mechanism of their inhibition of the binding to colchicine to tubulin. Biochemistry. 1989;28:6984–6991. doi: 10.1021/bi00443a031. [DOI] [PubMed] [Google Scholar]
- (8).Nogales E, Whittaker M, Milligan RA, Downing KH. High-resolution model of the microtubule. Cell. 1999;96:79–88. doi: 10.1016/s0092-8674(00)80961-7. [DOI] [PubMed] [Google Scholar]
- (9).Nettles JH, Li H, Cornett B, Krahn JM, Snyder JP, Downing KH. The binding mode of epothilone A on alpha, beta-tubulin by electron crystallography. Science. 2004;305:866–869. doi: 10.1126/science.1099190. [DOI] [PubMed] [Google Scholar]
- (10).Buey RM, Calvo E, Barasoain I, Pineda O, Edler MC, Matesanz R, Cerezo G, Vanderwal CD, Day BW, Sorensen EJ, Lopez JA, Andreu JM, Hamel E, Diaz JF. Cyclostreptin binds covalently to microtubule pores and lumenal taxoid binding sites. Nat. Chem. Biol. 2007;3:117–125. doi: 10.1038/nchembio853. [DOI] [PubMed] [Google Scholar]
- (11).Sridhare M, Macapinlac MJ, Goel S, Verdier-Pinard D, Fojo T, Rothenberg M, Colevas D. The clinical development of new mitotic inhibitors that stabilize the microtubule. Anticancer Drugs. 2004;15:553–555. doi: 10.1097/01.cad.0000131681.21637.b2. [DOI] [PubMed] [Google Scholar]
- (12).(a) Chen SM, Meng LH, Ding J. New microtubule-inhibiting anticancer agents. Exp. Opin. Invest. Drugs. 2010;19:329–343. doi: 10.1517/13543780903571631. [DOI] [PubMed] [Google Scholar]; (b) Harris R, Marx G, Gillett M, Kark A, Arunanthy S. Colchicine-induced bone marrow suppression: treatment with granulocyte colony-stimulating factor. J. Emergency Med. 2000;18:435–440. doi: 10.1016/s0736-4679(00)00160-8. [DOI] [PubMed] [Google Scholar]; (c) Mundy WR, Tilson HA. Neurotoxic effects of colchicine. Neurotoxicology. 1990;11:539–547. [PubMed] [Google Scholar]
- (13).Schmidt M, Bastians H. Mitotic drug targets and the development of novel anti-mitotic anticancer drugs. Drug Resist. Update. 2007;10:162–181. doi: 10.1016/j.drup.2007.06.003. [DOI] [PubMed] [Google Scholar]
- (14).De Martino G, La Regina G, Coluccia A, Edler MC, Barbera MC, Brancale A, Wilcox E, Hamel E, Artico M, Silvestri R. Arylthioindoles, potent inhibitors of tubulin polymerization. J. Med. Chem. 2004;47:6120–6123. doi: 10.1021/jm049360d. [DOI] [PubMed] [Google Scholar]
- (15).De Martino G, Edler MC, La Regina G, Coluccia A, Barbera MC, Barrow D, Nicholson RI, Chiosis G, Brancale A, Hamel E, Artico M, Silvestri R. Arylthioindoles, potent inhibitors of tubulin polymerization. 2. Structure activity relationships and molecular modeling studies. J. Med. Chem. 2006;49:947–954. doi: 10.1021/jm050809s. [DOI] [PubMed] [Google Scholar]
- (16).La Regina G, Edler MC, Brancale A, Kandil S, Coluccia A, Piscitelli F, Hamel E, De Martino G, Matesanz R, Díaz JF, Scovassi AI, Prosperi E, Lavecchia A, Novellino E, Artico M, Silvestri R. New arythioindoles inhibitors of tubulin polymerization. 3. Biological evaluation, SAR and molecular modeling studies. J. Med. Chem. 2007;50:2865–2874. doi: 10.1021/jm061479u. [DOI] [PubMed] [Google Scholar]
- (17).La Regina G, Sarkar T, Bai R, Edler MC, Saletti R, Coluccia A, Piscitelli F, Minelli L, Gatti V, Mazzoccoli C, Palermo V, Mazzoni C, Falcone C, Scovassi AI, Giansanti V, Campiglia P, Porta A, Maresca B, Hamel E, Brancale A, Novellino E, Silvestri R. New arylthioindoles and related bioisosteres at the sulfur bridging group. 4. Synthesis, tubulin polymerization, cell growth inhibition, and molecular modeling studies. J. Med. Chem. 2009;52:7512–7527. doi: 10.1021/jm900016t. [DOI] [PMC free article] [PubMed] [Google Scholar]
- (18).Ciapetti P, Giethlen B. Molecular variations based on isosteric replacement. Carboxylic esters bioisosteres. In: Wermuth CG, editor. The practice of medicinal chemistry. 3rd ed. Elsevier Ltd; Oxford, U.K.: 2008. pp. 310–313. [Google Scholar]
- (19).Hugon B, Pfeiffer B, Renard P, Prudhomme M. Synthesis of isogranulatimide analogues possessing a pyrrole moiety instead of an imidazole heterocycle. Tetrahedron Lett. 2003;44:3927–3930. [Google Scholar]
- (20).Bergman J, Venemalm L. Efficient synthesis of 2-chloro-, 2-bromo-, and 2-iodoindole. J. Org. Chem. 1992;57:2495–2497. [Google Scholar]
- (21).Bartoli G, Bosco M, Dalpozzo R, Todesco PE. Functionalization of aromatic systems: a highly chemoselective synthesis of trimethylsilyl-methylnitroarenes. J. Org. Chem. 1986;51:3694–3696. [Google Scholar]
- (22).Shi J, Orth JD, Mitchison T. Cell type variation in responses to antimitotic drugs that target microtubules and kinesin-5. Cancer Res. 2008;68:3269–3276. doi: 10.1158/0008-5472.CAN-07-6699. [DOI] [PubMed] [Google Scholar]
- (23).Gascoigne KE, Taylor SS. Cancer cells display profound intra- and interline variation following prolonged exposure to antimitotic drugs. Cancer Cell. 2008;14:111–122. doi: 10.1016/j.ccr.2008.07.002. [DOI] [PubMed] [Google Scholar]
- (24).Sudakin V, Yen TG. Targeting mitosis for anti-cancer therapy. BioDrugs. 2007;21:225–233. doi: 10.2165/00063030-200721040-00003. [DOI] [PubMed] [Google Scholar]
- (25).Gascoigne KE, Taylor SS. How do anti-mitotic drugs kill cancer cells? J. Cell Sci. 2009;122:2579–2585. doi: 10.1242/jcs.039719. [DOI] [PubMed] [Google Scholar]
- (26).Vitale I, Galluzzi L, Castedo M, Kroemer G. Mitotic catastrophe: a mechanism for avoiding genomic instability. Nat. Rev. Mol. Cell. Biol. 2011;12:385–392. doi: 10.1038/nrm3115. [DOI] [PubMed] [Google Scholar]
- (27).(a) Impens F, Van Damme P, Demol H, Van Damme J, Vandekerckhove J, Gevaert K. Mechanistic insight into taxol-induced cell death. Oncogene. 2008;27:4580–4591. doi: 10.1038/onc.2008.96. [DOI] [PubMed] [Google Scholar]; (b) McGrogan BT, Gilmartin B, Carney DN, McCann A. Taxanes, microtubules andchemoresistant breast cancer. Biochim. Biophys. Acta. 2008;2:96–132. doi: 10.1016/j.bbcan.2007.10.004. [DOI] [PubMed] [Google Scholar]; (c) Mollinedo F, Gajate C. Microtubules, microtubule-interfering agents and apoptosis. Apoptosis. 2003;8:413–450. doi: 10.1023/a:1025513106330. [DOI] [PubMed] [Google Scholar]
- (28).Kerns EH, Di L. Drug-like properties: concepts, structure design and methods. Academic Press; Burlington, MA: 2008. Plasma stability methods; pp. 329–347. [Google Scholar]
- (29).Kraus GA, Guo H. One-pot synthesis of 2-substituted indoles from 2-aminobenzyl phosphonium salts. A formal total synthesis of arcyriacyanin A. Org. Lett. 2008;10:3061–3063. doi: 10.1021/ol801034x. [DOI] [PubMed] [Google Scholar]
- (30).An alternative preparation of 26 was recently described: Ostrowski T, Golankiewicz B, De Clercq E, Andrei G, Snoeck R. Synthesis and anti-VZV activity of 6-heteroaryl derivatives of tricyclic acyclovir and 9-{[cis-1′,2′-bis(hydroxymethyl)cycloprop-1′-yl]methyl}guanine analogues. Eur. J. Med. Chem. 2009;44:3313–3317. doi: 10.1016/j.ejmech.2009.03.005.
- (31).Hudkins RL, Diebold JL, Marsh FD. Synthesis of 2-aryl- and 2-vinyl-1H-indoles via palladium-catalyzed cross-coupling of aryl and vinyl halides with 1-carboxy-2-(tributylstannyl)indole. J. Org. Chem. 1995;60:6218–6220. [Google Scholar]
- (32).Fang Y-Q, Lautens M. A highly selective tandem cross-coupling of gem-dihaloolefins for a modular, efficient synthesis of highly functionalized indoles. J. Org. Chem. 2008;73:538–549. doi: 10.1021/jo701987r. [DOI] [PubMed] [Google Scholar]
- (33).Caubere C, Caubere P, Ianelli S, Nardelli M. Jamart-Gregoire, B. Aggregative activation and heterocyclic chemistry. I. Complex base promoted arynic cyclization of imines or enamino ketones; regiochemical synthesis of indoles. Tetrahedron. 1994;50:11903–11920. [Google Scholar]
- (34).Hamel E. Evaluation of antimitotic agents by quantitative comparisons of their effects on the polymerization of purified tubulin. Cell Biochem. Biophys. 2003;38:1–21. doi: 10.1385/CBB:38:1:1. [DOI] [PubMed] [Google Scholar]
- (35).Verdier-Pinard P, Lai J-Y, Yoo H-D, Yu J, Marquez B, Nagle DG, Nambu M, White JD, Falck JR, Gerwick WH, Day BW, Hamel E. Structure-activity analysis of the interaction of curacin A, the potent colchicine site antimitotic agent, with tubulin and effects of analogs on the growth of MCF-7 breast cancer cells. Mol. Pharmacol. 1998;35:62–76. doi: 10.1124/mol.53.1.62. [DOI] [PubMed] [Google Scholar]
- (36).Ferlini C, Raspaglio G, Mozzetti S, Cicchillitti L, Filippetti F, Gallo D, Fattorusso C, Campiani G, Scambia G. The seco-taxane IDN5390 is able to target class III β-tubulin and to overcome paclitaxel resistance. Cancer Res. 2005;65:2397–2405. doi: 10.1158/0008-5472.CAN-04-3065. [DOI] [PubMed] [Google Scholar]
Associated Data
This section collects any data citations, data availability statements, or supplementary materials included in this article.