Abstract
So as to develop an effective tool for tumor imaging, we have embedded quantum dots (QD) in hydrogel nanoparticles. Their uptake in cancer cells has been studied in vitro and in a mice tumor model. Compared with QD alone, the QDs embedded in nanoparticles showed higher uptake in the tumor tissue. This novel conjugate can serve as a good imaging tool and also has the potential to serve as a carrier for drugs.
Keywords: quantum dots, hydrogel, nanoparticle encapsulated quantum dot, tumor
I. Introduction
Semiconductor quantum dots (QDs) are very stable in a hypoxic tumor environment and have increased light emission compared with fluorescent dyes. Their broad excitation and narrow emission spectra makes them suitable for multi-modal detection.1 By careful selection of various core semiconductor and other fabrication parameters they can be made to emit light in different colors. They have thus generated a lot of interest in diagnostic imaging. However there are some challenges that have to be overcome in order to make them extremely suitable for in vivo imaging. First, high cellular uptake is extremely important to facilitate excellent cell imaging. Second, they have to be conjugated with suitable ligands to make them specific. In addition the cytotoxicity of these particles is a concern.2,3
Cellular uptake is governed by physical and chemical characteristics of the particle. Presence of suitable ligands for cellular receptors facilitates receptor mediated endocytosis. It has been shown that there is a threshold for particle size (around 10 nm) below which their uptake is significantly reduced. However, particles in the range of 100 to 200 nm have high uptake.4,5 QDs are usually around 10 nm in size and hence most of the times they bind to the cell surface.
In this study we have created bi-functional particles with enhanced imaging properties with a potential for delivering drugs as well. We have developed a method for the production of QD encapsulated poly N-isopropylacrylamide particles (QD-PNIPAMs). We hypothesize that QD-PNIPAMs would have a high intratumoral uptake compared with unmodified QD. The functionality of these particles was tested in both an in vitro cell culture model and via a passive targeting technique in vivo in cancer bearing mice. Our results demonstrate that the QD-PNIPAMs can enhance cancer targeting and imaging capabilities both in vitro and in vivo.
II. MATERIALS AND METHODS
A. Synthesis of PNIPAM Nanoparticles
N Isopropyl Acrylamide (NIPAM) was crosslinked with Methylene Bisacrylamide (BIS) using precipitation polymerization as previously published.6,7 An initiator was added to initiate polymerization at a high temperature to form nanoparticles.
B. Quantum Dot (QD) Production
Sodium hydrogen telluride (NaHTe) was synthesized by the reaction of sodium borohydride with tellurium. Cd(ClO4)2•6H2O and thioglycolic acid (TGA) were dissolved in water and added to the fresh NaHTe solution (1:500 volume ratio) and vigorously stirred. The CdTe particles (QDs) with free thiol groups were formed by refluxing the reaction mixture at 100°C.
C. QD Encapsulation in PNIPAM Particles
Particle encapsulated QD (QD-PNIPAM) were synthesized by crosslinking free thiols on the QD with thiols on the PNIPAM particles. Specifically, S-S bonds on the NIPAM nanoparticles were broken to form reactive thiol groups. Such NIPAM nanoparticles were incubated with QDs at room temperature to crosslink the thiol groups on the particles and the QDs.
D. Particle Characterization
A dynamic light scattering instrument (Nanotrac, Microtrac, USA) was used to determine the size of the QD and QD-PNIPAM particles.
Around 10μl of QD-PNIPAM was placed on a glass slide and coverslipped. It was then observed under a Cytoviva 150 microscope (Cytoviva, Auburn, AL) to examine the morphology of the particles.
E. Cell Culture Studies
JHU 31 cells were cultured in complete growth medium (DMEM with Fetal Calf Serum and antibiotics). QD and QD-PNIPAM particles were equalized for fluorescence intensity by dilution in sterile PBS. Cells were allowed to grow on coverslips and then the media containing QD and QD-PNIPAM were added to such coverslips and incubated for 30 minutes. Coverslips were rinsed and observed under the fluorescence microscope Leica DMLB (Leica, Wetzlar, Germany).
F. In Vivo Targeting of Tumors
Tumor was induced in SCID mice by subcutaneous implantation of JHU-31 prostate cancer cells in the subscapular region. Tumor was allowed to grow for a week. Fifty microliters of QDs or QD-PNIPAM particles with equivalent fluorescence intensity were injected into the tail veins of the mice (5 animals per group). Animals were euthanized after three hours and the tumors were explanted and cryosectioned.
The distribution of the QD and QD-PNIPAM in tumor tissue section were analyzed using a microarray scanner (Genepix 4000B, Molecular Devices Corp, Sunnyvale, CA) and a fluorescent microscope. The overall accumulation of both types of particles in tumors and the relative fluorescence intensity was calculated using NIH ImageJ software.10
Statistical comparison (assessment of QD-PNIPAM accumulation vs. QD accumulation in tumor) was carried out using two-tailed Student’s ‘t’ test. Differences were considered statistically significant at p ≤ 0.05 and p ≤ 0.001.
III. RESULTS & DISCUSSION
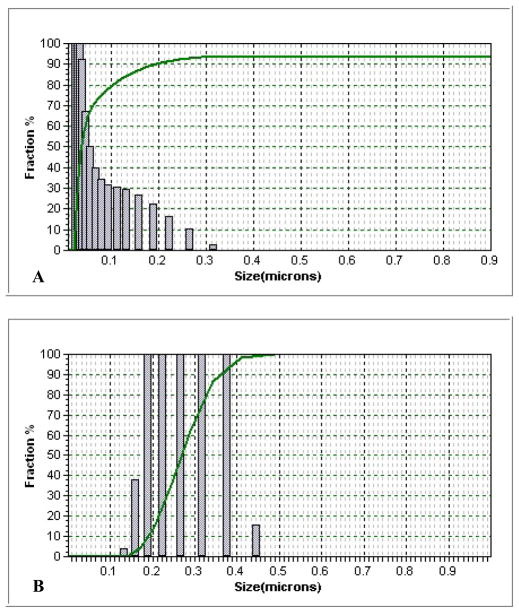
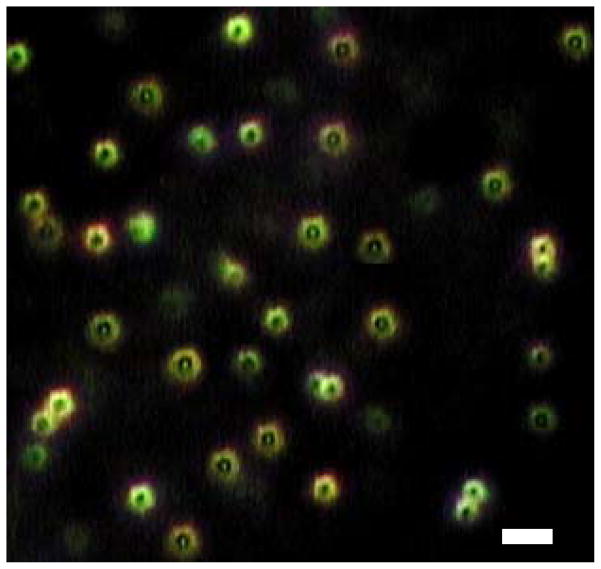
The average size of the QDs was 20 nm and their size distribution centered around the 10 to 20 nm range. PNIPAM particles had an average size of 228 nm while QD-PNIPAM particles had a size of 203 nm which indicates the S-S bonds compress the polymer. This was confirmed by dynamic light scattering analysis (Fig. 1). The particles were observed under the Cytoviva Microscope. The QD-PNIPAM showed a core-shell structure (Fig. 2). In our earlier study using confocal microscopy we had determined that the QDs were embedded in the hydrogel nanoparticles.8
Fig. 1.
Size distribution of QDs alone (A) and QD-PNIPAM (B) was determined using dynamic light scattering.
Fig. 2.
QD-PNIPAM was observed under Cytoviva microscope and appeared as doughnut shaped particles with a core and shell structure. Scale bar = 500 nm.
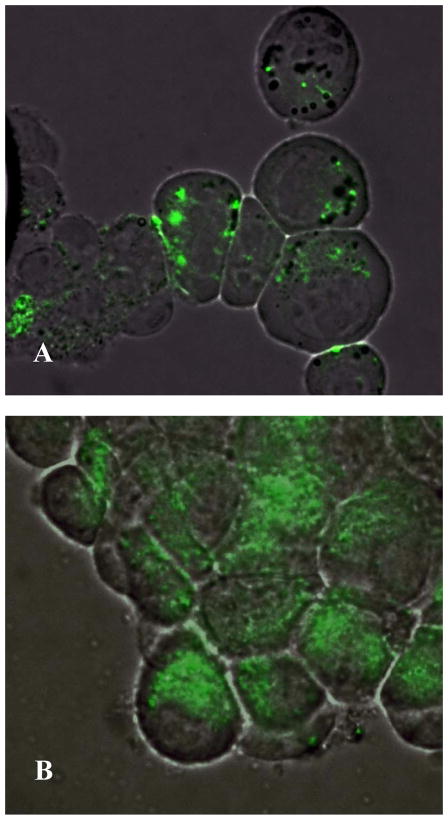
In vitro cell culture model was then used to assess the interaction between cancer cells and QD or QD-PNIPAM particles. Incubation of the particles with JHU 31 cancer cells in vitro showed that QD alone (Fig. 3A) had lesser cell internalization as compared with QD-PNIPAM (Fig. 3B). This finding suggests that PNIPAM particle coating may facilitate the internalization of QD by cancer cells.
Fig. 3.
In the JHU-31 cells, unmodified QD had a low uptake as seen by the low fluorescence intensity (A) compared with the QD-PNIPAM (B). Mag 1000X
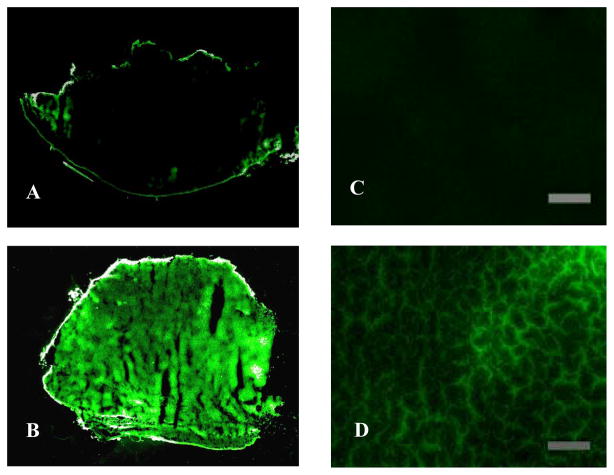
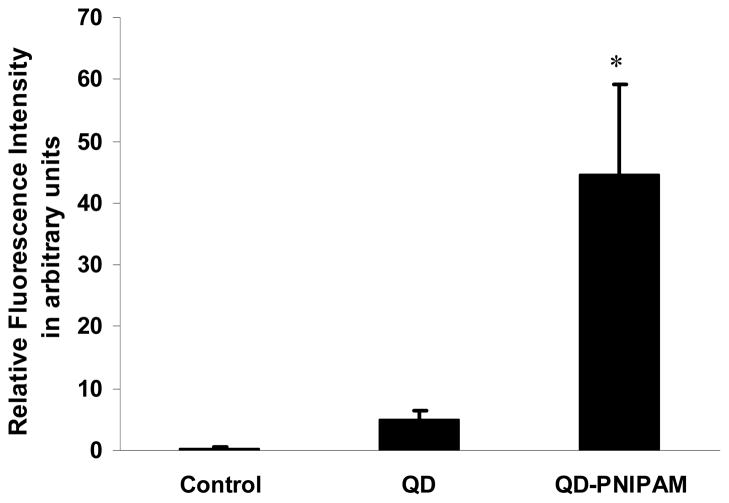
To test the cancer targeting properties of QD and QD-PNIPAM in vivo, both particles were administered into cancer bearing mice for 3 hours. The cancer tissues were recovered, frozen sectioned and the sections were scanned. The unmodified QD were found almost exclusively on the periphery of the tumors (Fig. 4A). However, the QD- PNIPAM showed higher uptake and enhanced distribution inside the tumor tissue (Fig. 4B). The relative fluorescence intensity in the tumor tissues for QD and QD-PNIPAM was determined using NIH ImageJ.10 There was a significant increase in the intensity in the tumor with QD-PNIPAM as compared with QD or control (Fig. 5). Closer examination of the tumor sections at a higher magnification revealed the same trend; with unmodified QD (Fig 4C) showing lesser accumulation at the core of the tumor than QD-PNIPAM (Fig. 4D). We also quantified the distribution of fluorescence intensity over the tumor sections. For this we assessed the area with fluorescence intensity in both QD and QD-PNIPAM injected tumor models. We found that QD-PNIPAM had almost 16 fold increase in intensity over QD alone (Table 1). Although the exact mechanism governing such differential particle distribution is unclear at this point, it is plausible that the increased vascular permeability and hydraulic conductivity of tumors compared with normal tissues plays a major role. Based on similar studies, we believe that both QDs and QD-PNIPAM leak through the leaky tumor vasculature and accumulate at the tumor site due to enhanced permeation and retention.2 In order to be internalized, the accumulated particles have to overcome the outward convection of fluid from the tumor. However, the QD-PNIPAM is readily recognized and there is possibly a cellular mechanism responsible for the selective endocytosis of QD-PNIPAM resulting in its enhanced uptake. This observation can also be correlated to a similar study involving magnetic nanoparticles encapsulated in NIPAM shells which showed high in vivo uptake.9
Fig. 4.
The distribution of QD inside tumor tissue was observed using fluorescence scanner (A–B) and fluorescence microscope (C–D). The scanned images show that intratumoral uptake of unmodified QDs (A) was much lower than that of QD-PNIPAM (B). Fluorescence microscopy confirmed these observations. The QDs alone showed very scanty presence at the tumor core (C) while tumor sections with QD-PNIPAM exhibited stronger fluorescence (D). (Mag 200X) Scale bar = 200 μm.
Fig. 5.
Comparison of fluorescence intensity in the tumor sections. Significance of difference in intensity between QD-PNIPAM vs Control and QD alone. *p≤ 0.05
Table 1.
Fluorescence intensity distribution. p ≤ 0.05
| Percentage | Control | QD | QD-PNIPAM |
|---|---|---|---|
| Intensity distribution/Area of tissue | 0.05 | 4.19 ± 1.33 | 79.35 ± 11.79 |
So as to determine whether this preferential uptake of QD-PNIPAM over QD alone is uniform throughout, tumor blocks were sliced entirely. They were then scanned to determine the presence of QDs and QD-PNIPAM at various regions in the tumor. The fluorescence intensity at the front, middle and back positions in the tumor was quantified as shown in figure 6. For both types of particles, the intensity was high in the front and middle of the tumor but dropped slightly in the back of the tumor. However, the fluorescence intensity in the QD-PNIPAM was significantly higher than QD alone at each region.
Fig. 6.
Comparison of the distribution of the quantum dots inside the tumor. Tumor blocks were sectioned completely and scanned. The relative fluorescence intensity at various positions in the tissue was then quantified. QD-PNIPAM showed a good distribution within the tumor. Significance of difference in intensity between QD-PNIPAM vs QD alone. ** p ≤ 0.01
It has been suggested that encapsulating QDs in a micelle or a polymer shell can reduce their toxic effects.2,11 Through this work we have created a novel QD-PNIPAM particle which possesses tremendous potential for tumor imaging and drug delivery. These bi-functional particles may be used to treat cancer patients with improved safety and efficacy for cancer imaging, monitoring and chemotherapy. Potentially, such QD-PNIPAM particles could be decorated with targeting antibodies to make them more specific. In addition the hydrogel shell can be loaded with a chemotherapeutic drug. This would facilitate simultaneous drug delivery and monitoring of treatment efficacy.
Acknowledgments
This work was supported by NIH grant RO1 GM074021, Texas Higher Education Coordinating Board’s Advance Technology Program Grant 003594-0003-2006 and an AHA Established Investigator Award.
References
- 1.Chan WCW, Nie S. Quantum Dot Bioconjugates for ultrasensitive nonisotopic detection. Science. 1998;281:2016–2018. doi: 10.1126/science.281.5385.2016. [DOI] [PubMed] [Google Scholar]
- 2.Gao X, Cui Y, Levenson R, Chung LWK, Nie S. In vivo cancer targeting and imaging with semiconductor quantum dots. Nat Biotech. 2004;22:969–976. doi: 10.1038/nbt994. [DOI] [PubMed] [Google Scholar]
- 3.Shiohara A, Hoshino A, Hanaki K, Suzukiki K, Yamamoto K. On the cytotoxicity caused by quantum dots. Microbiol Immunol. 2004;48:669–675. doi: 10.1111/j.1348-0421.2004.tb03478.x. [DOI] [PubMed] [Google Scholar]
- 4.Choi SH, Yoon JJ, Park TG. Galactosylated poly(n-isopropylacrylamide) hydrogel, submicrometer particles for specific cellular uptake within hepatocytes. J Coll Int Sci. 2002;251:57–63. doi: 10.1006/jcis.2002.8427. [DOI] [PubMed] [Google Scholar]
- 5.Pulfer SK, Ciccotto S, Gallo JM. Distribution of small magnetic particles in brain tumor- bearing rats. J Neuro-Oncology. 1999;41:99–105. doi: 10.1023/a:1006137523591. [DOI] [PubMed] [Google Scholar]
- 6.Pelton RH, Chibante P. Preparation of Aqueous Latices with N-Isopropylacrylamide. Colloids and Surfaces. 1986;20:247–256. [Google Scholar]
- 7.Weng H, Zhou J, Tang L, Hu Z. Tissue responses to thermally-responsive hydrogel nanoparticles. J Biomat Sci Polym Ed. 2004;15:1167–1180. doi: 10.1163/1568562041753106. [DOI] [PubMed] [Google Scholar]
- 8.Neogi A, Ghosh S, Garner B, Li J, Cai T, Hu Z. CdTe quantum dot in tunable hydrogel nanocrystals. Proceedings of IEEE Quantum Electronics & Laser Conference; 2007. pp. 1–2. [Google Scholar]
- 9.Guo J, Yang W, Wang C, He J, Chen J. Poly(N-isopropyl acrylamide)– coated luminescent/magnetic sislica microspheres: Preparation, characterization, and biomedical applications. Chem Mater. 2006;18:5554–5562. [Google Scholar]
- 10.Abramoff MD, Magelhaes PJ, Ram SJ. Image processing with ImageJ. Biophotonics Int. 2004;11:36–42. [Google Scholar]
- 11.Dubertret B, Skourides P, Norris DJ, Noireaux V, Brivanlou AH, Libchaber A. In vivo imaging of quantum dots encapsulated in phospholipid micelles. Science. 2002;298:1759–1762. doi: 10.1126/science.1077194. [DOI] [PubMed] [Google Scholar]


