Abstract
Filamentous polyelectrolytes in aqueous solution aggregate into bundles by interactions with multivalent counterions. These effects are well documented by experiment and theory. Theories also predict a gel phase in isotropic rodlike polyelectrolyte solutions caused by multivalent counterion concentrations much lower than those required for filament bundling. We report here the gelation of Pf1 virus, a model semiflexible polyelectrolyte, by the counterions Mg2+, Mn2+ and spermine4+. Gelation can occur at 0.04% Pf1 volume fraction, which is far below the isotropic-nematic transition of 0.7% for Pf1 in monovalent salt. Unlike strongly crosslinked gels of semiflexible polymers, which stiffen at large strains, Pf1 gels reversibly soften at high strain. The onset strain for softening depends on the strength of interaction between counterions and the polyelectrolyte. Simulations show that the elasticity of counterion crosslinked gels is consistent with a model of semiflexible filaments held by weak crosslinks that reversibly rupture at a critical force.
Introduction
Semiflexible polymer filaments are ubiquitous in biological materials and form highly non-Newtonian viscous fluids, isotropic gels, liquid crystalline phases, and other ordered assemblies1. The structures of these filaments and the assemblies they form are regulated by factors that determine filament length, stiffness, concentration, and inter-filament interactions. The macroscopic mechanical properties of biomaterials formed by such filaments differ from the properties of soft elastomers formed by flexible polymers. These differences include large shear moduli at low polymer volume fraction2, non-linear elasticity characterized by strain stiffening3, 4, negative normal stress during shear deformation5, 6 and weak power law dependence of elastic modulus on frequency7. Most models for semiflexible biopolymers consider their size, bending stiffness, and orientation within networks and the nature of the crosslinks between filaments to explain the rheology of the materials they form8–10. Often neglected is the fact that most biopolymers in aqueous solutions are strong polyelectrolytes, with a separation between fixed, usually negative, charges that is much less than the Bjerrum length, the characteristic distance at which electrostatic interaction energy exceeds kBT. Even when charge density is averaged over the surface of relatively large filaments such as microtubules, F-actin or neurofilaments, the surface charge density of these objects is similar to the charge density of classical strong polyelectrolytes such as DNA or polystyrene sulfonate11.
Filamentous polyelectrolyte viruses are often used as nearly ideal rodlike, non-interacting polymers for studying liquid crystal phase transitions and counterion-mediated condensation into bundles12, 13. One interesting prediction for rodlike polyelectrolytes in solutions with multivalent counterions is that they can form networks in which filamentous polyelectrolytes are crosslinked at points of intersection, when the counterion concentration is lower than that required to form bundled arrays of filaments14, 15. A phase diagram for this system predicts gelation at large filament concentrations and small counterion concentrations compared to those required for macroscopic segregation in bundles16. This prediction has not yet been experimentally realized because gelation requires that the distance between crosslinks along a filament be significantly less than the contour length of the filament and therefore requires unattainably high concentrations for short filaments. For the most commonly studied filamentous virus, fd with a length of 800 nm, concentrated virus suspensions become nematic even without addition of multivalent counterions. We report here that the longer filamentous phage Pf1 forms viscoelastic gels at concentrations well below its theoretical isotropic-nematic transition in solutions containing multivalent counterions and that both gelation and bundling are highly dependent on the valence of the counterions. Simulations show that the elasticity of the gels is consistent with a model of semiflexible filaments held by weak crosslinks that reversibly rupture at large stains.
Results and discussion
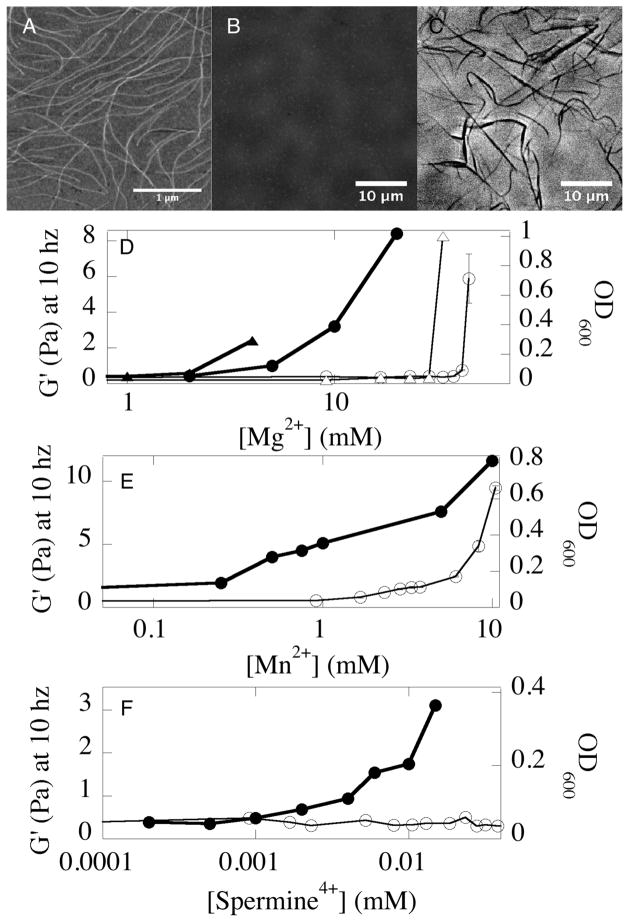
The Pf1 virus is a 2 μm long, 6 nm diameter cylindrical filament (Fig. 1A) with persistence length 2 μm17. Its interior consists of a loop of single stranded DNA. This strand is stabilized by coat proteins that expose positively charged residues in the virus interior that neutralize the anionic charge of the DNA. At the virus exterior these coat proteins expose acidic residues that form an anionic surface with a charge density of 0.5 e/nm2. In monovalent salt solutions the isotropic-nematic transition of Pf1 occurs at concentrations above 0.7% volume fraction17 and at lower concentrations only single filaments are observed by atomic force microscopy (Fig. 1A) that are too small to be observed by light microscopy (Fig. 1B). When multivalent cations are added, aggregates form as detected by light microscopy (Fig 1C) and by optical density (open symbols in Fig. 1D–F) measured at the relatively high concentration (0.5% wt/vol) of virus needed for rheological measurements. Counterion-dependent isotropic-bundle transition at low (0.01%) Pf1 concentration measured by dynamic light scattering occurred at 55 mM Mg2+, 6 mM Mn2+, and 0.015 mM spermine4+ (data not shown). These results are similar to bundling of the structurally related but shorter fd virus, consistent with theoretical predictions that bundling depends on filament charge density and counterion valence, but not filament length18. The different bundling efficiency of Mg2+ and Mn2+ is also observed for DNA, F-actin and other polyelectrolytes and is attributed to differences in ion size, polarizability or other factors that are not entirely understood. The amount of Mg2+ (Fig. 1D) needed to bundle a chemically modified variant of Pf1 (ASLA Biotech, Riga) with 40% greater surface charge is significantly lower, consistent with a previous comparison of fd and its lesser charged variant M13 and with predictions of polyelectrolyte condensation18.
FIG. 1.
Gelation and bundling of Pf1 virus by divalent and tetravalent counterions. An image of single Pf1 viruses in monovalent salt taken by atomic force microscopy (A). The same sample of Pf1 (0.01 % w/v) looks transparent under phase contrast light microscopy (B) but bundles of Pf1 form after addition of 50 mM MgCl2 (C). Storage shear modulus (G′ measured at 2% strain and 10 rad/s; closed symbols) and optical density (open symbols) of 0.5% Pf1 in solutions containing 2 mM HEPES, pH 7.5 and various concentrations of Mg2+ (D) Mn2+ (E) or sperimine4+ (F). Gelation and aggregation of a modified Pf1 with increased surface charge (triangles) are compared to those of normal Pf1(circles) in (D).
The imaging and light scattering data in Fig 1 show that counterion-dependent bundle formation by Pf1 virus closely resembles that of the shorter fd virus, but the greater length of Pf1 allows formation of entangled but still isotopic suspensions that reveal novel rheological properties when low concentrations of counterions are added. For example, at a concentration of 0.5% (w/v) the geometric mesh size Lm, calculated from the total filament length per volume ρ as Lm = ρ−0.5 is 80 nm, more than an order of magnitude smaller than the virus contour length. Therefore the potential for introducing rheologically effective crosslinks between single viruses in the isotropic state is significant. In the remainder of this paper we focus on the counterion concentration regime below the bundling transition. In this regime the virus suspensions remain optically transparent (Fig. 1B), but with increasing counterion concentration the shear storage modulus (G′) increases, and the viruses form a gel (Fig. 1D–F, solid symbols). For all multivalent counterions, the concentration required for gelation is approximately an order of magnitude lower than that required for bundling.
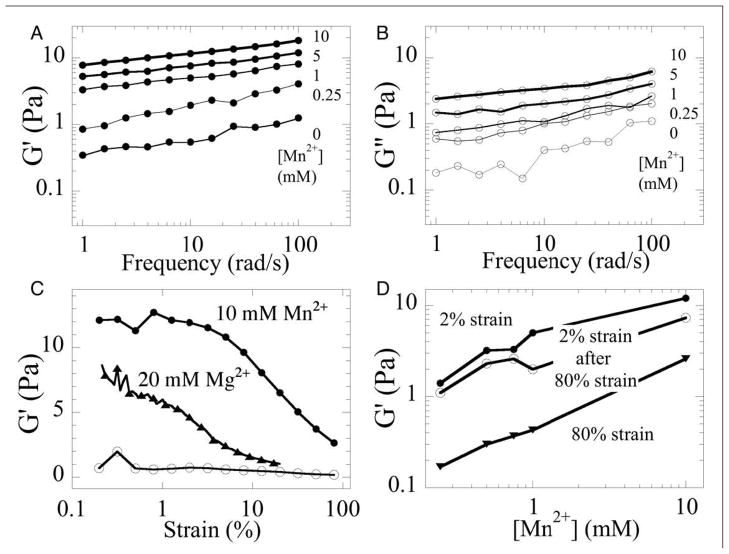
The frequency and strain dependence of Pf1 + Mn2+ gels are shown in Fig. 2. The shear storage modulus G′ at small strain (1%) (Fig. 2A) varies weakly with frequency following an approximate power law with exponents ranging from 0.3 to 0.15 as Mn2+ concentrations increase from 0.25 mM to 10 mM. Shear loss moduli G″ (Fig. 2B) are significantly smaller, especially at high Mn2+ concentrations and follow a similar power law dependence on frequency. Very similar results were seen using Mg2+ or spermine4+ except that much higher concentrations of Mg2+ and lower concentrations of spermine4+ were required for gelation compared to concentration at which Mn2+caused gelation. In contrast to tightly crosslinked networks of semiflexible polymers which have a strongly strain-stiffening rheology, G′ of counterion-crosslinked Pf1 gels does not increase with shear strain, but decreases at strains above 5% (Fig. 2C). This strain-softening in Pf1 gels is probably due to the breaking of crosslinks mediated by counterions. Pf1 gels crosslinked by Mn2+ are somewhat less strain-softening than gels formed with Mg2+, consistent with stronger interaction of the polyelectrolyte with Mn2+ than with Mg2+ (Fig. 1D, E). The softening of Pf1 networks at large strains is reversible when measurements are repeated at low strain (Fig. 2D). This reversibility suggests that counterion-dependent crosslinks rapidly reestablish once forces pulling two filaments apart become lower than a critical value.
FIG. 2.
Rheology of Pf1 networks crosslinked by Mg2+ or Mn2+. Shear storage (closed symbols; A) and loss (open symbols, B) moduli of 0.5 % Pf1 crosslinked by various [Mn2+] after oscillatory deformation at 2% maximal shear strain over a range of frequencies. Strain dependence of shear storage moduli as a constant frequency of 10 rad/s for 0.5 % Pf1 without divalent cations (open circles) or with 10 mM Mn2+ (closed circles) or 20 mM Mg2+ (triangles) (C). Shear storage modulus measured first at 2% strain (closed circles), then at 80% strain (triangles) and again at 2% strain 1 minute after the 80% strain deformation (open circles).
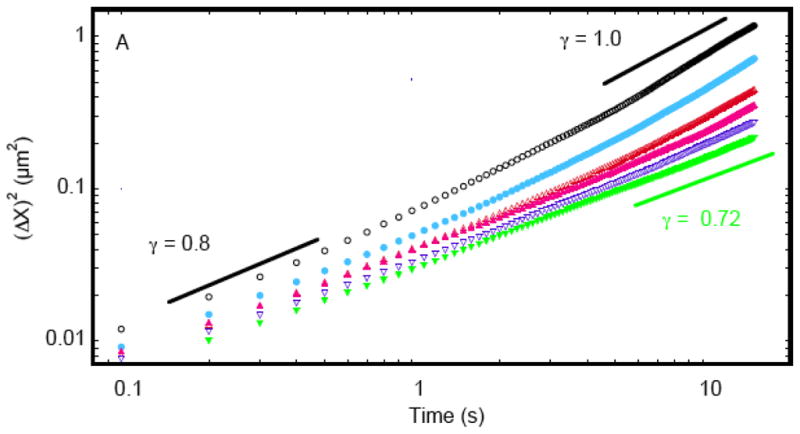
The results of microrheological measurements are shown in Figures 3 and 4. The microrheological method used involved magnetophoresis of micron sized beads through the sample, and measurements of thermally driven bead fluctuations along and orthogonal to the direction of magnetophoresis 19. The dependence of the mean square displacement on the time interval t of the beads’ random walk in the Pf1 gel is shown in Fig. 3 at six different MgCl2 concentrations. Each data point is obtained by averaging 8–10 trajectories. Data shown in Fig. 3 are in agreement with a power law frequency dependence of storage and loss moduli corresponding to fractional Brownian motion 〈Δx(t)2〉 = tγ where for small t at 0 mM MgCl2 γ is 0.81 and changes to the value close to 1 at larger times. At higher MgCl2 concentrations γ remains the same for all time intervals investigated and is close to 0.7 for samples with 10 mM MgCl2. The slope of the sample with no divalent counterions and therefore the most fluid sample appears to be slightly greater than 1 at the longest times. This deviation might result from a perturbation of the sample by the magnetophoresis of the bead and was seen only for this sample and only for fluctuations in the direction along the magnetophoresis. Additional experiments using higher field gradients and increasing rates of magnetophoresis might enable this method to be used to produce and detect locally anisotropic differences in sample rheology.
FIG. 3.

Constrained diffusion of beads in 0.04 % Pf1 gels crosslinked by Mg2+. Mean square displacement scales as tγ. From top to bottom are: [Mg2+] = 0 mM, 2 mM, 4 mM, 6 mM, 8 mM, 10 mM.
FIG. 4.
Elastic moduli of 0.04% Pf1 gels crosslinked by Mg2+. Storage (A) and loss (B) moduli at ω =10 rad/s increases with increasing MgCl2. Open and solid symbols in (A) and (B) are values calculated from the mean square displacement in the x and y directions respectively. Optical density at 600 nm (C) confirms that filament bundling occurs at much higher MgCl2 concentration than those used for microrheology.
G′ and G″ at ω = 10 rad/s derived from the data of Fig 3 as functions of MgCl2 concentration are shown in Fig. 4A and Fig. 4B respectively. Microrheology shows a counterion-dependent increase of the storage modulus while the loss modulus remains nearly constant (Figs. 4A and 4B)). Adding 10 mM MgCl2 to 0.04% Pf1 increases G′ five fold (Fig. 4A) with no change in optical density (Fig 4C), qualitatively in agreement with the data in Fig. 1 obtained by macro-rheological measurements of more concentrated Pf1. The similarity of quantities calculated from fluctuations along and orthogonal to the direction of magnetophoresis confirms that the Pf1 gel is isotropic and that any disturbance made by the moving bead is too small to damage the networks. The force exerted by the superparamagnetic particle, with k = 0.17 (corresponding to a magnetic permeability μ = 1.5119) and radius a = 0.65μm is 0.18 pN. The force on a filament within the gel, estimated as ξ2Fm/4πa2, where ξis a mesh size of the gel equal to 0.2 μm [23] is 1.4·10−3 pN. This value is considerably less than the critical force for breaking a crosslink derived from the simulations in Fig 5A.
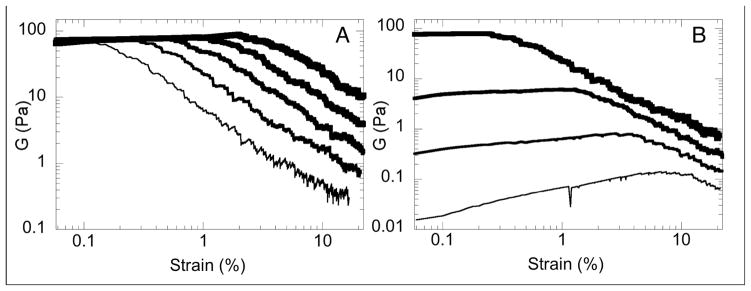
FIG. 5. Shear modulus G as a function of strain of simulated crosslinked Pf1 networks.
A) Shear modulus for networks with 0.47% Pf1, with varying critical force (from left to right): 0.02 pN, 0.05 pN, 0.1 pN, 0.2 pN and 0.4 pN. In the event of breaking of a crosslink, the energy becomes discontinuous at that specific strain. We exclude these data points from the data plotted. B) Shear modulus for networks with (top to bottom curves) 0.47% Pf1, 0.17% Pf1, 0.07% Pf1 and 0.04% Pf1. Here, the critical force is 0.05 pN.
The formation of elastic networks that stiffen with increasing counterion concentration and that weaken with increasing strain but rapidly recover elasticity at small strains is consistent with a network in which the counterion-mediated crosslinks are fragile to local stresses. This model is tested by computer simulations of crosslinked networks with an average filament length of 2 μm, a filament persistence length of 2 μm, and a filament density between 0.04 and 0.47%, corresponding to an average crosslink distance of 0.6 μm to 0.1 μm.
In the simulations, network generation starts from a random, isotropic network that can be considered as a single filament that crosses itself one thousand times. After applying a large number of Monte Carlo moves that alter the topology of the network, segments of this filament are cut to obtain the desired average filament length. The Hamiltonian of this system is a sum over all intra-segment energies that are derived from the force-extension curve developed for semiflexible filaments and a sum over all bending energies of pairs of segments that are connected along a filament20. The length of each polymer segment is set to its equilibrium length. After network generation, the filaments are slightly bent. The frozen-in internal stresses are removed by calculating the bending energy from the square of the difference between the zero-strain angle and the actual angle of pairs of segments that are connected along a filament. The energy as a function of shear strain is calculated by prescribing a global shear in small increments and minimizing the energy after each shear increment. The stresses on each crosslink that are needed to keep the filaments together are then calculated for each shear increment. If this stress exceeds a critical value, the crosslink breaks and the two formerly linked filaments are no longer connected. A critical breaking force ranging from 0.02 pN to 0.4 pN gives reasonable results. To calculate the storage modulus, we divide the shear stress by the shear strain.
The responses of simulated networks with a filament density of 0.47% but with different critical forces at which crosslinks break is shown in Fig. 5A. A lower critical breaking force leads to a decrease in the magnitude of the strain at which the networks soften, as quantified by a decrease in G. At smaller strains, a limited regime of strain-stiffening is observed in the case of infinitely large critical forces (data not shown) and the beginning of strain stiffening is already observed when the critical breaking force for crosslinks exceeds 0.4 pN. This result is consistent with the experiments showing that stronger interaction between counterions and Pf1 leads to more gradual network softening (Fig. 2C). The strain-dependence of shear elastic modulus of simulated networks with varying densities but a constant critical breaking force of 0.05 pN is shown in Fig. 5B. With decreasing density the low strain modulus decreases and the onset of the softening happens at larger strains, because as the modulus decreases, a greater strain is needed to produce a stress large enough to break the crosslinks. The modulus calculated from simulations with no adjustable parameters is close to the experimentally measured moduli at 2% strain for both low (0.04%) and high (0.5%) concentrations (0.07 Pa and 20 Pa, Fig 5B) vs. 0.05 Pa (Fig 4A) and 12 Pa (Fig 2C).
Conclusions
Counterion-mediated gelation of the filamentous polyelectrolyte Pf1 virus occurs at counterion concentrations much lower than those required for filament bundling. The Pf1 gels show a reversible strain-softening, which computer simulations suggest is due to fragile counterion-mediated crosslinks that tend to break under stress and are reestablished once the stress is removed. This strain softening is similar to that reported for surfactant-stabilized single wall carbon nanotube networks where dynamic crosslinks are formed by van der Waals attractions between nanotubes at sites where fluctuations of surfactant transiently expose the bare surface of the nanotube21. Our results provide experimental evidence for the existence of an isotropic gel phase formed by polyelectrolyte filaments and multivalent counterions in which dynamic crosslinks are formed by generic electrostatic interactions rather than specific metal ion – protein binding sites. Since many biopolymers are strong polyelectrolytes and physiological concentrations of divalent and tetravalent counterions are sufficient for gelation, these results have implications for the elasticity of the cytoskeleton and the nuclear matrix.
Material and Methods
Pf1 phage strain LP11–92 which is isolated from wild type Pseudomonas aeruginosa and propagated in the phage free strain LA23–99 and a variant of Pf1 (ASLA Biotech, Riga) with 40% greater surface charge were obtained from Asla Biotech Ltd. Riga, LV-1067, Latvia.
Rheological measurements of macroscopic samples. The shear storage and loss moduli of 0.2 ml samples of Pf1 were measured by a Rheometrics RFS III rheometer (TA instruments) as functions of frequency and strain amplitude using conventional methods described in detail elsewhere22. Briefly, 5 mg/ml (0.5 % w/v) solutions of Pf1 virus were made in buffer containing 2 mM HEPES, pH 7.5, and 1 mM NaN3. Divalent and tetravalent counterions were added from stock solutions of 10 mM to 1 M as needed to increase counterion concentrations without diluting the sample more than 10%. In order to conserve material, in most cases a single sample of virus was measured repeatedly at increasing counterion concentrations. To do so, after a set of rheological measurements was done at one concentration, the rheometer plates were separated, additional counterion was added, and the plates were repositioned to allow the next set of measurements. This process initially disrupted the network, and the sample was incubated for approximately 2 minutes before the next set measurements was started. One set of measurements with a range of [Mg2+] was also done using separate virus preparations for each concentration of Mg2+. No systematic difference was seen between the two different methods of raising [Mg2+]. Measurements of G′ as a function of time after either mixing counterions into a fresh Pf1 sample or adding additional counterions to a sample already on the rheometer plate showed that G′ reached a steady level within a minute after sample disruption.
Magnetic bead microrheology. In this experiment G′ and G″ are calculated from the thermally-driven fluctuations of 0.65 μm radius superparamagnetic beads (Spherotech) that are simultaneously magnetophoresed through the virus suspension. The equipment consists of a permanent magnet that creates a magnetic field with strength H = 900 Oe and gradient ∂H/∂x = 430 Oe/cm within a 0.028 mm thick chamber. Superimposed on the directed movement of the beads along the field gradient oriented along the x-axis are fluctuations along both x and y axes due to thermal energy. Beads were observed using a Leica DMI3000 B fluorescence microscope with a 40 × objective and recorded with a high efficiency 12-bit Hamamatsu C8484 camera. The focus is kept at the middle of the sample which is 28 microns thick, and only beads that stay in the image plane at least 10 μm from the glass surfaces are analyzed.
Particle Image Velocimetry (Dantec) was used to measure bead displacements from 12-bit image series at 10 Hz. For each measurement, 3000 to 10000 frames were processed to quantify the particle mean square displacements due to thermal motions both along the direction of magnetophoresis, <Δx(t)2>, and orthogonal to it, <Δy(t)2>. G′ and G″ are obtained from G*(ω) which is computed from the Laplace transform <Δx(s)2> of the mean square displacement <Δx(t)2> with s = iω. G*(ω) is calculated as: G*(ω) = 2kBT/(6πRiω< Δx2(iω)>) where R is the bead radius 23. The value of the storage modulus in the absence of divalent cations obtained by this method is close to the value obtained by active magnetic microrheology (0.02 Pa at 6 Hz) for the same PF1 concentration 24. The advantage of magnetophoresis is that the beads sample large areas of the virus suspension and differences in fluctuations along the orthogonal directions would reveal potential structural anisotropy as recently reported from microrheology of F-actin above the nematic phase transition concentration 25.
References
- 1.Lieleg O, Schmoller KM, Cyron CJ, Luan YX, Wall WA, Bausch AR. Soft Matter. 2009;5:1796–1803. [Google Scholar]
- 2.MacKintosh FC, Kas J, Janmey PA. Phys Rev Lett. 1995;75:4425–4428. doi: 10.1103/PhysRevLett.75.4425. [DOI] [PubMed] [Google Scholar]
- 3.Kasza KE, Koenderink GH, Lin YC, Broedersz CP, Messner W, Nakamura F, Stossel TP, MacKintosh FC, Weitz DA. Phys Rev E Stat Nonlin Soft Matter Phys. 2009;79:041928. doi: 10.1103/PhysRevE.79.041928. [DOI] [PubMed] [Google Scholar]
- 4.Storm C, Pastore JJ, MacKintosh FC, Lubensky TC, Janmey PA. Nature. 2005;435:191–194. doi: 10.1038/nature03521. [DOI] [PubMed] [Google Scholar]
- 5.Conti E, MacKintosh FC. Physical Review Letters. 2009;102:088102. doi: 10.1103/PhysRevLett.102.088102. [DOI] [PubMed] [Google Scholar]
- 6.Kang H, Wen Q, Janmey PA, Tang JX, Conti E, Mackintosh FC. J Phys Chem B. 2009;113:3799–3805. doi: 10.1021/jp807749f. [DOI] [PMC free article] [PubMed] [Google Scholar]
- 7.Deng LH, Trepat X, Butler JP, Millet E, Morgan KG, Weitz DA, Fredberg JJ. Nature Materials. 2006;5:636–640. doi: 10.1038/nmat1685. [DOI] [PubMed] [Google Scholar]
- 8.Huisman EM, van Dillen T, Onck PR, Van der Giessen E. Phys Rev Lett. 2007;99:208103. doi: 10.1103/PhysRevLett.99.208103. [DOI] [PubMed] [Google Scholar]
- 9.Kroy K. Current Opinion in Colloid & Interface Science. 2006;11:56–64. [Google Scholar]
- 10.van Dillen T, Onck PR, Van der Giessen E. Journal of the Mechanics and Physics of Solids. 2008;56:2240–2264. [Google Scholar]
- 11.Tang JX, Janmey PA. Journal of Biological Chemistry. 1996;271:8556–8563. doi: 10.1074/jbc.271.15.8556. [DOI] [PubMed] [Google Scholar]
- 12.Barry E, Beller D, Dogic Z. Soft Matter. 2009;5:2563–2570. [Google Scholar]
- 13.Tang JX, Fraden S. Liquid Crystals. 1995;19:459–467. [Google Scholar]
- 14.Borukhov I, Bruinsma RF. Phys Rev Lett. 2001;87:158101. doi: 10.1103/PhysRevLett.87.158101. [DOI] [PubMed] [Google Scholar]
- 15.Lee KC, Borukhov I, Gelbart WM, Liu AJ, Stevens MJ. Phys Rev Lett. 2004;93:128101. doi: 10.1103/PhysRevLett.93.128101. [DOI] [PubMed] [Google Scholar]
- 16.Ermoshkin AV, Olvera de la Cruz M. Phys Rev Lett. 2003;90:125504. doi: 10.1103/PhysRevLett.90.125504. [DOI] [PubMed] [Google Scholar]
- 17.Dogic Z, Fraden S. Physical Review Letters. 1997;78:2417–2420. [Google Scholar]
- 18.Zweckstetter M, Bax A. Journal of Biomolecular Nmr. 2001;20:365–377. doi: 10.1023/a:1011263920003. [DOI] [PubMed] [Google Scholar]
- 19.Kitenbergs G, Dzilna K, Erglis K, Cebers A. AIP Conference Proceedings. 2010;1311:141–145. [Google Scholar]
- 20.Huisman EM, Storm C, Barkema GT. Phys Rev E Stat Nonlin Soft Matter Phys. 82:061902. doi: 10.1103/PhysRevE.82.061902. [DOI] [PubMed] [Google Scholar]
- 21.Hough LA, Islam MF, Janmey PA, Yodh AG. Phys Rev Lett. 2004;93:168102. doi: 10.1103/PhysRevLett.93.168102. [DOI] [PubMed] [Google Scholar]
- 22.Janmey PA, McCormick ME, Rammensee S, Leight JL, Georges PC, Mackintosh FC. Nat Mater. 2007;6:48–51. doi: 10.1038/nmat1810. [DOI] [PubMed] [Google Scholar]
- 23.Mason TG, Weitz DA. Phys Rev Lett. 1995;74:1250–1253. doi: 10.1103/PhysRevLett.74.1250. [DOI] [PubMed] [Google Scholar]
- 24.Erglis K, Ose V, Zeltins A, Cebers A. Magnetohydrodynamics. 2010;46:23–29. [Google Scholar]
- 25.He J, Mak M, Liu Y, Tang JX. Phys Rev E Stat Nonlin Soft Matter Phys. 2008;78:011908. doi: 10.1103/PhysRevE.78.011908. [DOI] [PubMed] [Google Scholar]


