Abstract
Purpose
To prepare and evaluate a new radiotracer for molecular imaging of cell surface receptors for epidermal growth factor (EGF).
Methods
Cys tagged EGF (cEGF) was labeled with 18F by coupling the free thiol group of the Cys tag with N-[2-(4-[18F]fluorobenzamido)ethyl]maleimide ([18F]FBEM) to form [18F]FBEM-cEGF. Cell uptake, internalization and efflux of [18F]FBEM-cEGF were tested in human head and neck squamous carcinoma UM-SCC1 cells. In vivo tumor targeting and pharmacokinetics of the radiotracers were evaluated in UM-SCC1 tumor-bearing athymic nude mice by static and dynamic microPET imaging. Ex vivo biodistribution assays were performed to confirm the noninvasive imaging results.
Results
The radiolabeling yield for [18F]FBEM-cEGF was over 60%, based on starting [18F]FBEM. [18F]FBEM-cEGF exhibited rapid blood clearance through both hepatobiliary and renal excretion. UM-SCC1 tumors were clearly visualized and showed modest tracer uptake of 2.60 ± 0.59 %ID/g at 30 min post injection. Significantly higher tumor uptake of [18F]FBEM-cEGF (5.99 ± 1.61 %ID/g at 30 min p.i., p < 0.01) and tumor/non-tumor ratio were achieved by co-injection of 50 μg of unlabeled EGF. Decreased liver uptake of [18F]FBEM-cEGF was observed when unlabeled EGF was co-administered.
Conclusion
With optimized liver blocking, [18F]FBEM-cEGF has the potential to be used in a non-invasive and quantitative manner for detection of malignant lesions and evaluation of EGFR activity.
Keywords: PET, [18F]FBEM-cEGF, HNSCC, EGFR
Introduction
Epidermal growth factor receptor (EGFR), a member of the structurally related erbB family of receptor tyrosine kinases (TK), is activated when the naturally occurring ligand EGF binds to its extracellular domain and triggers intracellular signal that stimulates cell growth, proliferation, and differentiation [1]. It has been reported that many types of tumors have high levels of EGFR expression [2]. In particular, EGFR overexpession is detected in more than 95% of head and neck squamous cell carcinoma (HNSCC) patients, and its overexpression is associated with low survival [3].
The overexpression of EGFR in nearly all HNSCCs has led to the development of pharmacotherapy directed against this cell-surface receptor, and both preclinical and clinical data suggested that EGFR is a valid therapeutic target [4]. EGFR-targeted therapies include monoclonal antibodies (mAbs), such as cetuximab (IMC-C225, Erbitux) and panitumumab (ABX-EGF, Vectibix), that block the extracellular ligand-binding domain of the receptor; and tyrosine kinase inhibitors (TKIs) that prevent the activation of the cytoplasmic kinase portion [5]. In a phase III trial, cetuximab combined with radiation was shown to significantly improve both locoregional control and overall survival in patients with locoregionally advanced HNSCC [6]. In addition, cetuximab plus platinum-based chemotherapy in recurrent or metastatic HNSCC prolonged the median progression-free survival from 3.3 to 5.6 months [7]. Even though clinical results for EGFR targeting with specific antibodies are promising, most studies indicate that only a subgroup of patients receiving the mAbs benefit from the drugs [8–9]. No correlation has been found between EGFR tumoral staining intensity by immunohistochemistry (IHC) and the efficacy of cetuximab[10–11]. In this case, noninvasive molecular imaging may provide more comprehensive information of EGFR expression and activity in tumor regions, and thereby improve patient management and facilitate individualized medicine [12].
EGFR targeted imaging has been performed using single photon emission computed tomography (SPECT) with 111In and 99mTc-labeled EGFR specific antibodies [13–15]. Positron emission tomography (PET) imaging of EGFR has also been performed using cetuximab labeled with 64Cu [16–18]. Small animal PET imaging showed that 64Cu-DOTA-cetuximab had high tumor accumulation over time in EGFR-positive tumors, but relatively low uptake in EGFR-negative tumors at all time points examined [19]. 64Cu-DOTA-cetuximab has also been used to detect and quantify EGFR expression in cervical cancer tumors [16, 20]. The main challenge with the use of antibodies as imaging probes is that the large molecular size of intact antibodies (about 150 kDa) leads to prolonged serum half-life, with less rapid uptake and limited ability for repeated studies [21]. Moreover, the size of full length IgG limits its intratumoral diffusion, potentially resulting in heterogeneous deposition in tumors [22]. We have, for example, performed small animal PET using 64Cu-labeled panitumumab in several HNSCC tumor models and observed no correlation between quantitative PET imaging and tumor EGFR expression [23].
EGF has several advantages over EGFR-specific antibodies that could lead to the design of a better imaging tracer. First, the much smaller size (~ 6.4 kDa) facilitates more rapid kinetics of tracer uptake and may allow repetitive imaging studies using short half-lived radioisotopes. Second, as a natural ligand of EGFR, EGF showed high binding affinity and specificity to the receptor [24]. In addition, imaging with EGF may help to discriminate between active and inactive forms of EGFR, which may be a more relevant parameter for predicting efficacy of anti-EGFR agents [25]. EGF has been labeled with single-photon emitting radiometals, including 99mTc [26] and 111In [27] for SPECT. Since PET is a superior detection technique in sensitivity and quantification compared with SPECT, Velikyan et al. have used a positron emitter 68Ga to label EGF for PET imaging of EGFR in a preclinical model. Although the EGFR positive A431 tumor could be visualized with microPET, the imaging quality was not ideal due to high tracer uptake in the abdominal region [28].
To improve image quality and quantification, Levashova et al. achieved site specific labeling by fusing a mono-cysteine containing Cys tag on the N-terminus of EGF (cEGF). Imaging with 99mTc and 64Cu-labeled cEGF showed improved image quality and lowered kidney and liver uptake [29]. 18F is the most widely used PET radioisotope, because it has good imaging characteristics and suitable half-life for small-molecular weight peptides. However, no 18F-labeled EGF has not been reported because the native EGF lacks a proper anchor for attaching 18F label. Here, we have developed a novel EGF-based PET probe by conjugating the thiol specific 18F synthon [18F]FBEM on cEGF. We evaluated the in vivo behavior of [18F]FBEM-cEGF in an HNSCC xenografted mouse model.
Materials and Methods
General
F-18 fluoride was obtained from the NIH cyclotron facility. The [18F]FBEM was prepared on an Eckert & Ziegler automated synthesis module according to a published procedure [30]. [18F]FBEM was obtained in 1.5 mL of methylene chloride and a portion evaporated for use in peptide labeling.
Preparation of [18F]FBEM-cEGF
[C4]-Monothiol Cys-tagged human EGF (cEGF, MW 9.3 kDa) was provided by SibTech Inc. About 10 mCi of [18F]FBEM in methylene chloride was transferred to a 1 ml Eppendorf tube, and the methylene chloride was removed with argon flow at room temperature. The residual radioactivity was dissolved in 10 μl of ethanol; a solution of cEGF (100 μg in 150 μl PBS) was added; and the mixture was allowed to react at room temperature for 30 min. At the end of the reaction, the reaction mixture was loaded onto an NAP-5 column (GE) prewashed with 10 ml saline. The product was eluted with saline in 0.25 ml fractions and the product analyzed with analytical C-18 HPLC. The fractions containing the [18F]FBEM-cEGF were combined and used for biological study. The radiochemical purity was analyzed with analytical HPLC.
Cell line and tumor model
The human head and neck squamous cell carcinoma UM-SCC1 cells were obtained from the University of Michigan. The cells were maintained in DMEM supplemented with 10% fetal bovine serum (FBS), 1% glutamine, 100 units/ml penicillin, and 100 mg/ml streptomycin (Invitrogen, CA). A subcutaneous UM-SCC1 tumor model was developed in 5 to 6-week old female athymic nude mice (Harlan Laboratories) by injection of 5×10⁶ cells in their left or right shoulders. Tumor growth was followed by caliper measurements of perpendicular diameters of the tumor. The tumor volume was estimated by the formula: tumor volume = a×b2/2, where a and b were the tumor length and width, respectively, in millimeters. Small animal PET studies were performed when the tumor volume reached 100 to 200 mm3 (4–6 wk after inoculation). All animal studies were conducted in accordance with the principles and procedures outlined in the National Institutes of Health Guide for the Care and Use of Animals using protocols approved by the NIH Institutional Animal Care and Use Committee.
Cell uptake, internalization and efflux
For cell uptake studies, UM-SCC1 cells were seeded into a 24-well plate at a density of 1×10⁵ cells per well and incubated with 18.5 kBq (0.5 μCi/22.5 ng)/well of [18F]FBEM-cEGF in serum free medium at 37°C for 15, 30, and 60 min. Tumor cells were then washed twice with cold PBS and harvested by addition of 250 μl of 0.1 N NaOH. Internalization studies were preformed similarly to the procedure described above. After 15, 30, and 60 min incubation of UM-SCC1 cells with [18F]FBEM-cEGF at 37°C, the cells were washed twice with cold PBS and then incubated for 1 min with acid-washing-buffer (50 mM glycine, 0.1M NaCl, pH = 2.8) to remove surface bound radioactive ligand. Thereafter, the cells were washed twice with cold PBS and harvested by addition of 250 μl of 0.1 N NaOH. For efflux studies, about 18.5 kBq (0.5 μCi)/well of [18F]FBEM-cEGF were added to UM-SCC1 cells in a 24-well plate and incubated for 1 h at 37°C. Then cells were washed twice with cold PBS, and incubated with serum free DMEM medium for 15, 30, and 60 min. After washing twice with PBS, cells were harvested by addition of 250 μl of 0.1 N NaOH. The cell lysate was collected and the remaining radioactivity was measured in a γ counter (Packard, Meriden, CT). The cell uptake, internalization and efflux were expressed as percentages of the added dose (%AD) after decay correction.
Small animal PET
PET scans and image analysis were performed using an Inveon microPET scanner (Siemens Medical Solutions). About 3.7 MBq (100 μCi/4.5 μg) of 18F-FBEM-EGF were administered via tail vein injection under isoflurane anesthesia. Five-minute static PET images were acquired at 0.5, 1 and 2 h postinjection (p.i.; n = 3/group). For blocking experiments, 50 or 500 μg of unlabeled EGF (GenScript USA Inc., NJ) was coinjected with 3.7 MBq (100 μCi) of 18F-FBEM-cEGF, and 5-min static PET images were acquired at 30 min after injection (n = 3/group). One hour dynamic PET scans were also performed immediately after the injection of 3.7 MBq (100 μCi) of [18F]FBEM-cEGF.
The images were reconstructed using a two-dimensional ordered-subset expectation maximization (2D OSEM) algorithm, and no correction was applied for attenuation or scatter. For each scan, regions of interest (ROIs) were drawn over the tumor and major organs using vendor software (ASI Pro 5.2.4.0) on decay-corrected whole-body coronal images. The radioactivity concentrations (accumulations) within the tumors, muscle, liver, and kidneys were obtained from mean pixel values within the multiple ROI volumes and then converted to MBq per milliliter per minute using the calibration factor determined for the Inveon PET system. These values were then divided by the administered activity to obtain (assuming a tissue density of 1 g/ml) an image-ROI-derived percent injected dose per gram (%ID/g). Dynamic scans were reconstructed by a three-dimensional ordered subsets expectation maximization (3D-OSEM) algorithm with a maximum a posteriori (MAP) algorithm, and the frame rates were 10×30s, 5×60s, 5×120s and 10×240s, and no correction was applied for attenuation or scatter.
Small animal CT imaging and PET/CT co-registration
To perform a microCT scan by a high-resolution Inveon MicroCT scanner (Siemens Medical Solutions), an anesthetized nude mouse bearing UM-SCC1 tumor was mounted on a turntable bed that could be moved automatically in the axial direction. Whole body CT acquisition parameters were as follows: voltage 70 kVp, current 400 μA, angular sampling 1° per projection for a full 360° scan, and effective pixel size 58 μm. Scan time was approximately 12 minutes. The image was reconstructed in real-time by a modified Feldkamp cone bean algorithm with a Shepp-Logan filter and appropriate center offset determined prior to scanning. A maximum intensity projection (MIP) of whole body CT was adopted for anatomical reference of PET.
Biodistribution assay
Immediately after PET imaging, the tumor-bearing mice were sacrificed and dissected. Blood, tumor, major organs, and tissues were collected and wet-weighed. The radioactivity in the wet whole tissue was measured with a γ-counter (1480 Wizard 3 gamma counter, Perkin–Elmer). The results were expressed as percentage of injected dose per gram of tissue (%ID/g). Values were expressed as mean ± SD for a group of four animals.
Statistical Analysis
Quantitative data are expressed as mean ± SD. Means were compared using 1-way ANOVA and Student’s t test. P values < 0.05 were considered significant.
Results
Radiosynthesis
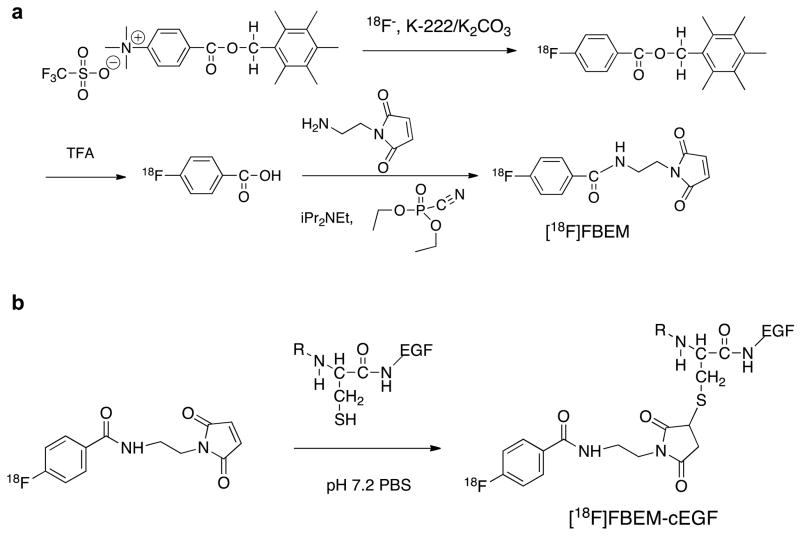
Radiosynthesis of [18F]FBEM-cEGF is shown in Fig. 1. The radiochemical yield for [18F]FBEM-cEGF was over 60% with specific activity of 220 mCi/μmole. The radiochemical purity of [18F]FBEM-cEGF was over 97% by analytical HPLC analysis.
Fig. 1.
Radiosynthesis of [18F]FBEM-cEGF.
Uptake, internalization and efflux
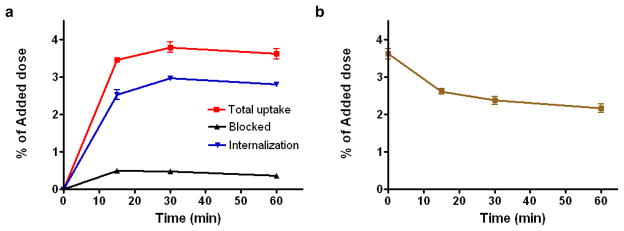
The cell uptake, internalization and efflux of [18F]FBEM-cEGF were evaluated in EGFR positive UM-SCC1 cells [31] and are shown in Fig. 2. The cell uptake of [18F]FBEM-cEGF exhibited a fast increase in binding for the first 15 min, which reached its peak at 30 min (3.78 ± 0.24% of total input) and then slightly decreased at 1 h (3.61 ± 0.20% of total input). 18F-FBEM-cEGF also showed a high level of internalization, with 2.53 ± 0.23, 2.96 ± 0.09 and 2.79 ± 0.07% of total input radioactivity internalized after 15, 30 and 60 min incubation, respectively. Internalization observed at 15, 30 and 60 min of incubation was 73, 78 and 77% of total binding, respectively (Fig. 2a). Dramatic inhibition of cell uptake was observed with the presence of 2 mM unlabeled EGF, confirming the specificity of EGFR-mediated cell uptake. When the labeled cells were incubated in serum-free medium devoid of radioactivity, 18F-FBEM-cEGF showed dissociation and efflux from the cells with time (Fig. 2b). After 15 min of incubation, approximately 28% of [18F]FBEM-cEGF had dissociated from the UM-SCC1 cells. The release of [18F]FBEM-cEGF from UM-SCC1 cells reached a plateau after 0.5 h. At the end of the 1 h incubation period, approximately 60% of the radiotracer remained bound with the cells.
Fig. 2.
Cell uptake (a) and efflux (b) of [18F]FBEM-cEGF in UM-SCC1 cells. Data are from 2 experiments with triplicate samples and are expressed as mean ± SD.
MicroPET imaging
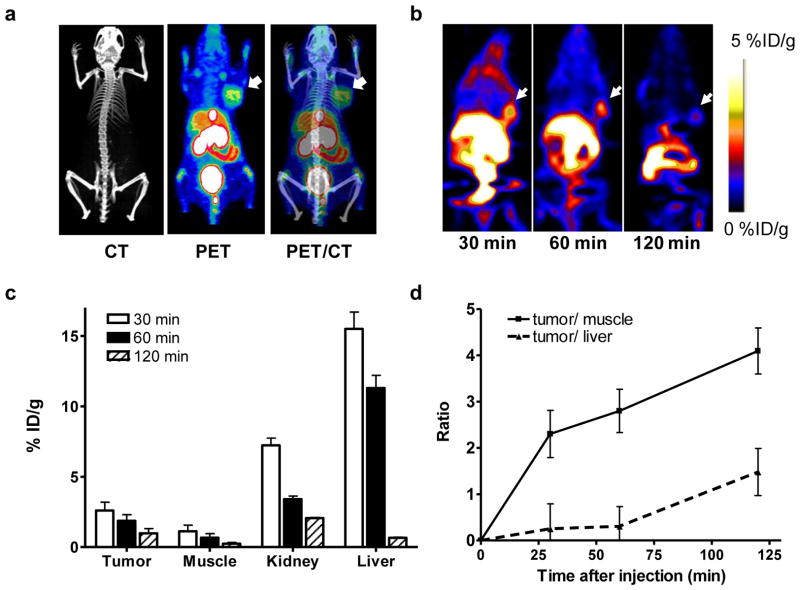
In vivo imaging study was carried out in a UM-SCC1 tumor model developed by subcutaneous inoculation (Fig. 3a). Representative coronal microPET images of UM-SCC1 tumor-bearing mice at different times after intravenous injection of 3.7 MBq (100 μCi, mass dose around 4.5 μg) of [18F]FBEM-cEGF are shown in Fig. 3b. The UM-SCC1 tumors were clearly visible in relation to the contralateral background. The tumor uptake of [18F]FBEM-cEGF was determined to be 2.60 ± 0.59, 1.87 ± 0.44 and 0.98 ± 0.33 %ID/g at 30, 60 and 120 min p.i., respectively. Both liver and kidneys showed high uptake at 30 min p.i. with %ID/g of 7.23 ± 0.51 and 15.5 ± 1.21 respectively, but the tracer was washed out of these tissues rapidly with time (Fig. 3c). The tumor/muscle ratios calculated based on the PET quantification were 2.30 ± 0.51, 2.80 ± 0.47 and 4.09 ± 0.50 at 30, 60 and 120 min p.i. respectively. However, the tumor/liver ratio was very low at early time points and only 1.48 ± 0.51 at 120 min p.i. (Fig. 3d).
Fig. 3.
a PET/CT overlay of UM-SCC1 bearing mice imaged with [18F]FBEM-cEGF. b Decay-corrected whole-body coronal microPET images of UM-SCC1 tumor–bearing mice at 30, 60, and 120 min after injection of 3.7 MBq (100 μCi) of [18F]FBEM-cEGF. Tumors are indicated by arrows. c Quantification of [18F]FBEM-cEGF uptake in UM-SCC1 tumor, liver, muscle, and kidney. Data are presented as mean %ID/g ± SD (n=4). d The tumor/muscle and tumor/liver ratios of [18F]FBEM-cEGF at different time points after tracer injection.
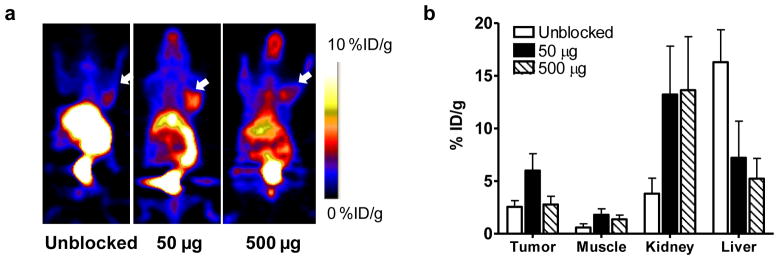
[18F]FBEM-cEGF showed high liver uptake due to the high natural expression of EGFR in the liver [32], which may be problematic. It has been reported that 111In-EGF uptake in the liver can be blocked by unlabeled EGF or EGFR affibody [33]. We also performed blocking assays by co-injection of [18F]FBEM-cEGF with either 50 or 500 μg of unlabeled EGF. Compared with the unblocked group, significantly lower liver uptake, higher tumor uptake and tumor/non-tumor ratios were achieved by blocking with 50 μg of unlabeled EGF at all time points (Fig. 4a). The %ID/g of tumor uptake increased from 2.55 ± 0.59 to 5.99 ± 1.61 (p < 0.01) with co-injection of 50 μg unlabeled EGF and restored to 2.77 ± 0.78 after co-injection of 500 μg unlabeled EGF. The liver uptake decreased significantly from 16.3 ± 3.08 to 7.20 ± 3.48 and further to 5.22 ±1.92 % ID/g with co-injection of 50 μg or 500 μg unlabeled EGF. In contrast, [18F]FBEM-cEGF showed dramatically higher kidney accumulation when co-injected with unlabeled EGF (Fig. 4b).
Fig. 4.
a Decay-corrected whole-body coronal microPET images of UM-SCC1 tumor–bearing mice (right shoulder) at 30 min after injection of 3.7 MBq (100 μCi) of [18F]FBEM-cEGF without or with 50 and 500 μg of unlabeled hEGF. Tumors are indicated by white arrows. b Quantification of [18F]FBEM-cEGF uptake in UM-SCC1 tumors, muscle, liver, and kidney. Data are presented as mean %ID/g ± SD (n=3).
Biodistribution
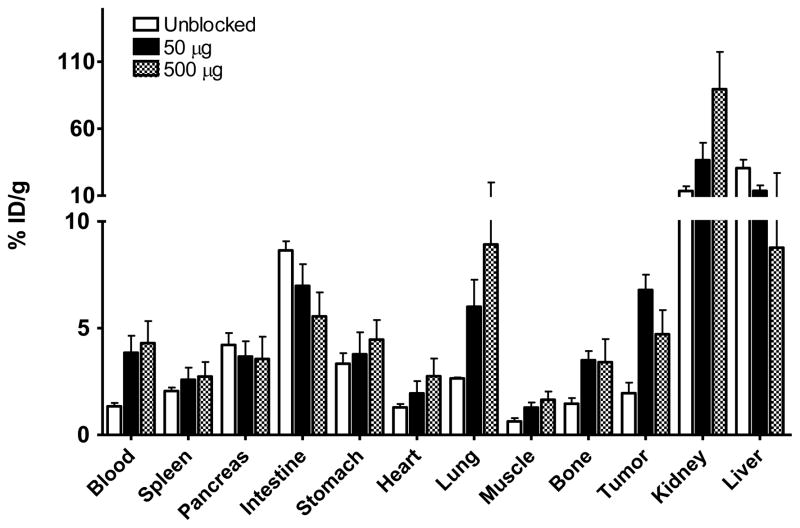
In order to further confirm the PET imaging quantification, the biodistribution of [18F]FBEM-cEGF was evaluated in tumor-bearing nude mice immediately after PET imaging. As shown in Fig. 5, the tumor uptakes were 1.96 ± 0.85, 6.79 ± 1.23 and 3.90 ± 0.36 %ID/g in the unblocked, 50 μg and 500 μg group, respectively, consistent with the PET images. The circulation time of [18F]FBEM-cEGF was much longer since blood tracer concentration increased from 1.34 ± 0.28 to 3.85 ± 1.38 and 3.56 ± 0.06 %ID/g after blocking. The highest tumor uptake was achieved with co-injection of 50 μg of unlabeled EGF. The uptake in the liver significantly decreased, while kidney uptake increased, when the [18F]FBEM-cEGF was co-injected with 50 or 500 μg of unlabeled EGF. The uptake of [18F]FBEM-cEGF also increased significantly in the lung and bone. There was no significant change of uptake in other organs, including pancreas, spleen and stomach.
Fig. 5.
Biodistribution of [18F]FBEM-cEGF at 30 min after injection in UM-SCC1 tumor bearing nude mice. Mice were injected intravenously with 3.7 MBq (100 μCi) of [18F]FBEM-cEGF alone or with either 50 or 500 μg of unlabeled EGF. Data are presented as mean %ID/g ± SD (n = 3).
Dynamic PET
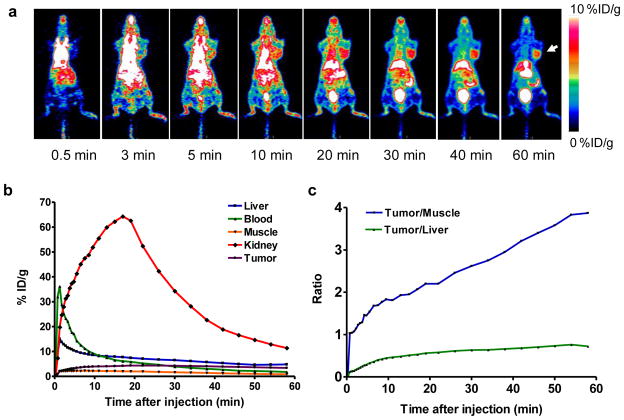
The 60 min dynamic microPET (Fig. 6a) scan showed that the tumor uptake of [18F]FBEM-cEGF in the presence of 50 μg unlabeled EGF gradually increased with time. Time-activity curves (TACs) derived from the scans showed that [18F]FBEM-cEGF was cleared from the circulation very quickly. Kidneys are the major organ for tracer uptake and excretion. The uptake in kidney reached a peak at around 17 min after tracer injection and decreased rapidly thereafter (Fig. 6b). At as early as 10 min after tracer injection, the tumor/muscle ratio was around 2 and kept increasing to a maximum value of around 4 at 60 min after injection (Fig. 6c).
Fig. 6.
a Decay-corrected whole-body coronal microPET images reconstructed from a 60-min dynamic scan after injection of 3.7 MBq (100 μCi) of [18F]FBEM-cEGF with 50 μg of unlabeled hEGF. b Time-activity curves of [18F]FBEM-cEGF in UM-SCC1 tumor, liver, kidney, blood and muscle. c The tumor/muscle and tumor/liver ratios [18F]FBEM-cEGF derived from the time-activity curves.
Discussion
Non-invasive molecular imaging of EGFR would provide valuable information for selection and management of patients for EGFR targeted therapy [18]. EGF has been labeled with various radioisotopes to image EGRF positive tumors with nuclear imaging modalities such as SPECT and PET [26, 28, 34]. To develop EGF-based tracers, a Cys-tag fused human EGF (cEGF) has been prepared to facilitate site-specific labeling of 99mTc or 64Cu [29]. In this study, we achieved site-specific labeling of EGF with 18F using a thiol specific labeling agent with high efficiency and demonstrated by microPET imaging that the 18F- labeled tracer was able to accumulate in EGFR positive UM-SCC1 tumors. We also confirmed that adding the proper amount of nonradioactive EGF effectively increased the tumor uptake and decreased liver accumulation of [18F]FBEM-cEGF.
After labeling with [18F]FBEM, [18F]FBEM-cEGF retained its specific receptor binding since the rapid cellular uptake of the tracer could be effectively blocked by the extra amount of unlabeled hEGF (Fig. 2). Moreover, site-specific labeling minimized the possibility that conjugation would compromise the ligand binding affinity. Nuclear translocation of EGF/EGFR has been detected in many cancer cell lines with high EGFR density [35], thus it is no surprise to observe that more than 70% of [18F]FBEM-cEGF was internalized by UM-SCC1 cells.
It has been confirmed that the high natural expression of EGFR in the liver created a barrier to radionuclide targeting of EGFR expressing tumors by reducing uptake by the tumor and by obscuring it in acquired images [33, 36]. When lowering the specific activity of the radiolabeled affibody against EGFR, the tumor-to-background ratio also increased [37]. Other studies also proved that pre-treating the mice with unlabeled EGF could reduce liver uptake and increase tumor uptake of EGF-based tracers [33, 38]. However, if the interval between injection of the blocking dose and imaging tracer exceeded 30 min, no blocking effect would be observed, which is probably due to the short circulation time of the natural ligand and the rapid internalization and replacement of the targeted receptors [33]. In this study, we also showed that when injected in high specific activity (with no addition of unlabeled EGF peptide), [18F]FBEM-cEGF mainly bound to mouse liver, which can be blocked by co-injection of unlabeled hEGF (Fig. 4). Consistent with the previous studies [33, 38], higher tumor uptake was achieved by blocking the tendency of liver to take up the targeting ligand with 50 μg of unlabled EGF, which further increased the tumor/liver ratio. This strategy would facilitate tumor detection and more efficient EGFR-targeted drug delivery. Nevertheless, unlabeled EGF itself might not be an ideal blocker since high amounts of EGF as an EGFR agonist will stimulate cell proliferation. EGFR antagonists such as antibodies or affibodies can be used as alternatives [33].
Although blocking with either 50 μg or 500 μg decreased liver uptake of [18F]FBEM-cEGF, different tumor uptakes were observed. With 50 μg of unlabeled hEGF, [18F]FBEM-cEGF showed significantly increased tumor accumulation, which resulted in a tumor/muscle ratio of 5.30 ± 0.89, compared to 3.10 ± 0.90 in mice receiving 500 μg hEGF, and 3.87 ± 0.70 in the unblocked group. The possible explanation is that without any blocking dose of EGF, high specific activity [18F]FBEM-cEGF was mainly taken up by the liver and only limited radioactivity was delivered to the tumor, whereas the high dose of unlabeled EGF (500 μg) blocked the receptor-specific binding in both liver and tumor [33]. With 500 μg of unlabeled EGF, we did not fully block the tumor uptake. We speculate that further increase of the blocking dose might totally inhibit tumor uptake of [18F]FBEM-cEGF. The interval between administration of blocking dose and radiotracer may still need to be further optimized to achieve the highest tumor delivery of EGF based probes.
The 60-min dynamic imaging verified the fast clearance of [18F]FBEM-cEGF through both hepatobiliary and renal-urinary routes. This fast clearance resulted in an acceptable tumor/non-tumor contrast in UM-SCC1 tumor bearing mice. With dynamic scanning, the tumor uptake reached a peak later than that with static scans. We speculate that when the mice were kept under isoflurane, the tracer metabolism was slower than that in awake mice [39]. After blocking with unlabeled EGF, both kidney and lung uptake increased in a dose dependent manner. Since liver uptake was lowered, more [18F]FBEM-cEGF remained in the circulation and delivered to the kidneys for excretion. We are not clear about reasons for the increased lung uptake.
Conclusion
We successfully developed a novel EGF-based tracer by site-specifically labeling a Cys-tagged EGF with [18F]FBEM. The EGFR positive UM-SCC1 tumors could be visualized clearly with this imaging tracer. With optimized liver blocking, [18F]FBEM-cEGF has the potential to be used for detection of malignant lesions and for evaluation of EGFR activity in a non-invasive and quantitative manner.
Acknowledgments
This project was supported by the Intramural Research Program of the National Institute of Biomedical Imaging and Bioengineering (NIBIB), National Institutes of Health (NIH) and the International Cooperative Program of the National Science Foundation of China (NSFC) (81028009). We thank Dr. Henry S. Eden for proof-reading the manuscript.
References
- 1.Yarden Y, Sliwkowski MX. Untangling the ErbB signalling network. Nature reviews Molecular cell biology. 2001;2:127–37. doi: 10.1038/35052073. [DOI] [PubMed] [Google Scholar]
- 2.Cai W, Niu G, Chen X. Multimodality imaging of the HER-kinase axis in cancer. Eur J Nucl Med Mol Imaging. 2008;35:186–208. doi: 10.1007/s00259-007-0560-9. [DOI] [PubMed] [Google Scholar]
- 3.Chung CH, Ely K, McGavran L, Varella-Garcia M, Parker J, Parker N, et al. Increased epidermal growth factor receptor gene copy number is associated with poor prognosis in head and neck squamous cell carcinomas. J Clin Oncol. 2006;24:4170–6. doi: 10.1200/JCO.2006.07.2587. [DOI] [PubMed] [Google Scholar]
- 4.Gross ME, Shazer RL, Agus DB. Targeting the HER-kinase axis in cancer. Semin Oncol. 2004;31:9–20. doi: 10.1053/j.seminoncol.2004.01.005. [DOI] [PubMed] [Google Scholar]
- 5.Sharafinski ME, Ferris RL, Ferrone S, Grandis JR. Epidermal growth factor receptor targeted therapy of squamous cell carcinoma of the head and neck. Head Neck. 2010;32:1412–21. doi: 10.1002/hed.21365. [DOI] [PMC free article] [PubMed] [Google Scholar]
- 6.Bonner JA, Harari PM, Giralt J, Azarnia N, Shin DM, Cohen RB, et al. Radiotherapy plus cetuximab for squamous-cell carcinoma of the head and neck. N Engl J Med. 2006;354:567–78. doi: 10.1056/NEJMoa053422. [DOI] [PubMed] [Google Scholar]
- 7.Vermorken JB, Mesia R, Rivera F, Remenar E, Kawecki A, Rottey S, et al. Platinum-based chemotherapy plus cetuximab in head and neck cancer. N Engl J Med. 2008;359:1116–27. doi: 10.1056/NEJMoa0802656. [DOI] [PubMed] [Google Scholar]
- 8.Folprecht G, Lutz MP, Schoffski P, Seufferlein T, Nolting A, Pollert P, et al. Cetuximab and irinotecan/5-fluorouracil/folinic acid is a safe combination for the first-line treatment of patients with epidermal growth factor receptor expressing metastatic colorectal carcinoma. Ann Oncol. 2006;17:450–6. doi: 10.1093/annonc/mdj084. [DOI] [PubMed] [Google Scholar]
- 9.Cohenuram M, Saif MW. Panitumumab the first fully human monoclonal antibody: from the bench to the clinic. Anticancer Drugs. 2007;18:7–15. doi: 10.1097/CAD.0b013e32800feecb. [DOI] [PubMed] [Google Scholar]
- 10.Cunningham D, Humblet Y, Siena S, Khayat D, Bleiberg H, Santoro A, et al. Cetuximab monotherapy and cetuximab plus irinotecan in irinotecan-refractory metastatic colorectal cancer. N Engl J Med. 2004;351:337–45. doi: 10.1056/NEJMoa033025. [DOI] [PubMed] [Google Scholar]
- 11.Saltz LB, Meropol NJ, Loehrer PJ, Sr, Needle MN, Kopit J, Mayer RJ. Phase II trial of cetuximab in patients with refractory colorectal cancer that expresses the epidermal growth factor receptor. J Clin Oncol. 2004;22:1201–8. doi: 10.1200/JCO.2004.10.182. [DOI] [PubMed] [Google Scholar]
- 12.Niu G, Chen X. Has molecular and cellular imaging enhanced drug discovery and drug development? Drugs R D. 2008;9:351–68. doi: 10.2165/0126839-200809060-00002. [DOI] [PubMed] [Google Scholar]
- 13.Goldenberg A, Masui H, Divgi C, Kamrath H, Pentlow K, Mendelsohn J. Imaging of human tumor xenografts with an indium-111-labeled anti-epidermal growth factor receptor monoclonal antibody. J Natl Cancer Inst. 1989;81:1616–25. doi: 10.1093/jnci/81.21.1616. [DOI] [PubMed] [Google Scholar]
- 14.Scopinaro F, De Vincentis G, Banci M, Schillaci O, Di Loreto M, Danieli R, et al. In vivo study of a technetium labelled anti-EGFr MoAB. Anticancer Res. 1997;17:1761–5. [PubMed] [Google Scholar]
- 15.Reilly RM, Kiarash R, Sandhu J, Lee YW, Cameron RG, Hendler A, et al. A comparison of EGF and MAb 528 labeled with 111In for imaging human breast cancer. J Nucl Med. 2000;41:903–11. [PubMed] [Google Scholar]
- 16.Eiblmaier M, Meyer LA, Watson MA, Fracasso PM, Pike LJ, Anderson CJ. Correlating EGFR Expression with Receptor-Binding Properties and Internalization of 64Cu-DOTA-Cetuximab in 5 Cervical Cancer Cell Lines. J Nucl Med. 2008;49:1472–9. doi: 10.2967/jnumed.108.052316. [DOI] [PMC free article] [PubMed] [Google Scholar]
- 17.Ping Li W, Meyer LA, Capretto DA, Sherman CD, Anderson CJ. Receptor-binding, biodistribution, and metabolism studies of 64Cu-DOTA-cetuximab, a PET-imaging agent for epidermal growth-factor receptor-positive tumors. Cancer Biother Radiopharm. 2008;23:158–71. doi: 10.1089/cbr.2007.0444. [DOI] [PubMed] [Google Scholar]
- 18.Niu G, Cai W, Chen K, Chen X. Non-invasive PET imaging of EGFR degradation induced by a heat shock protein 90 inhibitor. Mol Imaging Biol. 2008;10:99–106. doi: 10.1007/s11307-007-0123-2. [DOI] [PubMed] [Google Scholar]
- 19.Koppikar P, Choi SH, Egloff AM, Cai Q, Suzuki S, Freilino M, et al. Combined inhibition of c-Src and epidermal growth factor receptor abrogates growth and invasion of head and neck squamous cell carcinoma. Clin Cancer Res. 2008;14:4284–91. doi: 10.1158/1078-0432.CCR-07-5226. [DOI] [PMC free article] [PubMed] [Google Scholar]
- 20.Niu G, Sun X, Cao Q, Courter D, Koong A, Le QT, et al. Cetuximab-based immunotherapy and radioimmunotherapy of head and neck squamous cell carcinoma. Clin Cancer Res. 2010;16:2095–105. doi: 10.1158/1078-0432.CCR-09-2495. [DOI] [PMC free article] [PubMed] [Google Scholar]
- 21.Colcher D, Esteban J, Mornex F. Use of monoclonal antibodies as radiopharmaceuticals for the localization of human carcinoma xenografts in athymic mice. Methods Enzymol. 1986;121:802–16. doi: 10.1016/0076-6879(86)21078-2. [DOI] [PubMed] [Google Scholar]
- 22.Muller-Schimpfle M, Noack F, Oettling G, Haug G, Kienzler D, Geppert M, et al. Influence of histopathological factors on dynamic MR mammography. Rofo. 2000;172:894–900. doi: 10.1055/s-2000-8366. [DOI] [PubMed] [Google Scholar]
- 23.Niu G, Li Z, Xie J, Le QT, Chen X. PET of EGFR Antibody Distribution in Head and Neck Squamous Cell Carcinoma Models. J Nucl Med. 2009;50:1116–23. doi: 10.2967/jnumed.109.061820. [DOI] [PMC free article] [PubMed] [Google Scholar]
- 24.van der Woning SP, Venselaar H, van Rotterdam W, Jacobs-Oomen S, van Leeuwen JE, van Zoelen EJ. Role of the C-terminal linear region of EGF-like growth factors in ErbB specificity. Growth Factors. 2009;27:163–72. doi: 10.1080/08977190902891010. [DOI] [PubMed] [Google Scholar]
- 25.Rickman OB, Vohra PK, Sanyal B, Vrana JA, Aubry MC, Wigle DA, et al. Analysis of ErbB receptors in pulmonary carcinoid tumors. Clinical cancer research. 2009;15:3315–24. doi: 10.1158/1078-0432.CCR-08-2549. [DOI] [PubMed] [Google Scholar]
- 26.Capala J, Barth RF, Bailey MQ, Fenstermaker RA, Marek MJ, Rhodes BA. Radiolabeling of epidermal growth factor with 99mTc and in vivo localization following intracerebral injection into normal and glioma-bearing rats. Bioconjug Chem. 1997;8:289–95. doi: 10.1021/bc970031s. [DOI] [PubMed] [Google Scholar]
- 27.Cornelissen B, Darbar S, Hernandez R, Kersemans V, Tullis I, Barber PR, et al. ErbB-2 blockade and prenyltransferase inhibition alter epidermal growth factor and epidermal growth factor receptor trafficking and enhance 111In-DTPA-hEGF Auger electron radiation therapy. J Nucl Med. 2011;52:776–83. doi: 10.2967/jnumed.110.084392. [DOI] [PubMed] [Google Scholar]
- 28.Velikyan I, Sundberg AL, Lindhe O, Hoglund AU, Eriksson O, Werner E, et al. Preparation and evaluation of 68Ga-DOTA-hEGF for visualization of EGFR expression in malignant tumors. Journal of nuclear medicine. 2005;46:1881–8. [PubMed] [Google Scholar]
- 29.Levashova Z, Backer MV, Horng G, Felsher D, Backer JM, Blankenberg FG. SPECT and PET imaging of EGF receptors with site-specifically labeled EGF and dimeric EGF. Bioconjug Chem. 2009;20:742–9. doi: 10.1021/bc800443w. [DOI] [PubMed] [Google Scholar]
- 30.Gao H, Niu G, Yang M, Quan Q, Ma Y, Murage E, et al. PET of Insulinoma using 18F-FBEM-EM3106B, a New GLP-1 Analog. Mol Pharm. 2011 doi: 10.1021/mp200141x. [DOI] [PMC free article] [PubMed] [Google Scholar]
- 31.Niu G, Li Z, Xie J, Le QT, Chen X. PET of EGFR antibody distribution in head and neck squamous cell carcinoma models. Journal of nuclear medicine. 2009;50:1116–23. doi: 10.2967/jnumed.109.061820. [DOI] [PMC free article] [PubMed] [Google Scholar]
- 32.Jungbluth AA, Stockert E, Huang HJ, Collins VP, Coplan K, Iversen K, et al. A monoclonal antibody recognizing human cancers with amplification/overexpression of the human epidermal growth factor receptor. Proc Natl Acad Sci U S A. 2003;100:639–44. doi: 10.1073/pnas.232686499. [DOI] [PMC free article] [PubMed] [Google Scholar]
- 33.Kareem H, Sandstrom K, Elia R, Gedda L, Anniko M, Lundqvist H, et al. Blocking EGFR in the liver improves the tumor-to-liver uptake ratio of radiolabeled EGF. Tumour Biol. 2010;31:79–87. doi: 10.1007/s13277-009-0011-2. [DOI] [PubMed] [Google Scholar]
- 34.Sundberg AL, Gedda L, Orlova A, Bruskin A, Blomquist E, Carlsson J, et al. [177Lu]Bz-DTPA-EGF: Preclinical characterization of a potential radionuclide targeting agent against glioma. Cancer Biother Radiopharm. 2004;19:195–204. doi: 10.1089/108497804323071977. [DOI] [PubMed] [Google Scholar]
- 35.Lo HW, Hsu SC, Hung MC. EGFR signaling pathway in breast cancers: from traditional signal transduction to direct nuclear translocalization. Breast Cancer Res Treat. 2006;95:211–8. doi: 10.1007/s10549-005-9011-0. [DOI] [PubMed] [Google Scholar]
- 36.Divgi CR, Welt S, Kris M, Real FX, Yeh SD, Gralla R, et al. Phase I and imaging trial of indium 111-labeled anti-epidermal growth factor receptor monoclonal antibody 225 in patients with squamous cell lung carcinoma. J Natl Cancer Inst. 1991;83:97–104. doi: 10.1093/jnci/83.2.97. [DOI] [PubMed] [Google Scholar]
- 37.Tolmachev V, Rosik D, Wallberg H, Sjoberg A, Sandstrom M, Hansson M, et al. Imaging of EGFR expression in murine xenografts using site-specifically labelled anti-EGFR 111In-DOTA-Z EGFR:2377 Affibody molecule: aspect of the injected tracer amount. Eur J Nucl Med Mol Imaging. 2010;37:613–22. doi: 10.1007/s00259-009-1283-x. [DOI] [PubMed] [Google Scholar]
- 38.Hu M, Scollard D, Chan C, Chen P, Vallis K, Reilly RM. Effect of the EGFR density of breast cancer cells on nuclear importation, in vitro cytotoxicity, and tumor and normal-tissue uptake of [111In]DTPA-hEGF. Nucl Med Biol. 2007;34:887–96. doi: 10.1016/j.nucmedbio.2007.06.010. [DOI] [PubMed] [Google Scholar]
- 39.Fueger BJ, Czernin J, Hildebrandt I, Tran C, Halpern BS, Stout D, et al. Impact of animal handling on the results of 18F-FDG PET studies in mice. J Nucl Med. 2006;47:999–1006. [PubMed] [Google Scholar]


