

Abstract
Target identification is a core challenge in chemical genetics. Here we use chemical similarity to predict computationally the targets of 586 compounds active in a zebrafish behavioral assay. Of 20 predictions tested, 11 had activities ranging from 1 to 10,000nM on the predicted targets. The role of two of these targets was tested in the original zebrafish phenotype. Prediction of targets from chemotype is rapid and may be generally applicable.
Chemical genetics seeks to identify the targets responsible for phenotypes responding to organic small molecules, just as genetic screens identify the molecular players involved in cellular processes. Since the chemical perturbation is non-genetic, this must be done biochemically,1 proteomically,2,3 or by phenotypic pattern recognition.4,5 Such approaches can be laborious and many low-abundance proteins are outside of their purview. Several investigators thus have turned to inference-based methods that combine experiment and computation. Multidimensional screening of hundreds of cell lines by tens of thousands of molecules has led to patterns that can illuminate target identity,6,7 as can matching the transcriptional patterns provoked by an organic molecule to those provoked by molecules with known mechanisms.8,9
Less explored are purely computational methods for target identification, especially those motivated by ligand structure, the basis of target identification in classical pharmacology.10 With the advent of large ligand-protein databases, hundreds of thousands of ligands annotated to thousands of molecular targets are available. This has enabled a redrawing of receptor relationships based on both shared ligands,11 and ligand-disease associations,12 which in turn has been exploited to predict previously unknown targets for drugs.13,14 By the same logic, such an approach might be used to predict the targets of organic molecules active in phenotypic screens.
We thus sought to identify the targets of 681 neuroactive molecules from a 14,000 compound phenotypic screen in zebrafish embryos, measuring the modulation of characteristic movement responses to a series of light flashes (a photomotor response, PMR).15 For each compound, patterns were observed for eight to ten embryos, and 14 behavioral features of the PMR were compared to untreated animals (Supplementary Results, Supplementary Fig. 1 and Supplementary Methods).15 Of the 681 actives, 162 were drugs, chemical probes or naturally occurring molecules, 61 of which had one or more targets annotated in ChEMBL, leaving a total of 620 compounds unannotated. We computationally screened these against the ChEMBL database (https://www.ebi.ac.uk/chembldb/) using the Similarity Ensemble Approach (SEA).13,16 In the filtered version we used, ChEMBL annotates over 167,000 organic molecules for activities against over 2,000 molecular targets. SEA scores shared patterns of chemical functionality between the “bait” molecules and all of the ligands annotated to a target (the ligand-target set), using one of several topological, bit-string fingerprints.17,18 Similarity values are measured by Tanimoto coefficients (TC),19 which range from 0 (no bits in common) to 1 (all bits shared). The similarities between a bait molecule and a ligand-target set were summed and compared to those expected at random. Using the statistical machinery developed for BLAST sequence comparisons, this led to expectation values (E-values) for the similarity versus a random background.13,16,20 In a variation introduced here, bait molecules that bore formal charges that were atypical for a ligand-target set were excluded (Supplementary Fig. 2).
The method is limited to those targets with known ligands. Still, most target categories are covered, all of which are “ligandable”. For instance, using the widely-used ECFP4 fingerprint,17 473 of the 681 molecules were predicted to be active on 945 targets with E-values better than 10−5 (Fig. 1); at a more stringent E-value of 10−20, 284 molecules were predicted to be active on 404 targets. Similar results were obtained for the other fingerprints, resulting in combined predictions for 586 compounds with E-values < 10−5. Targets with strong predictions included G Protein-Coupled Receptors (GPCRs), ligand-gated ion channels, nuclear hormone receptors, transporters, and soluble enzymes (Supplementary Table 1).
Figure 1. The number of compounds for which at least one target is predicted as a function of expectation value vs. random (E-value).

Higher E-values are less stringent. Only E-values below (better than) 10−5 were considered in this analysis.
We emphasized targets that were predicted with strong E-values, that were previously unknown for the phenotypically active molecules, and that were experimentally accessible to us. For this study, we investigated GPCRs, ion channels, transporters, and kinases. Many target predictions were unknown in ChEMBL but were subsequently were found on literature search (Supplementary Table 2). Since we were interested in novel predictions, we focused on 20 compounds predicted against unknown targets. Of these, 11 were active at 22 of the 31 targets against which they were predicted (Table 1, Supplementary Fig. 3); 9 compounds had no measurable activity on their predicted targets and these associations are considered falsified (Supplementary Table 3). Potencies, measured in full concentration-response, ranged from about 10 µM to low nanomolar (Table 1, Supplementary Fig. 3). As noted previously14 there was little correlation between potency and SEA E-value. Potency is ignored in weighting the ligand similarities in SEA; E-values only indicate the likelihood that the compound will be active at a relevant concentration.13,16
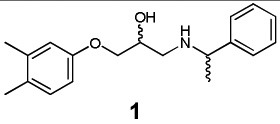
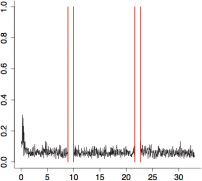
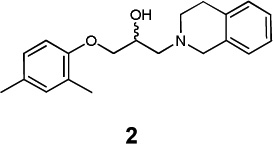
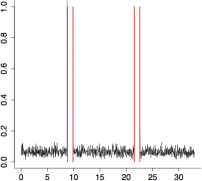
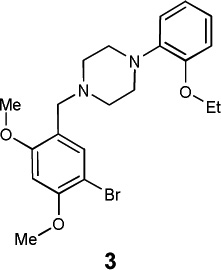
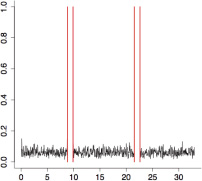
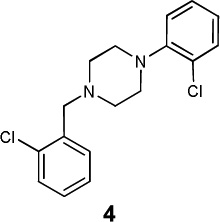
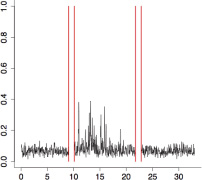
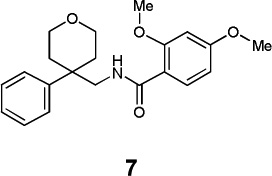
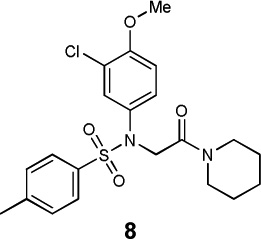
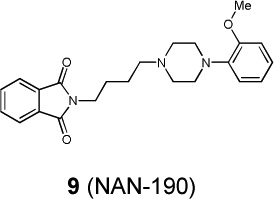
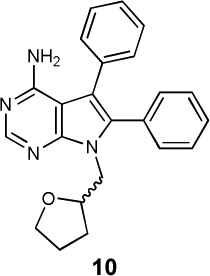
Table 1.
Target predictions, E-values (ECFP4), maximum Tanimoto coefficient and binding affinities for compounds active in the Zebrafish photomotor response screen.
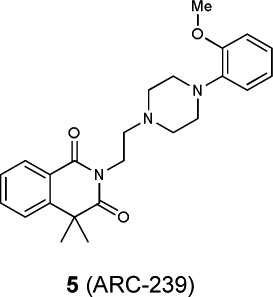
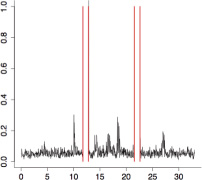
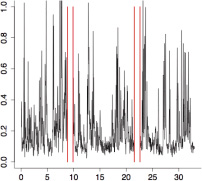
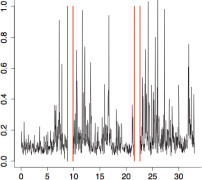
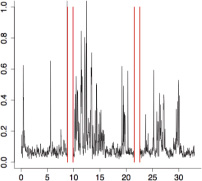
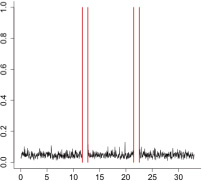
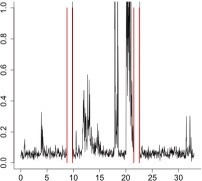
| Cpd. | PMR Plota | Predicted targets |
E-value | Max. TC | Ki (nM) |
|---|---|---|---|---|---|
 |
 |
β1 AR | 2.99×10⁻¹⁸ | 0.47 | 337 |
| β2 AR | 4.69×10⁻¹⁵ | 0.43 | 728 | ||
| β3 AR | 4.55×10⁻¹⁹ | 0.47 | 589 | ||
 |
 |
β1 AR | - | - | 965 |
| β2 AR | 2.98×10−05b | 0.61b | 550 | ||
| β3 AR | 2.98×10−05b | 0.61b | 3128 | ||
 |
 |
dopamine D2 | 3.54×10⁻³³ | 0.63 | 120 |
| dopamine D3 | 8.16×10−41 | 0.63 | > 10,000 | ||
| dopamine D4 | 1.00×10⁻²⁴ | 0.49 | 5.0 | ||
| α1A AR | 2.07×10−48 | 0.49 | 113.6 | ||
| α1B AR | 1.19×10−48 | 0.49 | 29.7 | ||
| α1D AR | 3.89×10−48 | 0.49 | 25.4 | ||
| α2A AR | 2.01×10⁻²⁷ | 0.43 | 164 | ||
| α2B AR | 2.83×10⁻²⁶ | 0.43 | 96.4 | ||
| α2C AR | 1.84×10⁻²⁶ | 0.43 | 80.8 | ||
| 5-HT1A | 3.83×10−67 | 0.53 | 65.0 | ||
| 5-HT1B | 1.62×10⁻¹⁶ | 0.49 | 9422 | ||
| 5-HT1D | 7.55×10⁻¹⁷ | 0.49 | 153 | ||
 |
 |
dopamine D2 | 2.78×10−42 | 0.55 | 4869 |
| dopamine D3 | 1.46×10−46 | 0.58 | 946 | ||
| dopamine D4 | 2.25×10−49 | 0.58 | 1181 | ||
| 5-HT1A | 1.24×10⁻³¹ | 0.53 | 2439 | ||
| 5-HT1B | 1.61×10⁻¹² | 0.53 | > 10,000 | ||
| 5-HT1D | 2.32×10⁻¹⁶ | 0.53 | 4512 | ||
 |
 |
dopamine D2 | 2.15×10−38 | 0.66 | 207 |
| dopamine D3 | 9.25×10−44 | 0.65 | 164 | ||
| dopamine D4 | 8.28×10⁻²⁵ | 0.47 | 530 | ||
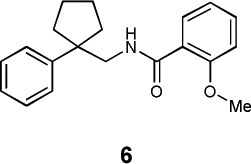 |
 |
Kv1.1 | 4.05×10−71 | 0.72 | n.d. |
| Kv1.2 | 9.40×10−85 | 0.72 | 1930c | ||
| Kv1.3 | 1.28×10⁻¹⁴ | 0.72 | n.d. | ||
 |
 |
Kv1.1 | 9.69×10−56 | 0.56 | n.d. |
| Kv1.2 | 1.18×10−66 | 0.56 | 2810c | ||
| Kv1.3 | 1.74×10⁻¹⁰ | 0.56 | n.d. | ||
 |
 |
oxytocin | 1.60×10⁻²⁶ | 0.52 | > 10,000 |
| vasopressin | 8.32×10⁻¹⁰ | 0.52 | 690 | ||
| 1A | |||||
 |
 |
SERT | 2.06×10⁻¹⁹ | 0.52 | 6200d |
 |
 |
ABL2 | 1.62×10−54 | 0.42 | 7460c,e |
| SRC | 3.38×10⁻³⁴ | 0.42 | 3820c,e | ||
| LCK | 2.51×10⁻³⁰ | 0.45 | 1890c,e | ||
 |
 |
p38α | 2.68×10⁻¹⁰ | 0.42 | 47% Inh. @ 1µM |
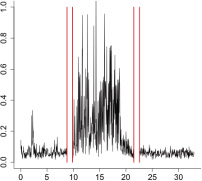
The aggregate motor activity of 10 zebrafish embryos during the PMR assay. The y-axis and x-axis represent the motion index and time, respectively. Red vertical bars at 10s and 23s represent the timing and duration of the stimulus.
Calculated with Daylight fingerprints (note that TC values are not comparable across different fingerprints; Daylight fingerprints usually give higher TC values than ECFP4 for the same compound pairs).
IC50 (nM).
EC50 (nM).
Assuming competitive inhibition, and based on the Cheng-Prusoff equation, Ki values would be about half the IC50 values for the kinase inhibitors.
It is appropriate to consider the accuracy and the novelty of the predictions. Arguably, any method that used a library of ligand-target sets, such as ChEMBL, and a metric of chemical similarity could have predicted targets for some of these molecules. For instance, pair-wise compound similarity alone, or one of the more sophisticated methods now available,7,11,12,21,22 may well have suggested that compounds 6 and 7 targeted the Kv1.2 potassium channel, or that 8 targeted vasopressin receptors. Any such approach must confront the problem of what level of chemical similarity usefully identifies likely targets; if one’s similarity cut-off is too permissive it will capture too many targets, and if too stringent many likely targets will be missed. For instance, the pair-wise similarity of 2 for βAR ligands and of 3 for α2AR ligands never rose above a Tanimoto coefficient (TC) of 0.61 (Daylight fingerprints) or 0.43 (ECFP4 fingerprints), respectively. At these relatively low similarities, a simple 2D similarity search of ChEMBL predicts 217 targets for 2 and 57 targets for 3, many of which will be false positives. SEA attempts to address this problem by comparing similarities to those expected at random, and by comparing any bait molecule to an entire ligand-target set.13,16 This at once increases the number of targets addressable, ranks the predictions by confidence level, and eliminates many predictions that hang by a bait’s association with one or two ligands in a target set that might annotate hundreds of molecules. Because SEA is model-free and uses all information represented in a fingerprint, without weighting, it can interrogate any ligand-target set for similarity to any bait molecule without defining warheads or pharmacophores.
A key challenge, for us and for the field, is linking the targets for which in vitro affinity is measured to the in vivo phenotype that was originally observed. One way to investigate this, is to test another molecule, known to be active on the target but structurally dissimilar to the active compound from the phenotypic screen, for its ability to phenocopy the original “bait” molecule in the animal or cell.23 The voltage-gated potassium channel Kv1.2 is attractive for this purpose in that it is modulated by structurally diverse molecules. Psora-4 (12), for instance, has low- to mid-nanomolar activity at members of the Kv1 family, including Kv1.2, but is structurally orthogonal to compounds 6 and 7. Consistent with the prediction that compounds 6 and 7 exert their excitatory phenotype by blocking this family of ion channels, the photomotor response (PMR) induced by the chemically unrelated compound 12 closely resembled that of compounds 6 and 7 (Fig. 2, Supplementary Fig. 4).
Figure 2. Testing target relevance by phenocopy and functional competition. Compounds 6 and 7 phenocopy the known Kv inhibitor psora-4 (12).

The PMR phenotypes of animals treated with (a) DMSO, (b) compound 12, (c) compound 6. The same phenotype was obtained for compound 7 (see Table 1). (d) Bar plot showing the mean number of motor activity spikes in animals treated with DMSO, compound 12, compound 7, and compound 6. Activities during background, excitation and refractory phases of the PMR are shown. Compound 1 suppresses β-AR agonist-induced motor excitation. The PMR phenotypes of animals treated with: (e) compound 13 (isoproterenol), (f) compound 13 and the known β-AR antagonist compound 14 (bopindolol) together (g) compounds 13 and 1. (h) Bar plot showing the mean number of motor activity spikes in animals treated with DMSO, compound 13, compounds 13 and 14, and compounds 13 and 1. Activities during background, excitation and refractory phases of the PMR are shown. Bars in panels d and h represent mean values ± s.d.
A second pharmacological test for a target-based effect is to use the screening compound to compete against the function of a known ligand for the target of interest. We tested the ability of compound 1 to reverse the activity of the β-adrenergic agonist isoproterenol (13), an excitatory ligand in the PMR assay. Consistent with the prediction and in vitro observation of activity on the β-adrenergic receptors, compound 1 reversed the isoproterenol’s excitatory PMR, doing so as well as the well-known β-adrenergic antagonist bopindolol (Fig. 2, Supplementary Fig. 5). Meanwhile, 1 did not reverse the excitatory phenotype of drugs acting on other receptor classes, such as the digitoxigenins, nor did sedative drugs from other classes reverse the excitatory activity of isoproterenol (Supplementary Fig. 6). These results are consistent with the zebrafish phenotype of compound 1 being mediated via β-adrenergic receptors.
A chemoinformatic approach to target identification in phenotypic screens has important advantages and may complement empirical approaches: it is rapid, has a relatively high success rate, and can address both high- and low-abundance targets. Admittedly, there are important cautions: the approach is limited to liganded targets, and even for these almost a half of the predictions that were tested were falsified, as was true in earlier studies.13,14 Still, this success rate seems high enough to be useful for target prioritization for testing. Especially when a purely empirical screen is laborious, and when low-abundance targets will be missed, this and related methods11,12,22,24 will usefully complement purely experimental approaches. Although establishing that a molecule is active against a particular target does not establish the role of that target in the phenotype, it does provide a testable molecular hypothesis. Whereas the method is restricted to the targets for which ligand information is available, one can at least be sure that these are “ligandable”, and that small molecule probes already exist within that small part of chemical space that has been explored.25 Within this set, the method is systematic and comprehensive enough to suggest testable targets for most of the ligands active in even a diverse ligand library, such as tested here (Table 1). It may thus find broad application to target identification in phenotypic screens; to this end we have developed a public website from which the method may be accessed by the community (http://sea.bkslab.org/ and http://sea.bkslab.org/search/).
Supplementary Material
ACKNOWLEDGEMENTS
We thank Scooter Morris for help with Cytoscape and the Cluster and Cheminformatics plugins. Supported by NIH Grants GM71896 (to JJI & BKS), AG02132 (to S. Prusiner and BKS), MH085205 and MH086867 (to RP), MH091449 (to DK), R01 MH093603 and R01 NS49272 (to DLM), a Rogers Family Foundation “Bridging-the-Gap Award“ (to MJK and JJI), the NIMH Psychoactive Drug Screening Program, U19MH82441 and the Michael Hooker Chair (to BLR), a postdoctoral fellowship from the Max Kade Foundation (to CL), and an EMBO Longterm postdoctoral fellowship (to AT).
Footnotes
AUTHOR CONTRIBUTIONS
The chemoinformatic/phenotypic strategy was devised by BKS and RTP, the PMR assay by DK, and target predictions and most other calculations by CL, with assistance and editing by JJI, MK, HL, and BKS. Ion channel strategy was devised and implemented by DLM and AT, GPCR and kinase strategies were designed and implemented by BLR and VS, who also advised on target-phenotype associations. Zebrafish pharmacology was conducted by DK with assistance by CYJC.
COMPETING INTERESTS STATEMENT
The authors declare no competing financial interests.
REFERENCES
- 1.Harding MW, Galat A, Uehling DE, Schreiber SL. Nature. 1989;341:758–760. doi: 10.1038/341758a0. [DOI] [PubMed] [Google Scholar]
- 2.Leung D, Hardouin C, Boger DL, Cravatt BF. Nat. Biotechnol. 2003;21:687–691. doi: 10.1038/nbt826. [DOI] [PubMed] [Google Scholar]
- 3.Ong SE, et al. Proc. Natl. Acad. Sci. USA. 2009;106:4617–4622. doi: 10.1073/pnas.0900191106. [DOI] [PMC free article] [PubMed] [Google Scholar]
- 4.Mayer TU, et al. Science. 1999;286:971–974. doi: 10.1126/science.286.5441.971. [DOI] [PubMed] [Google Scholar]
- 5.Haggarty SJ, et al. Chem. Biol. 2000;7:275–286. doi: 10.1016/s1074-5521(00)00101-0. [DOI] [PubMed] [Google Scholar]
- 6.Schreiber SL. Nat. Chem. Biol. 2005;1:64–66. doi: 10.1038/nchembio0705-64. [DOI] [PubMed] [Google Scholar]
- 7.Seiler KP, et al. Nucleic Acids Res. 2008;36:D351–D359. [Google Scholar]
- 8.Palchaudhuri R, Hergenrother PJ. ACS Chem. Biol. 2011;6:21–33. doi: 10.1021/cb100310h. [DOI] [PMC free article] [PubMed] [Google Scholar]
- 9.Lamb J, et al. Science. 2006;313:1929–1935. doi: 10.1126/science.1132939. [DOI] [PubMed] [Google Scholar]
- 10.Keiser MJ, Irwin JJ, Shoichet BK. Biochemistry. 2010;49:10267–10276. doi: 10.1021/bi101540g. [DOI] [PMC free article] [PubMed] [Google Scholar]
- 11.Paolini GV, Shapland RH, van Hoorn WP, Mason JS, Hopkins AL. Nat. Biotechnol. 2006;24:805–815. doi: 10.1038/nbt1228. [DOI] [PubMed] [Google Scholar]
- 12.Yildirim MA, Goh KI, Cusick ME, Barabasi AL, Vidal M. Nat. Biotechnol. 2007;25:1119–1126. doi: 10.1038/nbt1338. [DOI] [PubMed] [Google Scholar]
- 13.Keiser MJ, et al. Nat. Biotechnol. 2007;25:197–206. doi: 10.1038/nbt1284. [DOI] [PubMed] [Google Scholar]
- 14.Keiser MJ, et al. Nature. 2009;462:175–181. doi: 10.1038/nature08506. [DOI] [PMC free article] [PubMed] [Google Scholar]
- 15.Kokel D, et al. Nat. Chem. Biol. 2010;6:231–237. doi: 10.1038/nchembio.307. [DOI] [PMC free article] [PubMed] [Google Scholar]
- 16.Hert J, Keiser MJ, Irwin JJ, Oprea TI, Shoichet BK. J. Chem. Inf. Model. 2008;48:755–765. doi: 10.1021/ci8000259. [DOI] [PMC free article] [PubMed] [Google Scholar]
- 17.Rogers D, Hahn M. J. Chem. Inf. Model. 2010;50:742–754. doi: 10.1021/ci100050t. [DOI] [PubMed] [Google Scholar]
- 18.James C, Weininger D, Delany J. Daylight Theory Manual. Aliso Viejo, CA: Daylight Chemical Information Systems Inc.; 1992–2008. [Google Scholar]
- 19.Willett P, Barnard JM, Downs GM. J. Chem. Inf. Comput. Sci. 1998;38:983–996. [Google Scholar]
- 20.Altschul SF, Gish W, Miller W, Myers EW, Lipman DJ. J. Mol. Biol. 1990;215:403–410. doi: 10.1016/S0022-2836(05)80360-2. [DOI] [PubMed] [Google Scholar]
- 21.Young DW, et al. Nat. Chem. Biol. 2008;4:59–68. doi: 10.1038/nchembio.2007.53. [DOI] [PubMed] [Google Scholar]
- 22.Mestres J, Gregori-Puigjane E, Valverde S, Sole RV. Mol. Biosyst. 2009;5:1051–1057. doi: 10.1039/b905821b. [DOI] [PubMed] [Google Scholar]
- 23.Alderton W, Davenport R, Fish PV. Drugs Fut. 2010;35:517–521. [Google Scholar]
- 24.Kinnings SL, et al. PLoS Comput. Biol. 2009;5:e1000423. doi: 10.1371/journal.pcbi.1000423. [DOI] [PMC free article] [PubMed] [Google Scholar]
- 25.Hert J, Irwin JJ, Laggner C, Keiser MJ, Shoichet BK. Nat. Chem. Biol. 2009;5:479–483. doi: 10.1038/nchembio.180. [DOI] [PMC free article] [PubMed] [Google Scholar]
Associated Data
This section collects any data citations, data availability statements, or supplementary materials included in this article.