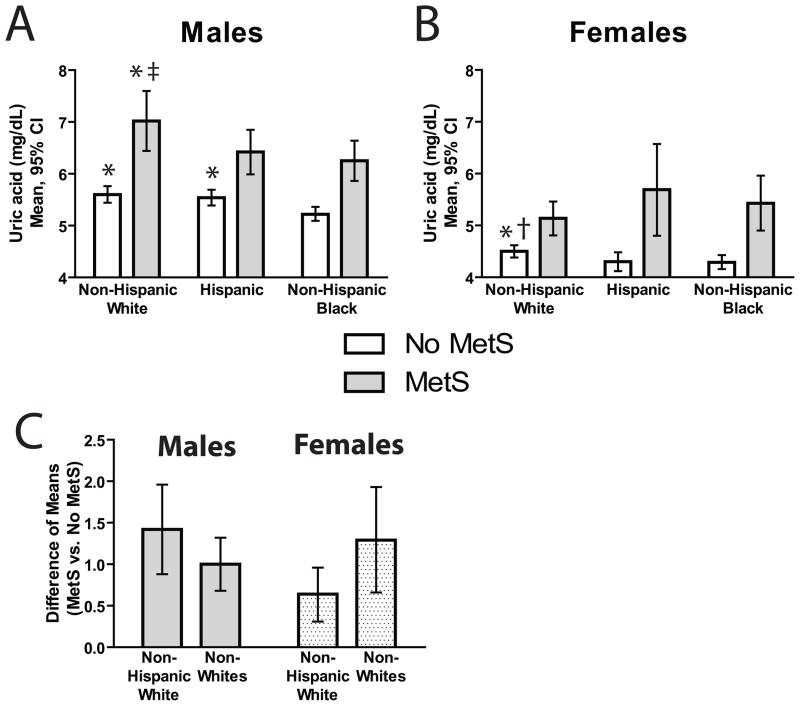
Figure 1. Comparison of Uric Acid Levels by Race/Ethnicity, Gender and MetS Status.
A and B, Adjusted means of uric acid by gender, race/ethnicity and MetS status. Estimated means (95% CI’s) for males (A) and females (B) among adolescents with and without MetS. C, Ratio of adjusted means (and 95% CI’s) of uric acid (MetS+/MetS-) for non-Hispanic whites and non-whites (non-Hispanic blacks and Hispanics combined) among males and females. The pattern of these inter-ethnic differences between whites and other ethnicities is significantly different between non-Hispanic-white males and females (p<0.05). Comparisons between ethnic groups by corresponding MetS status are: * p<0.05 vs. non-Hispanic blacks, ‡ p<0.05 vs. Hispanics and † p<0.05 vs. non-Hispanic blacks and Hispanics combined.

