

Abstract
G protein-coupled receptor kinases (GRKs) regulate the function of G protein-coupled receptors (GPCRs). Previously, we found that GPCR (CXCR4)-mediated astrocytoma growth was dependent upon abnormally sustained CXCR4 signaling and was correlated with decreased GRK-mediated receptor phosphorylation. As CXCR4 has also been implicated in the stimulation of high-grade glioma growth, we sought to determine whether dysregulation of GRK expression and/or function might also be present in high-grade gliomas. In an analysis of data from The Cancer Genome Atlas we found that GRK3 expression is frequently decreased in GBM of the Classical subtype, which possess signature amplification or mutational activation of the EGF receptor. We tested the correlation between GRK3 expression and GBM subtypes, as well as the relationship between the activation of the EGF and other growth factor receptor pathways and GRK expression. In analyses of primary GBM tissue and RNA specimens, we found that GRK3 expression is correlated with established criteria for GBM subtyping including expression of EGF receptor, PDGFRα receptor, NF1, PTEN, CDKN2A and neurofilament. We also found that established drivers of gliomagenesis, the EGF, PDGF and TGF-β pathways all regulate GRK expression. Co-culture experiments, designed to mimic critical interactions between tumor and brain microvascular endothelial cells, demonstrated that specifically increasing GRK3 expression reduced the trophic effect of endothelial cells on tumor cells. Together, these experiments demonstrate that GRK3 is a negative regulator of cell growth whose expression is preferentially reduced in GBM of the Classical subtype as a consequence of activity in primary gliomagenic pathways.
Keywords: GRK, GPCR, GBM, TCGA, Molecular Subtypes
Introduction
G protein coupled receptors (GPCRs) are known to regulate virtually all aspects of cell biology, and comprise the single largest family of targets for current pharmaceuticals (reviewed in (1)). While their involvement in cellular proliferation, survival, migration, as well as angiogenesis and inflammation are active areas of research, their role in oncogenesis and their value as therapeutic targets in cancers remains to be fully defined (reviewed in (2, 3)). Interestingly, functionally significant mutation, amplification or deletion of GPCR genes rarely occurs in cancer. While activating mutations of GPCRs that endow transforming activity are described, they are infrequent with limited significance to cancer biology beyond the proof of concept that dysregulated GPCR signaling can drive tumorigenesis (4-8).
Mechanisms of aberrant GPCR action more commonly arise through receptor overexpression and/or paracrine activation. Consistent with ligand-dependent roles of GPCRs in cancer, competitive antagonists of GPCR-ligand binding, such as the CXCR4 antagonists AMD3100 and AMD3465 have exhibited significant anti-tumor activity in preclinical models of brain tumors (9-11). However, a simple correlation between receptor binding and GPCR function in cancer is called into question by the multiple levels of counter-regulation that normally oppose sustained GPCR ligand activation. Counter-regulatory mechanisms include the inherent GTPase activity of the heterotrimeric Gα subunits, the GTPase activating activity of Regulators of G Protein Signaling (RGS) proteins and the multi-stage process of receptor desensitization (reviewed in (12)). These mechanisms of counter-regulation normally buffer against the aberrant or sustained activation that might occur in the presence of constant ligand stimulation. This feature of GPCR signaling raises the question of whether the contribution of GPCRs to cancer biology might require both increased receptor ligation and alterations in counter-regulatory mechanisms like desensitization.
G protein receptor desensitization is initiated by the phosphorylation of ligand-occupied receptor by G protein receptor kinases (GRKs) (13). The phosphorylated receptor is bound by arrestins, resulting in its uncoupling from heterotrimeric G proteins and subsequent internalization. GRKs comprise a family of serine/threonine kinases with seven members (GRK1-7) that are distinguished into three subfamilies (14). GRKs 1 and 7 are the visual GRKs with expression primarily restricted to photoreceptors where they modulate opsin signaling. GRKs 2 and 3 share an important regulatory domain that facilitates their dynamic recruitment to the membrane by PIP2 and Gβγ (15). GRK4-6 are more tonically localized to the inner surface of the plasma membrane by covalent lipid modification or via lipid binding domains. GRK2,3,5 and 6 are expressed in nearly all tissues while GRK4 exhibits more limited expression.
As the GPCR family contains over 800 members and only 4 GRKs (2,3,5,6) are widely expressed, individual GRKs must modulate the signaling of many receptors. In addition, individual GPCRs appear to be regulated by multiple GRKs. As an example, GRK2, 3 and 6 phosphorylate CXCR4 (16-22). Individual phosphorylation events can display site specificity, kinetic differences and differential impact on downstream mediators. Thus, in a heterologous system, phosphorylation of CXCR4 by GRK2 and 6 and recruitment of arrestin-3 more potently regulated calcium flux than phosphorylation by GRK3 and 6, which recruit arrestin-2 and regulate Erk activation (23). Therefore, despite the potential for extensive redundancy, non-overlapping GRK function in regulating specific GPCR activities exists. In fact, alterations in specific GRK expression or function, or mutation of GPCRs that interfere with desensitization are recognized as the mechanistic basis for diseases like hypertension, rheumatoid arthritis, mental illness and immunodeficiency (reviewed in (24)).
Among the GPCRs frequently implicated in cancer biology is CXCR4 (25). CXCR4 is highly expressed in brain tumors of multiple lineages, and its level of expression has prognostic significance for some brain tumors, including astrocytomas (gliomas) (26-28). In a model of pre-neoplastic astrocytes involving complete loss of neurofibromin, we found that treatment with the CXCR4 ligand, CXCL12, resulted in an abnormal survival response (22). This abnormal survival response was dependent upon sustained CXCR4 signaling, suggestive of diminished receptor desensitization. The complete loss of neurofibromin resulted in an increase in Erk activation and the alteration in CXCR4 function was correlated with increased Erk-dependent phosphorylation and inhibition of GRK2, and diminished ligand-induced phosphorylation (desensitization) of CXCR4.
These data suggested that changes in GRK expression or activity might promote oncogenic GPCR function. These data further suggested that the mechanism of altered GRK activity could be downstream of primary oncogenic events like those that activate the RAS-MAP kinase pathway. Based on these results we hypothesized that GRK expression may be altered in glioma (astrocytoma) and contribute to neoplastic growth. To address this hypothesis we examined GRK expression and function in astrocytomas and the relationship between changes in specific GRK expression and common oncogenic events in gliomagenesis.
Materials and Methods
All chemicals and reagents were from Sigma-Aldrich, St. Louis, MO unless otherwise noted.
The Cancer Genome Atlas Data Analysis
Gene expression data for the original 202 profiled GBM specimens (File: TCGA_unified_CORE_ClaNC840.txt,Cancer Cell) were obtained at: http://tcga-data.nci.nih.gov/docs/publications/gbm_exp/. The sample set was divided into four molecular subclasses of GBM based on signature genetic alterations: (i) Classical, (ii) Mesenchymal, (iii) Proneural and (iv) Neural (29, 30). Subtype-characteristic centroid profiles were obtained by averaging the subset of genes defining each GBM subtype. We then explored the relationship between the four centroid profiles with each GRK gene expression profile by pair-wise scatter plots and Pearson correlation coefficients (Supplemental Figure 1). GRK gene expression was tested between subjects of different subtypes by two sample t-test in a pair-wise manner, and Bonferroni correction was applied to adjust the resulting raw p-values.
Human Tissues
All human specimens were obtained and analyzed in accordance with an Institutional Review Board approved protocol for human studies. Astrocytoma tissue sections (WHO grades I-IV) were obtained from archived paraffin embedded blocks provided by the Department of Pathology and Immunology, Washington University School of Medicine. Additional Glioblastoma tissue microarray slides (GL806a) were obtained from US Biomax, Inc (Rockville, MD). RNA specimens were obtained from archived glioblastoma specimens from The Siteman Cancer Center Tissue Procurement Core, Washington University School of Medicine. Additional human astrocyte RNA specimens were obtained from Clontech Laboratories (Mountain View, CA), Origene (Rockville, MD), Ambion (Foster City, CA), and Biochain (Hayward, CA).
Immunohistochemistry (IHC)
Immunohistochemical analyses, except for IDH1 analysis were performed as previously described (31). Antibodies, their sources and details of their use are presented in Supplemental Table 1. IDH1 mutational analysis was performed with a BenchMark XT automated tissue staining system (Ventana Medical Systems, Inc., Tucson, AZ) using a validated protocol. Endogenous peroxidase activity was blocked by H2O2 and antigen was retrieved using CC1 reagent (Ventana Medical Systems). Mutant IDH1 (IDH1-R132H) was detected with a specific mouse monoclonal antibody (clone H09, 1:500, Dianova, Hamburg, Germany), Ventana signal amplification kit and Ventana UltraView diaminobenzidine chromogen treatment (Ventana medical Systems). Slides were counterstained with hematoxylin.
Fluorescence In Situ Hybridization (FISH)
Fluorescence In Situ hybridization for EGF receptor amplification was performed on deparaffinized GBM tissue microarray (GL806a, US Biomax) as described (32). Briefly, after antigen retrieval in Citrate Buffer pH 5.8, tissue was digested with pepsin and equilibrated in 2X SSC. Vysis premixed probe sets for CEP7 and EGFR were denatured and hybridized to the GBM specimens according to the manufacturer’s instructions (Abbott, Abbott Park, IL). After washing in 2X SSC, the tissue microarray was counterstained with DAPI.
Polymerase Chain Reaction (PCR)
cDNA was synthesized from 100 ng of GBM and human astrocyte RNA using iScript RTase. Specific transcripts were amplified using the power SYBR GREEN PCR Master Mix (Applied Biosystems (Carlsbad, CA)) according to the manufacturer’s instructions. Primers for each mRNA (Supplemental Table 2) were obtained from Integrated DNA Technologies (Iowa City, IA) and used at 300 nmol/L. Samples were run in triplicate with a corresponding β-actin or GAPDH control for each specimen. PCR and data collection were done using the BioRad MiniOpticon Real Time PCR machine and Opticon Monitor 3 Software from BioRad (Hercules, CA). Relative transcript copy number for each transcript and corresponding β-actin or GAPDH were calculated using the delta-delta-C(t) method. The relative expression value for each transcript was normalized to its corresponding β-actin or GAPDH. Data are presented as the GBM expression relative to human astrocyte expression.
Cell Culture
Primary human astrocytes (HA) and primary human brain microvascular endothelial cells (HBMEC) were obtained from ScienCell™ Research Laboratories (Carlsbad, CA). Each was grown in specific media as suggested by supplier. Glioma cell lines included U87 MG (ATCC, Manassas, VA), LN 308, LN 827 and LN 428. The latter three were a kind gift from Erwin van Meir (Winship Cancer Center, Emory University Atlanta GA)(33). U87 cells were engineered to express EGFR or EGFRviii as described (34). All glioma cell lines were grown in DMEM and used within 6 months of their initial culture. Culture media was supplemented with fetal bovine serum and contained penicillin/streptomycin (CellGro).
Growth factor and Drug treatment
For experiments employing growth factor and drug treatments, cells were cultured in serum free (SF) media for 24 hours prior to treatments. Control cells were maintained in SF conditions alone. Final concentrations of growth factors were as follows: CXCL12 1μg/ml (Peprotech, Rock Hill, NJ), EGF 10ng/ml (R&D Systems Inc. Minneapolis, MN), PDGF 10 ng/ml (R&D Systems) and TGF-β 1 2ng/ml (R&D Systems). Inhibition of EGFR was accomplished using PD153035 at 0.1 μM and 10 μM (EMD Chemicals, Gibbstown, NJ). The lower molarity (0.1μM) blocked auto-phosphorylation of EGFR while the higher molarity (10μM) also abrogated phosphorylation of ERK and Akt (35). Experiments were repeated a minimum of three times.
Western Blot Analysis
Western blot analysis was performed as previously described (22). Quantification was carried out with the use of Image J freeware from the NIH. Observed molecular weights for the GRKs differed little from the predicted weights found in the Swiss Protein Database online (http://www.uniprot.org/).
GRK Over-expression
GRK2 and 3 transgenes were cloned into a lentiviral packaging vector also encoding mCherry fluorescent protein (36). Virus encoding each GRK was produced at The Hope Center of Washington University Viral Vectors Core. U87 MG and LN 428 cells were infected with virus for each GRK and selected by Fluorescence-activated Cell Sorting as previously described (37). GRK expression was verified by Western blot analysis.
Glioblastoma Cell Line-Human Brain Micro-Endothelial Cell Co-culture
Co-cultures of human brain microvascular cells and GBM cells were established in Matrigel as described (38, 39). Briefly, primary HBMEC were seeded onto plates coated with Matrigel™ extracellular matrix (BD Biosciences, San Jose, CA) and grown in EGM®-2MV (Lonza, Walkersville, MD). Endothelial cells added to Matrigel™ form networks mimicking a vascular bed within 24 hours. After 24 hours, either U87 or LN 428 were added to the culture plates and grown for 24 to 48 hours in serum-free DMEM (Gibco). Tumor cells were previously engineered to express a fusion protein of firefly luciferase and enhanced green fluorescent protein (37). Bioluminescence imaging was used to measure the growth effects of endothelial cells on GBM cells. Media was removed and imaging media containing HBSS (CellGro) and D-Luciferin (Biosynth; Itasca, IL) was added at a final concentration of 150 ug/mL. Photon flux for each well was measured with a charge-coupled device camera (IVIS 50; Caliper; 60 second exposure; f-stop: 1; binning: 8; field of view: 15 cm; filter: open). Endothelial cells did not express luciferase and thus only the tumor cell growth was measured. Data were analyzed using Living Image/Igor Pro software (Caliper), and expressed as total photon flux (photons/s). A standard curve for the relation between cell numbers and photon flux was determined from a serial dilution of tumor cells. Cell numbers were calculated from the standard curve.
Additional Statistical Methods
Box and whisker plots were used to illustrate the overall distribution of quantitative variables while error bar plots were drawn to indicate mean and standard error of the mean (sem). Two sample t-test and Wilcoxon rank sum test were applied as appropriate to examine whether quantitative variables distinguished between two groups. To address the multiple testing issue, the most stringent Bonferroni correction procedure was used to adjust raw p-values. All tests were two-sided unless otherwise noted. Significance was deemed at the 5% significance level. All analyses were implemented in R (http://cran.r-project.org) and GraphPadρ version 4.
Results
GRK expression is frequently altered in Glioblastoma
To determine whether GRK expression is altered in glioblastoma, we queried gene expression data available through The Cancer Genome Atlas (http://tcga-data.nci.nih.gov/docs/publications/gbm_exp/). First, we examined the relationship between GRK expression and subtype-characteristic centroid profiles. Four subtypes of GBM can be distinguished by their pattern of gene expression: (i) Classical GBM exhibits mutation/amplification of epidermal growth factor receptor (EGFR) and frequent loss of CDKN2A, (ii) Mesenchymal GBM possesses mutations/deletions of NF1, PTEN and p53, (iii) Proneural GBM has frequent mutations of p53 and IDH1 as well as mutation/amplification of PDGFRα and (iv) Neural GBM exhibits mutations that overlap with the other groups, but is also characterized by increased expression of genes normally associated with neurons such as neurofilament (NEFL)(29, 30). Several relationships between GRK expression and molecular subtypes of GBM were revealed (Supplemental Figure 1). GRK2 and GRK5 expression were positively correlated (r=0.44 and 0.32, respectively), and GRK4 expression negatively correlated (r=−0.61) with Mesenchymal GBM. Levels of GRK3 were negatively correlated (r=−0.37) with the Classical subtype, and Proneural tumors exhibited increased GRK4 expression (r=0.6). GRK6 exhibited no subtype specific pattern of expression.
To assess the reliability of the correlations between GRK expression and GBM subtypes, we tested the significance of the GRK3-Classical and GRK4-Mesenchymal correlations with permutation tests. We generated random sets of genes from the TCGA database (minus the GRK genes) that were equal in size to the gene sets that defined each subtype (216 genes for Mesenchymal and 162 genes for Classical subtypes). This process was repeated 5000 times. The centroid profile of each random-drawn gene set was calculated by averaging across the 216 or 162 genes and was correlated with the untouched GRK4 or GRK3 gene expression profile. The significance of the correlation coefficient between GRK4 and the Mesenchymal centroid profile (which is −0.61) exceeded any of the correlation coefficients obtained with the random datasets (p=0). The correlation coefficient between GRK3 and the Classical centroid profile (which was −0.37) exceeded all but 183 of the 5000 returned correlations (p=0.037). Thus, like other GBM associated genes, GRK expression is altered in GBM, but may not alone uniquely distinguish between subtypes.
To directly address whether GRK expression might distinguish between GBM subtypes, we applied two-sample t-tests and examined whether the continuous gene expression of any GRK gene is differentially expressed between any two of the subtypes. The p-values after Bonferroni adjustment were reported to account for multiple testing (Supplemental Table 3) and Boxplots, where the black horizontal bar indicates the median expression level and the box represents the 25% to 75% quantile of the data, were generated to illustrate the difference in expression among the subtypes. With this analysis we found that greater GRK2 (Figure 1A) and GRK5 (Figure 1D) expression differentiates between Mesenchymal and each of the other three GBM subtypes (Mesenchymal compared to: Classical (GRK2 p=9.4e-05, GRK5 p=0.004), Neural (GRK2 p=0.0025, GRK5 p=2.3e-05), Proneural (GRK2 p=1.5e-05, GRK5 p=0.025). In similar fashion, lower GRK3 (Figure 1B) expression distinguishes Classical GBM from all other subtypes (Classical compared to: Mesenchymal p=0.00046, Neural p=0.00080, Proneural p=0.00011). No exclusive relationships between individual subtypes and GRK4 and GRK6 expression were detected.
Figure 1. Relationships between GRK expression and molecular subtypes of GBM.
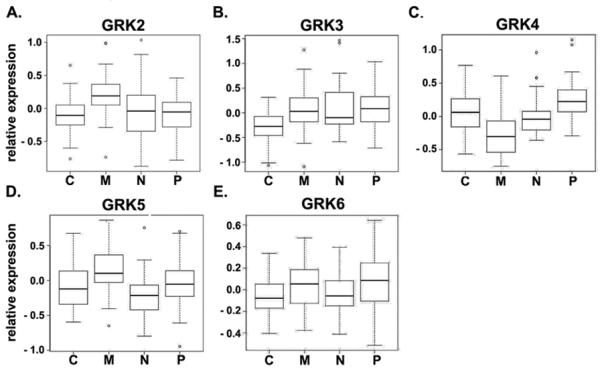
Relative expression of GRK2 (A), GRK3 (B), GRK4 (C), GRK5 (D), and GRK6 (E) in Classical (C), Mesenchymal (M), Neural (N) and Proneural (P) subtypes of GBM. Shown are box and whiskers plots of data accessed through the The Cancer Genome Atlas as described in the Materials and Methods.
Relationships between changes in GRK expression and GBM were further evaluated by quantitative PCR for GRK2-6 on mRNA isolated from 30 primary GBM and seven different normal human astrocyte specimens. GRK expression in each normal astrocyte and GBM specimen was first normalized to β-actin and then to the mean expression of the astrocyte samples. While GRK expression was variable among the GBM specimens, the majority of GBM cases exhibited altered GRK expression relative to human astrocytes (HAs, Figure 2A). GRK3 and 4 exhibited the greatest difference in mean expression between normal astrocytes and GBM. Expression of GRK4 was increased (p=0.06) and GRK3 decreased (p=0.03) compared to HAs. Thus, the most consistent change observed in these analyses of primary human specimens was decreased GRK3 expression.
Figure 2. GBM subtype specific expression of GRK3 mRNA.
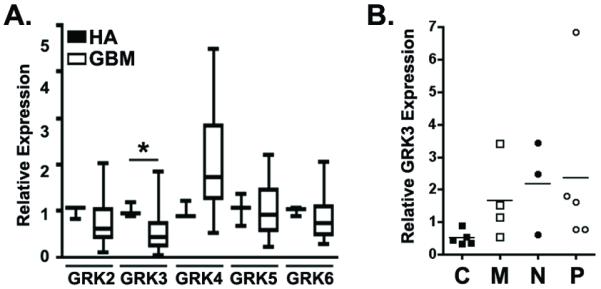
(A) Expression of GRKs in 30 primary GBM specimens relative to seven normal human astrocyte (HA) specimens was measured by quantitative PCR. For each GRK, expression in GBM was normalized to the mean astrocyte expression. Presented are the box and whiskers plots of these results. * = p<0.05 as determined by Wilcoxon rank sum test for comparisons between GRK expression in GBM and HA specimens. (B) Seventeen GBM specimens were subtyped based on quantitative PCR measures of 1) EGFR and CDKN2A (Classical, C), 2) PTEN and NF1 (Mesenchymal, M), 3) NEFL (Neural, N) and PDGFRα (Proneural, P). GRK3 expression was quantified and is plotted as a function of subtype.
To more closely examine the relationship between GRK3 expression and specific genetic changes in GBM, we performed quantitative PCR-based subtyping according to the following schema: 1) Classical GBM = increased EGF receptor and decreased CDKN2A expression, 2) Mesenchymal GBM = decreased PTEN and NF1 expression, 3) Neural GBM = increased neurofilament expression and, 4) Proneural GBM = increased PDGFRα expression. While each of these genetic changes can occur in any GBM subtype, they do so with distinctly different frequencies (30). mRNA for each of the above subtype markers was measured in 22 GBM specimens and normalized to the level of expression in human astrocytes. Subtype assignments were made blinded to GRK3 expression and based on the reported frequency that each change, e.g. increased EGFR expression, occurs in each GBM subtype. Seventeen of the 22 samples could be subtyped according to this schema but 5 specimens exhibited non-specific patterns of gene expression (Supplemental Table 4). While each subtype contained at least one specimen with low GRK3 expression, only in the Classical subtype did all specimens exhibit low levels of GRK3 (Figure 2B). Similar to the TCGA analysis, mean GRK3 expression was lowest in the Classical and highest in the Proneural subtype.
Prognostically significant GBM subtyping has also been based on the concept of primary and secondary disease. Primary GBM account for approximately 90% of all GBM cases (40) and most commonly occur with rapid onset of symptoms and amplification of EGFR (41). Secondary GBM are those tumors with a prior history of lower grade astrocytomas or more protracted clinical courses prior to diagnosis. They more often possess p53 mutation and recently, have also been shown to be distinguished from primary GBM by frequent mutation in isocitrate dehydrogenase (IDH1 R132H) (42-45). IDH1 mutation also most commonly occurs in Proneural GBM (30). Given the differences in GRK3 expression in Classical and Proneural tumors we wondered whether GRK3 expression would correlate at the protein level with EGFR amplification and IDH1 mutation. We obtained a GBM tissue microarray (TMA) with 35 GBM specimens. Fluorescence In Situ hybridization for EGFR amplification and immunohistochemical detection of IDH1 mutation was performed as described in the Materials and Methods. Five of the 35 GBM cases exhibited clear amplification of EGFR (Figure 3A and B) while four of the 35 cases exhibited IDH1 mutation (Figure 3C and D). None of the cases possessed both EGFR amplification and IDH1 mutation. A broad range of GRK3 expression was evident in the TMA. As illustrated in Figure 3E and F, and consistent with data presented above, cases with IDH1 mutation (secondary, Proneural GBM) exhibited greater GRK3 expression than those with EGFR amplification (primary, Classical GBM). In all, four of the five EGFR amplified cases demonstrated low levels of GRK3 expression while all of the cases with IDH1 mutation exhibited moderate to high levels of GRK3 expression. Together, the above data strongly suggest that GRK expression differs between molecular subtypes of GBM, and that GRK3 expression is decreased in tumors of the Classical subtype.
Figure 3. GBM subtype specific expression of GRK3 protein.

A GBM tissue microarray was evaluated for EGFR receptor amplification, IDH1 mutation and GRK3 expression. (A) An example of normal FISH analysis for EGFR. Red labels the EGFR gene and green labels chromosome 7 centromeric sequences (CEP7 probe). (B) An example of abnormal FISH for EGFR revealing EGFR amplification. (C) Positive staining for IDH1 mutation (IDH1 positive, brown). (D) Absence of IDH1 mutation. (E) GRK3 expression is diffusely expressed within an IDH1 positive tumor specimen (red). Nuclei are stained blue with DAPI. (F) Absence of GRK3 expression in a tumor specimen with EGFR amplification. Scale bars equal 50 μM (A-D) and 100 μM (E, F).
To assess whether GRK expression might also differ as a function of tumor grade, we performed immunohistochemical analyses of GRK expression in nineteen specimens representing all four grades of astrocytoma (46). The intensity of specific GRK isoenzyme expression appeared consistent across all tumor grades (I-IV, Table 1). Interestingly, GRK localization within tumor tissue was isoenzyme specific. While GRKs 2,4 and 5 exhibited diffuse expression throughout tumor tissue, GRK6 expression was confined to vascular structures (Supplemental Figure 2). In some high-grade cases, GRK3 expression was absent in tumor cells and limited to reactive astrocytes. These findings again suggest that reduced GRK3 expression may be functionally significant in a subset of GBM.
Table 1. GRK expression in astrocytoma.
| Tumor Type | n | GRK2 | Range | GRK3 | Range | GRK4 | Range | GRK5 | Range | GRK6* | Range |
|---|---|---|---|---|---|---|---|---|---|---|---|
| A-I | 6 | 1.5 | 0 to 3 | 1.5 | 0 to 3 | 2.7 | 1 to | 2.8 | 2 to 3 | 0.8 | 0 to 1 |
| A-II | 3 | 1.0 | 1 | 0.7 | 0 to 1 | 2.3 | 1 to 3 | 2.3 | 2 to 3 | 1.0 | 1 |
| A-III | 5 | 1.6 | 1 to 2 | 1.0 | 0 to 2 | 2.4 | 1 to 4 | 2.0 | 1 to 3 | 0.8 | 0 to 1 |
| A-IV | 5 | 2.0 | 1 to 3 | 0.8 | 0 to 1 | 3.4 | 3 to 4 | 2.4 | 2 to 3 | 1.0 | 1 |
Immunohistochemical (IHC) Scores indicate the percentage of tumor cells positive for each GRK: 1=0-25%, 2=26-50%, 3=51-75% and 4=76-100%.
GRK scores are for vascular structures.
GRK expression is regulated by growth factors
If reduced GRK3 expression has mechanistic significance in GBM, it is important to understand how its expression is reduced. The Classical subtype of GBM is characterized by the amplification of the EGF receptor without mutation of p53 or IDH1 and with evidence for increased contributions of GPCRs (29, 30, 47). Therefore, we hypothesized that the decreased expression of GRK3 in Classical GBM was a consequence of increased EGF receptor activation. In order to test this hypothesis, we first characterized four commonly used GBM cell lines with regard to their EGFR expression. We measured EGFR expression relative to normal human astrocytes in U87MG, LN308, LN428 and LN827 GBM cells. None of the cell lines exhibited significant alterations in EGFR levels compared to astrocytes (Figure 4A). We next performed western blot analyses for GRK expression and found that the cell lines were generally similar to the primary GBM specimens, exhibiting significantly reduced expression of GRK3 compared to HAs and frequent elevation of GRK4 (Figure 4B). The cell lines differed dramatically from the primary GBM specimens in the universal elevation of GRK6 expression. These findings suggested that while decreased GRK3 expression was common to both GBM tissue and established GBM cell lines, the mechanisms for regulating expression of GRK3 and other GRKs might differ in vivo and in vitro. Whereas a strong correlation exists for increased EGFR and decreased GRK3 in GBM tissue, reduced GRK3 expression might not require increased EGFR expression in vitro.
Figure 4. Growth factor regulation of GRK expression.

(A) EGFR expression was examined in HAs and GBM cell lines by quantitative PCR. (B) GRK expression in GBM cell lines U87, LN308, LN428, LN827 was measured by Western blot and normalized to GRK expression in normal human astrocytes (HAs). (C) GRK expression in U87 cells engineered to overexpress EGFR (U87-EGFR) or the constitutively active truncated form of EGFR (EGFRviii). Expression levels for GRK were normalized for each GRK to expression in U87 cells. (D) GRK2 and 3 expression in normal human astrocytes treated with growth factors as indicated. Expression for each GRK was normalized to GRK expression in astrocytes grown in serum free media (SF) alone. In each case, the means and sem of three independent experiments are presented. * = p<0.05 and ** = p<0.005 as determined by two-tailed t-test comparing expression for each specific GRK. Though not denoted by asterisks, GRK4 and GRK6 expression (panel B) in each of the GBM cell lines is significantly different from GRK4 and 6 expression in HAs.
To test the whether EGF pathway activation could regulate GRK expression in GBM cell lines we compared GRK expression in U87 MG cells engineered to overexpress EGFR or the constitutively active truncated form of EGFR, EGFRvIII. Increased EGFR pathway activation had significant effects on GRK expression. Notably, GRK2 levels were significantly reduced in cells with overexpression of either EGFR or EGFRvIII (Figure 4C). Expression of GRK3 was similarly reduced in U87-EGFRvIII, but not in U87-EGFR. Levels of GRK4-6 were not altered by changes in EGF receptor expression. These findings lend additional support to the hypothesis that the EGF pathway can regulate GRK expression, especially the closely related isoenzymes GRK2 and GRK3. Importantly, this subfamily of GRKs has previously been implicated in astrocytoma biology (22) and therefore, subsequent evaluations focused on GRK2 and GRK3 only.
These findings raised the possibility that low levels of GRK expression in U87 cells might reflect basal activation of the EGF receptor pathway. To address this possibility we treated U87, U87-EGFR and U87-EGFRviii cells with the potent EGFR inhibitor PD153035 or vehicle control (DMSO) in the presence and absence of EGF (Supplemental Figure 3). PD153035 eliminated phosphorylation of EGF receptor (data not shown) as well as baseline and EGF-stimulated phosphorylation of ERK and Akt. PD153035 treatment had no effect on GRK3 expression. Thus, in U87 cells, EGFR activation can regulate, but it is not required for regulation of GRK3 expression.
To further evaluate the regulation of GRK expression by pathways commonly activated in GBM, we treated normal human astrocytes with EGF, PDGF, TGF-β or CXCL12. Contrary to the effect of overexpression or mutational activation of the EGF receptor in U87 cells, treatment of astrocytes with EGF increased GRK2 expression to a small degree (Figure 4D). Astrocyte GRK3 expression however, was reduced by EGF treatment. Similar to EGF treatment, treatment with PDGF or TGF-β resulted in increased GRK2 but tended to reduce GRK3 expression (Figure 4D). The CXCR4 ligand, CXCL12, had no effect on GRK2 expression, but consistently suppressed GRK3 expression by a small amount.
Together the above data suggest that regulation of GRK expression differs between primary cells or tumor tissue and established GBM cell lines. These findings may also point to differences in GRK expression in transformed versus normal cells. While the regulation of some GRKs, such as 2 and 6 appeared to be context dependent, GRK3 expression was commonly decreased by gliomagenic pathways at the mRNA and protein levels, in GBM tissue, established GBM cell lines and normal human astrocytes.
The level of GRK3 expression regulates growth
Changes in GRK3 expression have the potential to alter signaling and function of GRK targets including GPCRs, receptor tyrosine kinases and multiple additional components of the GRK interactome (reviewed in (48)). As a consequence, changes in GRK expression might directly regulate astroglial growth. To determine whether reduced GRK3 expression was necessary for maximal GBM cell growth we compared the effect of increased GRK2 or GRK3 expression on cell growth in vitro. U87 and LN428 cells were engineered to overexpress GRK2 or GRK3 (Figure 5A). Overexpression of GRK3 significantly reduced growth of both U87 and LN428 cells (Figure 5B). Overexpression of GRK2 also reduced cell growth albeit not to the extent observed for GRK3. These data indicate that GRK2 and 3 can exert a cell autonomous effect on growth.
Figure 5. GRK2 and GRK3 are negative regulators of growth.

(A) U87 and LN428 cells stably expressing luciferase-eGFP and either GRK2 or GRK3 were established as described in Materials and Methods. GRK2 and GRK3 expression was confirmed by Western blot analysis. Actin serves as loading control. U87 and LN428 cells infected with lentivirus encoding luciferase-eGFP only serve as expression controls (con). (B) Baseline growth of control and GRK2 and GRK3 overexpressing cells was measured by bioluminescence 24 hours after plating. Both GRK2 and GRK3 overexpression inhibits growth in vitro. (C) Human brain microvascular endothelial cells (HBMEC) engineered to express mCherry fluorescent protein illustrate the capillary-like lattices formed when HBMECs are plated in Matrigel. (D) U87 cells localize to HBMECs. U87 cells are identified by their eGFP expression. Endothelial cells are identified by their expression of CXCL12 (red). (E) The trophic effect of HBMECs on U87 and LN428 cells is abrogated by GRK3, but not GRK2 expression. Growth of U87 and LN428 cells in monoculture and in co-culture with HBMECs was measured by bioluminescence. Presented are the percent changes in growth of co-cultures compared to monocultures. n = 3 for experiments in B and E. * indicates p<0.05 and ** indicates p<0.005 as determined by two-tailed t-tests.
To further evaluate the growth effects of GRK overexpression we used a co-culture model of the GBM perivascular niche (PVN). This model was designed to mimic the critical growth-promoting interactions that occur between GBM cells and microvascular endothelial cells (38, 39, 49). CXCL12 and its GPCR CXCR4 are implicated as mediators of the interaction between brain tumor cells and endothelial cells (50), and therefore, we hypothesized that changes in GRK expression would alter tumor cell behavior in this co-culture model of the PVN. Parental U87 or LN428 cells, or GRK2 and GRK3 overexpression variants of both cell lines, were grown in co-culture with human brain microvascular endothelial cells (HBMECs). HBMECs were first cultured in Matrigel resulting in the formation of capillary-like lattices (Figure 5C). Addition of U87 or 428 cells to these HBMEC networks resulted in the co-localization of the U87 or 428 cells with the endothelial cells (Figure 5D). In this configuration, HBMECs promoted increased U87 and LN428 growth compared to the growth of these cells when they were plated alone (Figure 5E). Overexpression of GRK2 had no significant effect on the HBMEC-stimulated growth of U87 or 428 cells. In contrast, GRK3 overexpression significantly reduced HBMEC-stimulated U87 and LN428 growth. Similar to what was seen in U87 monoculture, GRK3 overexpression resulted in an approximately 50% reduction in U87 cell number. Interestingly, the effect of GRK3 overexpression on LN428 growth was much greater in co-culture, where it completely abrogated the HBMEC effect on growth. Thus, in addition to cell autonomous effects on growth, GRK3 may also function in regulating growth responses to the tumor microenvironment. Together these data indicate that GRKs possess growth inhibitory properties and that maximal growth of GBM, especially of the Classical subtype, may require suppression of GRK3 expression.
Discussion
In the current study we found that altered expression of GRKs is a characteristic feature of GBM. Changes in GRK expression were apparent in the multi-dimensional genomic datasets available through the TCGA as well as in PCR validation and immunohistochemical analyses of primary GBM specimens. While several relationships between GRK expression and specific subtypes of GBM were suggested by the analysis, the most consistent association, evident in primary GBM tissue specimens, established GBM cell lines and normal human astrocytes, was between low levels of GRK3 and EGFR activation. Decreased GRK3 expression was functionally significant as low levels of expression were necessary for maximal growth of two different GBM cell lines assayed as monoculture as well as in a co-culture model of the perivascular space. Strikingly, while there were multiple circumstances in which GRK2, a closely related GRK family member exhibited similar activity to GRK3, GRK3 possessed greater potency in growth regulation.
Defining how decreased expression of GRK3 stimulates tumor growth has significance for cancer biology and experimental therapeutics. Decreased GRK3 expression could impact tumor growth through GPCR-dependent and/or GPCR-independent mechanisms. Pathological GPCR function in other diseases frequently involves alterations in receptor desensitization as a consequence of abnormal GRK expression or activity. Canonical homologous GPCR desensitization requires the phosphorylation of ligand-occupied receptor by GRKs and subsequent arrestin binding (13). This process functionally uncouples the receptor from the activation of heterotrimeric G proteins and shifts GPCR signaling towards arrestin-dependent pathways. Arrestins function as scaffolds for a variety of signaling molecules including: Raf, MEK, Erk, ASK1 as well as non-receptor tyrosine kinases (51). Thus, loss of desensitization results in both sustained heterotrimeric G protein signaling, and diminution of arrestin-mediated signals. The potential pathological consequences of failed desensitization are well illustrated in WHIM (Warts, Hypergammaglobulinemia, Infections, Myelokathexis) syndrome (52). Among the hallmark features of this disorder is abnormal chemotaxis of leukocytes resulting in retention in the bone marrow (Myelokathexis) and increased accumulation at sites of cutaneous papilloma virus infection (warts). Loss of CXCR4 desensitization has been identified as the molecular basis for WHIM syndrome in many cases, resulting from either truncation of C-terminal GRK phosphorylation sites on CXCR4 or loss of GRK3 activity (16, 53). In addition, GRK6 may also be required for normal CXCR4 desensitization in leukocytes (54). Similarly, altered GRK-mediated GPCR desensitization has been identified as pathogenic in several other diseases including: cardiac failure (reviewed in (55)), bipolar disease (56), and asthma (57). To date, no cancer promoting effect of GRK loss has been described, including in patients with WHIM syndrome.
In addition to shaping the intracellular signaling of classic 7-transmembrane domain GPCRs, GRKs, especially GRK2, have been shown to also regulate a large number of non-GPCR substrates. With regard to cancer biology, prominent among these targets are EGF and PDGF receptors, as well as Gαq, PI3 kinase, MEK, Akt, and GIT1 (reviewed in (48)). These kinase-dependent and -independent functions of GRK2 regulate cell motility, proliferation, differentiation and apoptosis. The direction of GRK effects on these substrates can be stimulatory or inhibitory. As examples, GRK2 recruitment to ligand-bound EGFR increases Erk 1/2 activation (58), while GRK2 mediated phosphorylation of PDGFR reduces tyrosine kinase activity (59). Particularly interesting with regard to the growth effects observed in this study is the role that GRK2 plays in the G2/M cell cycle checkpoint. GRK2 is normally phosphorylated by CDK2 during G2 and degraded (60). Abrogation of GRK2 phosphorylation results in its stabilization and cell cycle delay. Thus, the effects of altered GRK2 and by homology, GRK3, on GBM and astrocyte cell growth might be related to known GRK2 effects on G2/M progression.
Among the important findings in the current study is that common genetic alterations in GBM result in altered GRK expression. In primary GBM specimens, GRK mRNA and protein abundance was altered compared to normal human astrocytes. These findings are consistent with known regulation of GRK expression at the mRNA and protein levels. Importantly, pathways frequently altered in cancer such as the RAS-MAPK pathway (61, 62), the PI3 kinase/Akt pathway, and MDM2-mediated ubiquitination (63) are known to regulate GRK transcription and protein stability. Moreover, protein kinases such as PKC, PKA, Erk and Src have all been shown to regulate GRK2 activity (48). The close homology between GRK2 and GRK3, including at consensus phosphorylation sites, suggests that these kinases might similarly regulate GRK3 activity. Thus, primary oncogenic events resulting in autocrine, paracrine or mutational activation of growth factor receptor pathways alters GRK expression and function, impacting on growth.
Understanding how altered GRK activity affects GBM growth has the potential for an enormous impact on cancer care. In cases of increased GRK activity, kinase inhibitors (64) as well as decoy binding partners (i.e., βARKct (65)) could be applied. In cases of decreased GRK activity, phosphatase inhibitors, to promote retained GPCR phosphorylation would be appropriate trial therapeutics. If altered GRK activity affects GBM growth secondary to dysregulated GPCR signaling, then therapeutic options to address this aspect of GBM biology could also include specific GPCR antagonists.
Supplementary Material
Acknowledgements
The authors would like to thank Dr. Daniel Fisher, Nicole Warrington and Jayne Marassa for expert technical assistance in the performance of these studies.
Grant Support
This work was supported by National Institutes of Health grants RO1CA118389 (JBR) and R01GM44944 (JLB) and the Pediatric Brain Tumor Foundation (JBR). Bioluminescence imaging studies were supported by The Molecular Imaging Center at Washington University School of Medicine and NIH P50 CA94056 (DP-W). Viral vector production was supported by Neuroscience Blueprint Core Grant P30 NS057105 to Washington University.
Footnotes
The authors have no conflicts of interest to report.
References
- 1.Lagerstrom MC, Schioth HB. Structural diversity of G protein-coupled receptors and significance for drug discovery. Nat Rev Drug Discov. 2008;7(4):339–57. doi: 10.1038/nrd2518. [DOI] [PubMed] [Google Scholar]
- 2.Dorsam RT, Gutkind JS. G-protein-coupled receptors and cancer. Nat Rev Cancer. 2007;7(2):79–94. doi: 10.1038/nrc2069. [DOI] [PubMed] [Google Scholar]
- 3.Lappano R, Maggiolini M. G protein-coupled receptors: novel targets for drug discovery in cancer. Nat Rev Drug Discov. 2011;10(1):47–60. doi: 10.1038/nrd3320. [DOI] [PubMed] [Google Scholar]
- 4.Allen LF, Lefkowitz RJ, Caron MG, Cotecchia S. G-protein-coupled receptor genes as protooncogenes: constitutively activating mutation of the alpha 1B-adrenergic receptor enhances mitogenesis and tumorigenicity. Proc Natl Acad Sci U S A. 1991;88(24):11354–8. doi: 10.1073/pnas.88.24.11354. [DOI] [PMC free article] [PubMed] [Google Scholar]
- 5.Corvilain B, Van Sande J, Dumont JE, Vassart G. Somatic and germline mutations of the TSH receptor and thyroid diseases. Clin Endocrinol (Oxf) 2001;55(2):143–58. [PubMed] [Google Scholar]
- 6.Young D, Waitches G, Birchmeier C, Fasano O, Wigler M. Isolation and characterization of a new cellular oncogene encoding a protein with multiple potential transmembrane domains. Cell. 1986;45(5):711–9. doi: 10.1016/0092-8674(86)90785-3. [DOI] [PubMed] [Google Scholar]
- 7.Julius D, Livelli TJ, Jessell TM, Axel R. Ectopic expression of the serotonin 1c receptor and the triggering of malignant transformation. Science. 1989;244(4908):1057–62. doi: 10.1126/science.2727693. [DOI] [PubMed] [Google Scholar]
- 8.Gutkind JS, Novotny EA, Brann MR, Robbins KC. Muscarinic acetylcholine receptor subtypes as agonist-dependent oncogenes. Proc Natl Acad Sci U S A. 1991;88(11):4703–7. doi: 10.1073/pnas.88.11.4703. [DOI] [PMC free article] [PubMed] [Google Scholar]
- 9.Rubin JB, Kung AL, Klein RS, et al. A small-molecule antagonist of CXCR4 inhibits intracranial growth of primary brain tumors. Proc Natl Acad Sci U S A. 2003;100(23):13513–8. doi: 10.1073/pnas.2235846100. [DOI] [PMC free article] [PubMed] [Google Scholar]
- 10.Yang L, Jackson E, Woerner BM, Perry A, Piwnica-Worms D, Rubin JB. Blocking CXCR4-Mediated Cyclic AMP Suppression Inhibits Brain Tumor Growth In vivo. Cancer Res. 2007;67(2):651–8. doi: 10.1158/0008-5472.CAN-06-2762. [DOI] [PubMed] [Google Scholar]
- 11.Kioi M, Vogel H, Schultz G, Hoffman RM, Harsh GR, Brown JM. Inhibition of vasculogenesis, but not angiogenesis, prevents the recurrence of glioblastoma after irradiation in mice. J Clin Invest. 2010;120(3):694–705. doi: 10.1172/JCI40283. [DOI] [PMC free article] [PubMed] [Google Scholar]
- 12.Rubin JB. Chemokine signaling in cancer: one hump or two? Semin Cancer Biol. 2009;19(2):116–22. doi: 10.1016/j.semcancer.2008.10.001. [DOI] [PMC free article] [PubMed] [Google Scholar]
- 13.Gainetdinov RR, Premont RT, Bohn LM, Lefkowitz RJ, Caron MG. Desensitization of G protein-coupled receptors and neuronal functions. Annu Rev Neurosci. 2004;27:107–44. doi: 10.1146/annurev.neuro.27.070203.144206. [DOI] [PubMed] [Google Scholar]
- 14.Penn RB, Pronin AN, Benovic JL. Regulation of G protein-coupled receptor kinases. Trends Cardiovasc Med. 2000;10(2):81–9. doi: 10.1016/s1050-1738(00)00053-0. [DOI] [PubMed] [Google Scholar]
- 15.Pitcher JA, Freedman NJ, Lefkowitz RJ. G protein-coupled receptor kinases. Annu Rev Biochem. 1998;67:653–92. doi: 10.1146/annurev.biochem.67.1.653. [DOI] [PubMed] [Google Scholar]
- 16.Balabanian K, Levoye A, Klemm L, et al. Leukocyte analysis from WHIM syndrome patients reveals a pivotal role for GRK3 in CXCR4 signaling. J Clin Invest. 2008;118(3):1074–84. doi: 10.1172/JCI33187. [DOI] [PMC free article] [PubMed] [Google Scholar]
- 17.Cheng ZJ, Zhao J, Sun Y, et al. beta-arrestin differentially regulates the chemokine receptor CXCR4-mediated signaling and receptor internalization, and this implicates multiple interaction sites between beta-arrestin and CXCR4. J Biol Chem. 2000;275(4):2479–85. doi: 10.1074/jbc.275.4.2479. [DOI] [PubMed] [Google Scholar]
- 18.Marchese A, Benovic JL. Agonist-promoted ubiquitination of the G protein-coupled receptor CXCR4 mediates lysosomal sorting. J Biol Chem. 2001;276(49):45509–12. doi: 10.1074/jbc.C100527200. [DOI] [PubMed] [Google Scholar]
- 19.Orsini MJ, Parent JL, Mundell SJ, Marchese A, Benovic JL. Trafficking of the HIV coreceptor CXCR4: role of arrestins and identification of residues in the C-terminal tail that mediate receptor internalization. J Biol Chem. 2000;275(33):25876. doi: 10.1074/jbc.274.43.31076. [DOI] [PubMed] [Google Scholar]
- 20.Signoret N, Oldridge J, Pelchen-Matthews A, et al. Phorbol esters and SDF-1 induce rapid endocytosis and down modulation of the chemokine receptor CXCR4. J Cell Biol. 1997;139(3):651–64. doi: 10.1083/jcb.139.3.651. [DOI] [PMC free article] [PubMed] [Google Scholar]
- 21.Vroon A, Heijnen CJ, Raatgever R, et al. GRK6 deficiency is associated with enhanced CXCR4-mediated neutrophil chemotaxis in vitro and impaired responsiveness to G-CSF in vivo. J Leukoc Biol. 2004;75(4):698–704. doi: 10.1189/jlb.0703320. [DOI] [PubMed] [Google Scholar]
- 22.Warrington NM, Woerner BM, Daginakatte GC, et al. Spatiotemporal differences in CXCL12 expression and cyclic AMP underlie the unique pattern of optic glioma growth in neurofibromatosis type 1. Cancer Res. 2007;67(18):8588–95. doi: 10.1158/0008-5472.CAN-06-2220. [DOI] [PubMed] [Google Scholar]
- 23.Busillo JM, Armando S, Sengupta R, Meucci O, Bouvier M, Benovic JL. Site-specific phosphorylation of CXCR4 is dynamically regulated by multiple kinases and results in differential modulation of CXCR4 signaling. J Biol Chem. 2010;285(10):7805–17. doi: 10.1074/jbc.M109.091173. [DOI] [PMC free article] [PubMed] [Google Scholar]
- 24.Metaye T, Gibelin H, Perdrisot R, Kraimps JL. Pathophysiological roles of G-protein-coupled receptor kinases. Cell Signal. 2005;17(8):917–28. doi: 10.1016/j.cellsig.2005.01.002. [DOI] [PubMed] [Google Scholar]
- 25.Balkwill F. The significance of cancer cell expression of the chemokine receptor CXCR4. Semin Cancer Biol. 2004;14(3):171–9. doi: 10.1016/j.semcancer.2003.10.003. [DOI] [PubMed] [Google Scholar]
- 26.Bian XW, Yang SX, Chen JH, et al. Preferential expression of chemokine receptor CXCR4 by highly malignant human gliomas and its association with poor patient survival. Neurosurgery. 2007;61(3):570–8. doi: 10.1227/01.NEU.0000290905.53685.A2. discussion 8-9. [DOI] [PubMed] [Google Scholar]
- 27.Calatozzolo C, Maderna E, Pollo B, et al. Prognostic value of CXCL12 expression in 40 low-grade oligodendrogliomas and oligoastrocytomas. Cancer Biol Ther. 2006;5(7):827–32. doi: 10.4161/cbt.5.7.2838. [DOI] [PubMed] [Google Scholar]
- 28.Salmaggi A, Gelati M, Pollo B, et al. CXCL12 expression is predictive of a shorter time to tumor progression in low-grade glioma: a single-institution study in 50 patients. J Neurooncol. 2005;74(3):287–93. doi: 10.1007/s11060-004-7327-y. [DOI] [PubMed] [Google Scholar]
- 29.Gravendeel LA, Kouwenhoven MC, Gevaert O, et al. Intrinsic gene expression profiles of gliomas are a better predictor of survival than histology. Cancer Res. 2009;69(23):9065–72. doi: 10.1158/0008-5472.CAN-09-2307. [DOI] [PubMed] [Google Scholar]
- 30.Verhaak RG, Hoadley KA, Purdom E, et al. Integrated genomic analysis identifies clinically relevant subtypes of glioblastoma characterized by abnormalities in PDGFRA, IDH1, EGFR, and NF1. Cancer Cell. 2010;17(1):98–110. doi: 10.1016/j.ccr.2009.12.020. [DOI] [PMC free article] [PubMed] [Google Scholar]
- 31.Woerner BM, Warrington NM, Kung AL, Perry A, Rubin JB. Widespread CXCR4 activation in astrocytomas revealed by phospho-CXCR4-specific antibodies. Cancer Res. 2005;65(24):11392–9. doi: 10.1158/0008-5472.CAN-05-0847. [DOI] [PubMed] [Google Scholar]
- 32.Brat DJ, Shehata BM, Castellano-Sanchez AA, et al. Congenital glioblastoma: a clinicopathologic and genetic analysis. Brain Pathol. 2007;17(3):276–81. doi: 10.1111/j.1750-3639.2007.00071.x. [DOI] [PMC free article] [PubMed] [Google Scholar]
- 33.Ishii N, Maier D, Merlo A, et al. Frequent co-alterations of TP53, p16/CDKN2A, p14ARF, PTEN tumor suppressor genes in human glioma cell lines. Brain Pathol. 1999;9(3):469–79. doi: 10.1111/j.1750-3639.1999.tb00536.x. [DOI] [PMC free article] [PubMed] [Google Scholar]
- 34.Wang MY, Lu KV, Zhu S, et al. Mammalian target of rapamycin inhibition promotes response to epidermal growth factor receptor kinase inhibitors in PTEN-deficient and PTEN-intact glioblastoma cells. Cancer Res. 2006;66(16):7864–9. doi: 10.1158/0008-5472.CAN-04-4392. [DOI] [PubMed] [Google Scholar]
- 35.Li B, Chang CM, Yuan M, McKenna WG, Shu HK. Resistance to small molecule inhibitors of epidermal growth factor receptor in malignant gliomas. Cancer Res. 2003;63(21):7443–50. [PubMed] [Google Scholar]
- 36.Warrington NM, Gianino SM, Jackson E, et al. Cyclic AMP supppression is sufficient to induce gliomagenesis in a mouse model of Neurofibromatosis-1. Cancer Research. 2010;70(14):5717–27. doi: 10.1158/0008-5472.CAN-09-3769. [DOI] [PMC free article] [PubMed] [Google Scholar]
- 37.Goldhoff P, Warrington NM, Limbrick DD, Jr., et al. Targeted inhibition of cyclic AMP phosphodiesterase-4 promotes brain tumor regression. Clin Cancer Res. 2008;14(23):7717–25. doi: 10.1158/1078-0432.CCR-08-0827. [DOI] [PMC free article] [PubMed] [Google Scholar]
- 38.Borovski T, Verhoeff JJ, ten Cate R, et al. Tumor microvasculature supports proliferation and expansion of glioma-propagating cells. Int J Cancer. 2009;125(5):1222–30. doi: 10.1002/ijc.24408. [DOI] [PubMed] [Google Scholar]
- 39.Kenig S, Alonso MB, Mueller MM, Lah TT. Glioblastoma and endothelial cells cross-talk, mediated by SDF-1, enhances tumour invasion and endothelial proliferation by increasing expression of cathepsins B, S, and MMP-9. Cancer Lett. 2010;289(1):53–61. doi: 10.1016/j.canlet.2009.07.014. [DOI] [PubMed] [Google Scholar]
- 40.Ohgaki H, Dessen P, Jourde B, et al. Genetic pathways to glioblastoma: a population-based study. Cancer Res. 2004;64(19):6892–9. doi: 10.1158/0008-5472.CAN-04-1337. [DOI] [PubMed] [Google Scholar]
- 41.Louis DN. Molecular pathology of malignant gliomas. Annu Rev Pathol. 2006;1:97–117. doi: 10.1146/annurev.pathol.1.110304.100043. [DOI] [PubMed] [Google Scholar]
- 42.Balss J, Meyer J, Mueller W, Korshunov A, Hartmann C, von Deimling A. Analysis of the IDH1 codon 132 mutation in brain tumors. Acta Neuropathol. 2008;116(6):597–602. doi: 10.1007/s00401-008-0455-2. [DOI] [PubMed] [Google Scholar]
- 43.Gupta R, Webb-Myers R, Flanagan S, Buckland ME. Isocitrate dehydrogenase mutations in diffuse gliomas: clinical and aetiological implications. J Clin Pathol. 2011;64(10):835–44. doi: 10.1136/jclinpath-2011-200227. [DOI] [PubMed] [Google Scholar]
- 44.Hartmann C, Meyer J, Balss J, et al. Type and frequency of IDH1 and IDH2 mutations are related to astrocytic and oligodendroglial differentiation and age: a study of 1,010 diffuse gliomas. Acta Neuropathol. 2009;118(4):469–74. doi: 10.1007/s00401-009-0561-9. [DOI] [PubMed] [Google Scholar]
- 45.Ichimura K, Pearson DM, Kocialkowski S, et al. IDH1 mutations are present in the majority of common adult gliomas but rare in primary glioblastomas. Neuro Oncol. 2009;11(4):341–7. doi: 10.1215/15228517-2009-025. [DOI] [PMC free article] [PubMed] [Google Scholar]
- 46.Cavenee WK, Furnari FB, Nagane M, Huang H-JS, Newcomb EW, Bigner DD, Weller M, Berens ME, Plate KH, Israel MA, Noble MD, Kleihues P. Astrocytic Tumours. In: Cavevee PKWK, editor. World Health Organization Classification of Tumours: Tumours of the Central Nervous System. IARC Press; Lyon: 2000. pp. 9–54. [Google Scholar]
- 47.Li A, Walling J, Kotliarov Y, et al. Genomic changes and gene expression profiles reveal that established glioma cell lines are poorly representative of primary human gliomas. Mol Cancer Res. 2008;6(1):21–30. doi: 10.1158/1541-7786.MCR-07-0280. [DOI] [PubMed] [Google Scholar]
- 48.Penela P, Murga C, Ribas C, Lafarga V, Mayor F., Jr. The complex G protein-coupled receptor kinase 2 (GRK2) interactome unveils new physiopathological targets. Br J Pharmacol. 2010;160(4):821–32. doi: 10.1111/j.1476-5381.2010.00727.x. [DOI] [PMC free article] [PubMed] [Google Scholar]
- 49.Calabrese C, Poppleton H, Kocak M, et al. A perivascular niche for brain tumor stem cells. Cancer Cell. 2007;11(1):69–82. doi: 10.1016/j.ccr.2006.11.020. [DOI] [PubMed] [Google Scholar]
- 50.Zagzag D, Esencay M, Mendez O, et al. Hypoxia- and vascular endothelial growth factor-induced stromal cell-derived factor-1alpha/CXCR4 expression in glioblastomas: one plausible explanation of Scherer’s structures. Am J Pathol. 2008;173(2):545–60. doi: 10.2353/ajpath.2008.071197. [DOI] [PMC free article] [PubMed] [Google Scholar]
- 51.Shenoy SK, Lefkowitz RJ. beta-arrestin-mediated receptor trafficking and signal transduction. Trends Pharmacol Sci. doi: 10.1016/j.tips.2011.05.002. [DOI] [PMC free article] [PubMed] [Google Scholar]
- 52.Diaz GA, Gulino AV. WHIM syndrome: a defect in CXCR4 signaling. Curr Allergy Asthma Rep. 2005;5(5):350–5. doi: 10.1007/s11882-005-0005-0. [DOI] [PubMed] [Google Scholar]
- 53.Balabanian K, Lagane B, Pablos JL, et al. WHIM syndromes with different genetic anomalies are accounted for by impaired CXCR4 desensitization to CXCL12. Blood. 2005;105(6):2449–57. doi: 10.1182/blood-2004-06-2289. [DOI] [PubMed] [Google Scholar]
- 54.McCormick PJ, Segarra M, Gasperini P, Gulino AV, Tosato G. Impaired recruitment of Grk6 and beta-Arrestin 2 causes delayed internalization and desensitization of a WHIM syndrome-associated CXCR4 mutant receptor. PLoS One. 2009;4(12):e8102. doi: 10.1371/journal.pone.0008102. [DOI] [PMC free article] [PubMed] [Google Scholar]
- 55.Dorn GW., 2nd GRK mythology: G-protein receptor kinases in cardiovascular disease. J Mol Med. 2009;87(5):455–63. doi: 10.1007/s00109-009-0450-7. [DOI] [PubMed] [Google Scholar]
- 56.Rao JS, Rapoport SI, Kim HW. Decreased GRK3 but not GRK2 expression in frontal cortex from bipolar disorder patients. Int J Neuropsychopharmacol. 2009;12(6):851–60. doi: 10.1017/S146114570900025X. [DOI] [PMC free article] [PubMed] [Google Scholar] [Retracted]
- 57.Wang WC, Mihlbachler KA, Bleecker ER, Weiss ST, Liggett SB. A polymorphism of G-protein coupled receptor kinase5 alters agonist-promoted desensitization of beta2-adrenergic receptors. Pharmacogenet Genomics. 2008;18(8):729–32. doi: 10.1097/FPC.0b013e32830967e9. [DOI] [PMC free article] [PubMed] [Google Scholar]
- 58.Gao J, Li J, Ma L. Regulation of EGF-induced ERK/MAPK activation and EGFR internalization by G protein-coupled receptor kinase 2. Acta Biochim Biophys Sin (Shanghai) 2005;37(8):525–31. doi: 10.1111/j.1745-7270.2005.00076.x. [DOI] [PubMed] [Google Scholar]
- 59.Freedman NJ, Kim LK, Murray JP, et al. Phosphorylation of the platelet-derived growth factor receptor-beta and epidermal growth factor receptor by G protein-coupled receptor kinase-2. Mechanisms for selectivity of desensitization. J Biol Chem. 2002;277(50):48261–9. doi: 10.1074/jbc.M204431200. [DOI] [PubMed] [Google Scholar]
- 60.Penela P, Rivas V, Salcedo A, Mayor F., Jr. G protein-coupled receptor kinase 2 (GRK2) modulation and cell cycle progression. Proc Natl Acad Sci U S A. 107(3):1118–23. doi: 10.1073/pnas.0905778107. [DOI] [PMC free article] [PubMed] [Google Scholar]
- 61.Salim S, Standifer KM, Eikenburg DC. Extracellular signal-regulated kinase 1/2-mediated transcriptional regulation of G-protein-coupled receptor kinase 3 expression in neuronal cells. J Pharmacol Exp Ther. 2007;321(1):51–9. doi: 10.1124/jpet.106.116921. [DOI] [PubMed] [Google Scholar]
- 62.Rubino T, Vigano D, Premoli F, et al. Changes in the expression of G protein-coupled receptor kinases and beta-arrestins in mouse brain during cannabinoid tolerance: a role for RAS-ERK cascade. Mol Neurobiol. 2006;33(3):199–213. doi: 10.1385/MN:33:3:199. [DOI] [PubMed] [Google Scholar]
- 63.Salcedo A, Mayor F, Jr., Penela P. Mdm2 is involved in the ubiquitination and degradation of G-protein-coupled receptor kinase 2. Embo J. 2006;25(20):4752–62. doi: 10.1038/sj.emboj.7601351. [DOI] [PMC free article] [PubMed] [Google Scholar]
- 64.Thal DM, Yeow RY, Schoenau C, Huber J, Tesmer JJ. Molecular Mechanism of Selectivity Among G Protein-Coupled Receptor Kinase 2 Inhibitors. Mol Pharmacol. 2011;80(2):294–303. doi: 10.1124/mol.111.071522. [DOI] [PMC free article] [PubMed] [Google Scholar]
- 65.Volkers M, Weidenhammer C, Herzog N, et al. The inotropic peptide betaARKct improves betaAR responsiveness in normal and failing cardiomyocytes through G(betagamma)-mediated L-type calcium current disinhibition. Circ Res. 2011;108(1):27–39. doi: 10.1161/CIRCRESAHA.110.225201. [DOI] [PMC free article] [PubMed] [Google Scholar]
Associated Data
This section collects any data citations, data availability statements, or supplementary materials included in this article.