Abstract
Electron crystallography plays a key role in the structural biology of integral membrane proteins (IMPs) by offering one of the most direct means of providing insight into the functional state of these molecular machines in their lipid-associated forms, and also has the potential to facilitate examination of physiologically relevant transitional states and complexes. Helical or tubular crystals, which are the natural product of proteins crystallizing on the surface of a cylindrical vesicle, offer some unique advantages, such as three-dimensional (3D) information from a single view, compared to other crystalline forms. While a number of software packages are available for processing images of helical crystals to produce 3D electron density maps, widespread exploitation of helical image reconstruction is limited by a lack of standardized approaches and the initial effort and specialized expertise required. Our goal is to develop an integrated pipeline to enable structure determination by transmission electron microscopy (TEM) of IMPs in the form of tubular crystals. We describe here the integration of standard Fourier-Bessel helical analysis techniques into Appion, an integrated, database-driven pipeline.
Keywords: Helical Processing, Electron Microscopy, Membrane Protein, Appion, Phoelix
1. Introduction
Electron crystallography plays a key role in the structural biology of integral membrane proteins (IMPs) by offering one of the most direct means of providing insight into the functional state of these molecular machines in their lipid-associated forms, and also has the potential to facilitate examination of physiologically relevant transitional states and complexes [1, 2]. Despite some impressive achievements in the production and analysis of both 2D [3-8] and helical [9-12] membrane crystals, progress in this area has been slow. In contrast, the progress in single particle (SP) 3D reconstruction (primarily of soluble proteins) using TEM has made considerable strides in the last decade (for reviews see [13, 14]). Single particle EM (SPEM) now allows for the interpretation of macromolecular machines at near atomic resolution [15-21] for suitably well ordered structures and interpretation of transient states and conformational variations at lower resolutions [22-25].
The difference in progress between electron crystallography vs. SPEM is largely due to the fact that the primary focus of electron crystallography has been on IMPs, which present challenges for EM just as they do for X-ray crystallography. This is evident from the relatively small number of depositions of membrane proteins compared to soluble proteins in the PDB. In contrast, the rapid progress in SP structural analysis is a reflection of the correspondingly large effort that has gone into solving technical problems in this area. For the last decade, the focus of many EM structural biologists has been on developing methods and solving structures using SPEM and only a limited number of laboratories have worked towards advancing the technology for electron crystallography, for either 2D or helical structures. As a result, SPEM has rapidly progressed from an esoteric method practiced in a few specialized labs to a more generalized method readily accessible to the wider scientific community, while electron crystallography, in spite of a few spectacular successes (for review see [1, 26]), has not migrated to the mainstream or seen widespread application.
While SPEM can be applied to isolated IMPs [27, 28] this approach is restricted to structures that are large enough (>250kD) and that are usually solubilized in detergent. The major advantage of electron crystallography is that it provides the capability for understanding protein structures in their functional lipid-associated forms. Helical or tubular crystals, which often occur upon high-density reconstitution of membrane proteins into lipid membranes, offer some unique advantages over 2D crystals. A single image of a helical tube provides all of the information required for calculating a 3D map, and the inclusion of many tubes can be combined to improve the resolution without the need to tilt the sample in the microscope. The necessity of acquiring tilted images for 2D crystals has been a major bottleneck because problems like beam induced specimen movement [29] are exacerbated at high tilts. In addition, the specimen and the substrate on which it is supported need to be exceptionally flat, which has been very difficult to achieve in practice. Furthermore, since it is not possible to tilt the specimen past about 70° in the TEM, the resolution perpendicular to the plane is lower and the 3D map is anisotropic. Reconstructions from helical specimens do not suffer from this limitation because a single view of a helical array contains a complete range of equally spaced molecular views of the protein molecule. Helical tubes have the further advantage that they can be imaged in solution suspended over holes in the supporting substrate, thus avoiding interactions between the protein and the substrate that may alter the conformation of the protein.
Despite the advantages offered by helical crystals, only a few labs have pursued these methods for IMP structure determination. While specimen preparation is undoubtedly the most challenging step and the principal bottleneck, any potential progress in this area has been further stymied by difficulties at subsequent steps. Once helical tubes are formed there are several technical challenges involved in the analysis of the structure that currently limit their utility and/or restrict the analysis to a very limited group of practitioners who have become experts in the use of the programs currently available for helical reconstruction. Our goal is to provide a streamlined helical pipeline that is accessible, transparent, and provides a number of options for helical processing. We describe here our initial efforts in this project: the incorporation of Fourier-Bessel reconstruction procedures, based on the original Phoelix [30, 31] image processing package, into an integrated web-based processing pipeline, called Appion [32-35]. Integration of multiple helical packages into the Appion pipeline permits users access to complex processing methods. Users can experiment with a range of parameters for each method and the associated inputs, outputs, and metadata are stored to the Appion MySQL database. Output data files and parameters are automatically uploaded to the Appion webpage and displayed using standardized report pages. This eliminates the need to manually track all processing and makes data analysis more convenient. Most importantly, it provides a straightforward and accessible means to inspect, analyze and compare the results of a variety of processing methods.
2. Overview of the Appion Pipeline
Appion [32-35] is a modular and transparent pipeline that makes use of existing software applications and procedures. The user manages and controls the software modules via web-based forms. All results are similarly available using web-based viewers directly linked to the underlying database, enabling even novice users to quickly deduce the quality of their results. The starting point of the Appion pipeline is usually a set of micrographs, which can either be uploaded from digital images or made available by linking the Appion database to the database associated with the automated Leginon data acquisition system [36-39].
The principal focus of Appion development was initially on single particle analysis. The sidebar menu (Figure 1A) provides a variety of tools that are organized to conform to a typical single particle workflow, which guides the user through the various required steps from raw images to a final 3D reconstructed map. The general protocol used is as follows, (i) particle selection, (ii) CTF estimation, (iii) stack creation, (iv) particle alignment and classification, (v) initial model generation, and (vi) 3D reconstruction and refinement. At each step the user has multiple procedures from multiple software packages to choose from. As users gain experience they usually develop a refined protocol that works optimally for their data. All data input and output is presented in standardized web forms and report pages making image processing and analysis a more intuitive process. More information on Appion and a step-by-step guide to a single particle reconstruction can be found at http://www.appion.org.
Figure 1. Appion web interface for Manual Particle Picker.
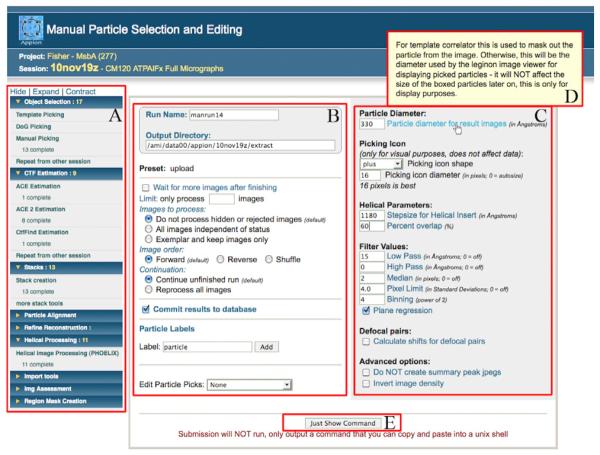
Appion web pages are standardized so that the expandable sidebar menu containing all available packages in each processing step is always located on the far left (A). Within each job submission page Appion loop parameters are positioned on the left (B) and the package-specific parameters are in the table to the right (C). A helical function has been added to Appion’s Manual Picker, which calls for two additional input parameters, Helical Stepsize and Percent Overlap. Pop-up help information is accessible by scrolling the cursor over the blue parameter labels (D). Manual picker is an interactive program that has to be executed outside of the Appion web interface. This submission page will generate the python command that can then be manually submitted (E), other pages include an additional button that will submit jobs to a cluster from the webpage (refer to Figure 5.3).
3. Overview of the Phoelix Helical Processing Package
Phoelix [30, 31] is a series of UNIX shell scripts that control programs from the MRC [40-42] and SUPRIM [43] processing packages. Fourier-Bessel processing starts by extracting a helical filament from a micrograph. In Phoelix, this is done by selecting a few points along the helical axis, fitting a spline, straightening the tube, and boxing it out. A Fourier transform is then calculated and amplitude and phase information is extracted along each layer line. The layer lines are used to correct distortions such as out-of-plane tilt and shift. Layer lines are brought to a common phase origin are then combined to form an average from which a density map is calculated by Fourier-Bessel inversion and summation. These steps have been previously described [30, 44-46] and only deviations from or additions to the prior protocol will be discussed in detail here.
The MRC helical processing package has been used for many years to obtain moderate to high-resolution helical reconstructions (for examples see [45-47]) and is the gold standard for helical processing using Fourier-Bessel analysis. However, the use of this package requires a substantial amount of specialized knowledge, manual operation, and user intervention. The goal in developing the Phoelix package, originally released in 1995, was to provide some level of automation and streamlining of the MRC helical analysis package. While Phoelix dramatically improved the efficiency and resolution of helical reconstructions for actomyosin and microtubules, it was not optimized for diverse helical specimens and still required a considerable level of user supervision and comprehension. Thus the initial barrier to entry remained high unless users had access to an expert in a lab with experience using the package.
In order to use Phoelix, the operator is first required to review and edit two large parameter files. Then a global script, which must be monitored in order to make several decisions at various stopping points along the way, can be launched. A variety of global controlling scripts were developed for different helical specimens, but with limited focus on following standardized procedures, the burden was placed on the user to learn command sequences, required file inputs, and proper file formats. Log files were automatically generated for some Phoelix procedures, but overall record keeping was left up to the user. In practice, most users experiment with a variety of combinations of parameters and scripts in multiple directories, and it rapidly becomes burdensome to keep track of the history, sort through output files, and analyze the results for each experimental processing session. As a result, using Phoelix can be a daunting and error prone task for a novice user.
Phoelix can be operated in semi-automated mode so that only a limited number of steps require input or approval from the user. For example, fitting a cubic spline curve to the helical axis can be performed automatically, but can include a pause to obtain approval from the operator before proceeding to the next step. This makes the operator’s job easier, but still requires a substantial time commitment as the interactive steps occur intermittently throughout the routines and therefore necessitates that the operator be present from start to finish in order to keep things moving forward. The operator can also choose to run the protocol in batch mode, which bypasses all user interaction and simply displays the output files as they are generated. The user can review the data all at one time and then relaunch the procedure from any of the steps that required modification. This option may reduce overall user interaction time, but requires that the operator pay close attention to the various files that are displayed, makes it difficult to manage multiple jobs running simultaneously, and results in redundancy at any steps that need to be relaunched.
There are also some drawbacks to the methods incorporated into the original Phoelix processing program, such as the method used to straighten curved helical filaments. Phoelix uses a fitted curve along the axis of the helix to reinterpolate the filament and straighten it. During this unbending process, high-resolution information is inevitably lost.
We originally set out to overcome some of the disadvantages of the Phoelix processing package by developing more general alignment, averaging [44], and sniffing [31, 48] methods; procedures which we integrated into a general script called Helical Image Processing (HIP). This script, which incorporates many of the innovations utilized to reach atomic resolution of the acetylcholine receptor [10], was developed and tested using several different helical datasets. The first step of HIP is to extract long filaments from the raw micrographs and divide them into small segments of a specified number of helical repeats. These helical segments are then independently corrected for in-plane and out-of-plane tilt and shifted so they are aligned and centered within the box. Then layer line information is extracted, scaled to a template, and refined by minimizing phase errors. After several rounds of averaging and sniffing a final reconstruction is generated. These methods were demonstrated to be capable of refining helical filaments to higher resolution and resulted in significantly improved density maps for three different specimens. Finally, we incorporated the HIP scripts into the Appion processing pipeline. New or modified procedures will be described in detail in section 4, however for more information on established methods please refer to prior publications referenced throughout this section.
4. The Appion Helical Processing Pipeline
4.1. Overview
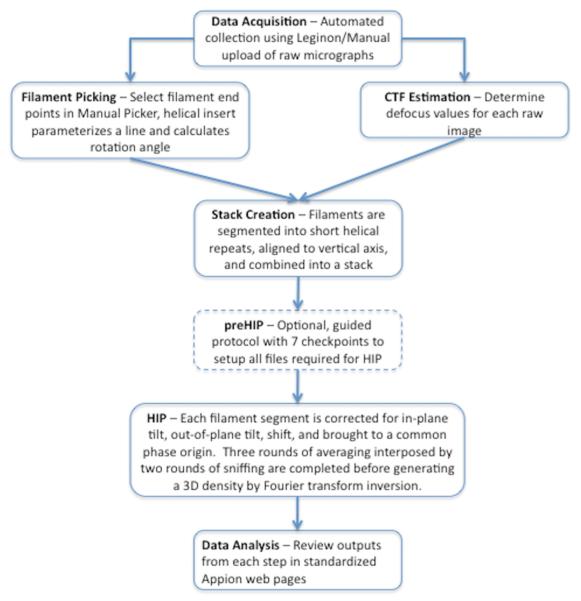
By integrating HIP into the Appion pipeline, the helical processing workflow now more closely follows typical single particle methods. It proceeds in a modular and guided fashion from raw images, which can either be acquired automatically using Leginon or uploaded from digital micrographs, to a three-dimensional density map. Each step along the way can be monitored and evaluated using the web-based reporting tools.
The overall strategy for Appion helical processing is outlined in Figure 2. The user begins each Appion helical processing step by editing a web form that either submits the job at hand to a cluster or generates a python command for manual execution. The user evaluates and picks straight portions of filaments from the raw images, which get segmented into smaller pieces of a specified size and overlap distance. Just as in the single particle workflow, the next step in the helical pipeline is estimating CTF using one of several available methods. Once CTF correction is performed on a whole image, the helical segments are extracted and combined into a stack. Along with the CTF, in-plane rotation is corrected during stack creation so the helical segments are all independently aligned parallel to the vertical axis. The small helical segments are now comparable to single particles and can be processed as such if desired. The next step in the helical pipeline is executing the setup function for HIP to prepare and verify all indexing files required for complete automation. The first step of HIP is to make the filament axis and the box center coincidental. Then layer line information is extracted from the Fast Fourier Transform of each helical segment and used for further correction of out-of-plane tilt, shift, and phase origin. The layer lines are scaled relative to a selected template and then averaged together. A sniffing routine is also performed on each layer line to extract the region with the lowest phase residual, after which the average is recalculated. The averaging and sniffing procedure is repeated and a final 3D map is generated. After successful completion of preHIP, multiple HIP jobs can be submitted simultaneously and all metadata related to each job will be stored in the database and uploaded back to the web in standardized report pages. The following sections provide more detailed descriptions of each step in the Appion helical processing protocol.
Figure 2. Flowchart illustrating the Integrated Helical Pipeline.
The overall strategy and typical workflow for progressing from raw micrographs to a three-dimensional density map using the Integrated Helical Pipeline within Appion is outlined here.
4.2. Manual Picker with Helical Insert
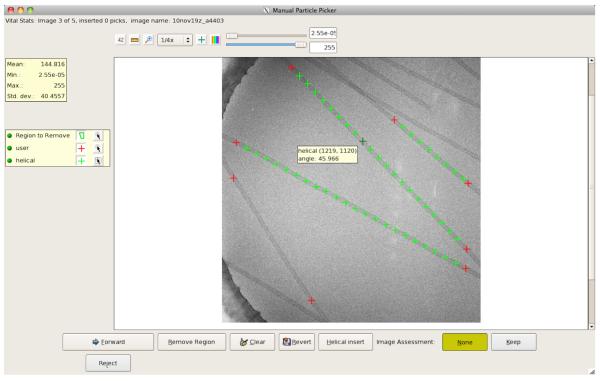
A helical function has been incorporated into Appion’s Manual Picker tool (Figure 1) that selects helical segments from the raw images and tracks the coordinates and rotation angles in the database. The helical picker relies on the user to select two end points along a relatively straight portion of the filament, after which it calculates and inserts intermediate points, called helical picks, at a predetermined interval (Figure 3). If the filament is curved, it may be necessary to select multiple regions, making sure the helical picks are in close proximity to the filament axis. The helical picks do not need to be precisely centered on the axis because further alignment is done within HIP.
Figure 3. Manual Particle Picker with Helical Functionality.
The user selects two points (denoted by red crosses) along a relatively straight section of each filament and then selects “Helical Insert”. Manual picker uses the Helical Stepsize input, and optionally Percent Overlap, to parameterize a line between the two endpoints (denoted by green crosses). Helical picks have an angle associated with them, which is used during Stack Creation to vertically align the filament segments.
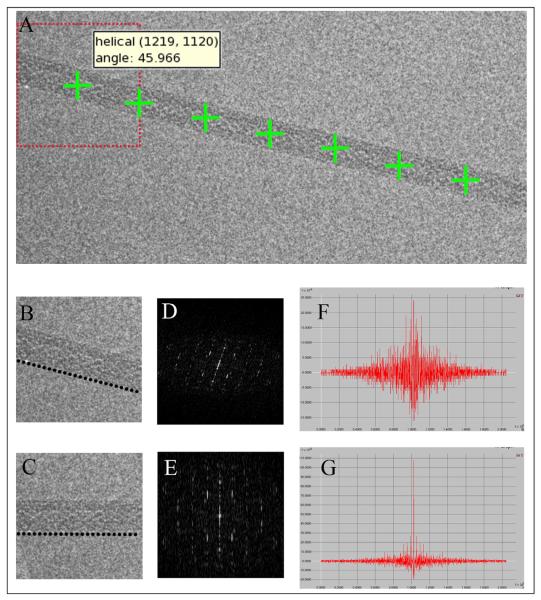
Instead of fitting the filament to a spline curve and unbending it, the filament is dissected into small, equally sized segments and rotated vertically. The step size for the helical insert parameter is set by the user in the web submission page and dictates the size of the filament segments. We have found that using an integral number of helical repeats, such as two or four, is a good metric for choosing the step size. For best results, the segments should as short as possible while still providing useful diffraction (Figure 4). This decreases the effects of variability in rise, twist, and bend along the filament and reduces the problem of non-uniform background due to variation in ice or stain thickness. The segment length, or helical step, is equivalent to the boxsize that will be used to partition the filaments during stack creation. The user can also specify the percent overlap between adjacent filament segments in order to increase the signal to noise ratio. Typical overlap values range from 60-90%, but is entirely at the user’s discretion. The helical picker calculates the rotation angle of the filament from the two user selected points and stores this data, along with the coordinates for each filament segment, in the Appion database. The user defined picks and helical picks are tracked separately by the database so the user has the option to adjust the helical stepsize and recalculate the helical picks without having to rerun Manual Picker and reselect each filament.
Figure 4. Manual picker divides the filament and aligns the short segments.
Manual picker calculates and stores the coordinate and angle information for each helical pick (A). The filament is divided into short segments to account for variation in helical pitch and twist, instead of unbending, which can result in loss of information and distortion of data. During stack creation, each filament segment is rotated first by the rough angle calculated during parameterization of the line. Then a fine rotation is performed by optimizing the strength of the diffraction pattern. An unrotated filament (B) will have a poor and noisy diffraction (D) with weak signal at the equator (F). The filament is rotated through a range of angles until the signal at the equator is maximized (E, G) and the filament is aligned (C). Finally, the two rotation angles are combined and the filament segment is extracted from the original image using a single interpolation step.
4.3. CTF Correction
With the Phoelix package integrated into the Appion pipeline, the user can choose from any of the available CTF estimation methods, which currently include Ace [49], Ace2, and CTFFIND [50]. If data is being acquired using Leginon, the CTF estimation procedures can be started concurrently with image acquisition and will proceed until the final image has been collected. The standardized web forms make launching CTF estimation quick and easy and the report pages and image viewer make evaluation convenient and transparent. The CTF estimation is applied to the entire micrograph prior to extraction of the filament segments in stack creation.
4.4. Stack Creation
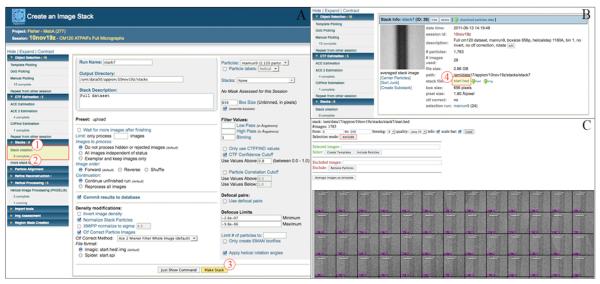
The next step in image processing is creating stacks of the selected particles. The user specifies a variety of parameters in the webform, such as number of filaments, image density, binning factor, and CTF correction method (Figure 5). Multiple stacks of various sizes using different parameter combinations can be generated. It is important to note that the terms helical step (in Ångstroms) and boxsize (in pixels) correspond to one another and both dictate the segment length the filaments will be divided into, therefore the default boxsize value for stack creation is automatically calculated from the helical step specified in the manual picking run.
Figure 5. Appion web interface for Stack Creation.
After Manual Picking is complete, each filament is divided into short segments of equal length, vertically aligned within the box, and then combined into a stack. The “Stack Creation” tool in the sidebar menu (1) redirects the user to the webform (A) where various parameters can be edited and stack creation is executed (3). To apply the rotation angles calculated during Manual Picking the user simply activates a checkbox on the submission form. The “# completed” tab (2) under “Stack Creation” in the sidebar menu links the user to the stack summary pages (B). By clicking on the stack name (4), the user can access the stack viewer (C) to evaluate the quality of each filament and clean up the stack by removing unsuitable filament segments. The stack can then be processed further using a range of available packages.
The helical coordinates and angles generated in manual picking are used to extract the filaments from the raw image and rotate them so they are roughly parallel with the y-axis. Since the initial rotation angle was calculated based on the two user selected end points, it most likely will not perfectly align the filament segments. Therefore, a second, more precise angle is calculated for each segment. The filament is rotated through a series of angles to find the one that optimizes the peak intensity of the equatorial layer line on the collapsed, background subtracted power spectrum [30] (Figure 4). A filament that is not aligned will have a poor and noisy diffraction with a weak signal at the equator. Whereas, when the filament is properly aligned the diffraction pattern is much cleaner and the peak intensity of each diffraction point is maximized. Once the refined rotation angle has been determined, it is combined with the initial angle and applied to the original image to extract and rotate the filament using a single interpolation step. The filament segments are then compiled into a stack, which can be further processed using any of the available alignment, classification, and refinement procedures within Appion (Figure 5).
4.5. Helical Imaging Processing (HIP)
4.5.1 Launching jobs from standardized webforms
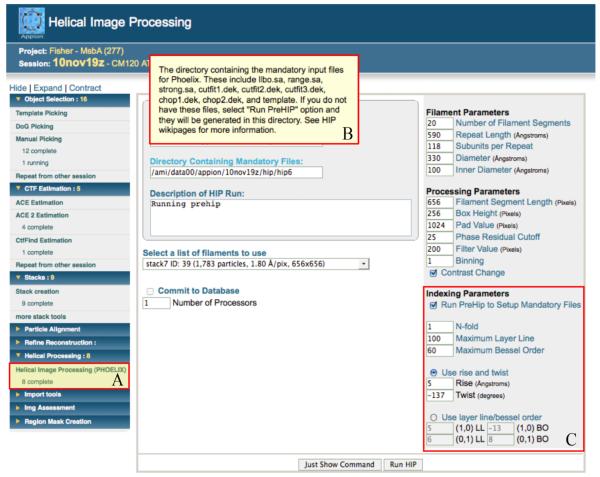
Helical Image Processing (HIP) is launched, just like every other Appion job, from the PHP web interface (Figure 6). Basic input parameters on the graphical user interface replace the lengthy parameter files that previously had to be understood and manually edited by the user. Each input parameter has pop-up help information that immediately provides a description of the parameter and how to calculate or find it. Numerous error checks are built into the webpage to prevent potential oversights and aid user naïveté. For example, if the user inputs a box size that is smaller than the filament diameter, the webform will not launch the job, but instead returns a message explaining the error. After all parameters are properly filled in, the webform generates the command for the python wrapper which can either be submitted from the webpage to the compute cluster or command line to a local machine.
Figure 6. Appion web interface for Helical Image Processing.
A modified version of Phoelix has been integrated into the Appion Pipeline (A). The web interface is used to gather necessary parameters from the user and generate or submit the python command. Each parameter has pop-up help information (B) that is displayed by hovering the cursor over the blue labels. This GUI replaces a lengthy parameter file that previously had to be understood and manually edited by the user before running any Phoelix scripts. There is also an optional Indexing Parameters section (C), which is highly recommended for first time Phoelix users, to set up mandatory indexing files via preHIP. It is assumed that the user has already indexed the diffraction pattern and has some knowledge of the filament structure, such as rise and twist. The indexing parameters are not needed, and therefore deactivated, unless the “Run PreHIP” checkbox has been selected.
4.5.2 Executing the setup function, preHIP
Before running HIP in its fully automated version, the user needs to run the setup function, called preHIP. This is a guided, interactive form of HIP that should be executed on a subset of the data. There are seven checkpoints during setup and each checkpoint creates a parameter or file. For each helical specimen type, the setup function only needs to be executed once. After the mandatory files have been generated the operator can modify them manually if desired and the files can be used over and over again with multiple stacks and various parameter combinations. We attempted to create a procedure that requires the least amount of user interaction and indexing information, while still properly preparing the necessary files for full automation. Phoelix is not an indexing package, but in order to run Phoelix, some basic indexing information is needed. It is assumed that the user has already indexed the diffraction pattern and knows the helical repeat length, number of subunits per repeat, the order of the symmetry axis, and the rise and twist or the (1,0) and (0,1) layer line/Bessel order (LLBO) combinations. preHIP uses this limited indexing information to generate six input files and optimize one parameter. For more information on helical indexing please refer to [51-53].
4.5.3 Step 1: Assigning layer line, Bessel order combinations
The first step of preHIP is generating a text file containing the complete LLBO combinations. This information is extrapolated from either the rise and twist information or the (1,0)/(0,1) LLBOs and displayed for the user to evaluate. If the LLBO generator fails it means the input values are not correct. Often due to variation in helical data, values such as rise and twist are estimations or averages, but when using these values to generate the index file they need to be as accurate as possible. The user can try using different parameters to generate the proper LLBOs or they can edit the text file manually and override the generator by supplying their own file. The latter option should be used with caution as each text file is required to be in a specific format and any typographical errors could cause auto-processing to fail.
4.5.4 Step 2: Centering and reboxing
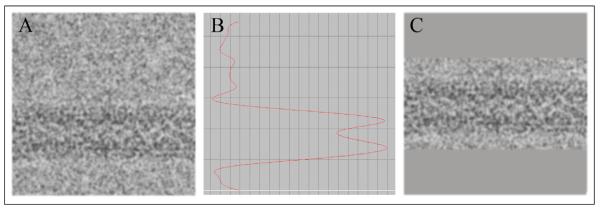
In the next step, the filaments are centered and reboxed. The filament segments are rotated to the conventional orientation for Phoelix, with the helical axis parallel to the x-axis. Then a Gaussian filter is applied and the average pixel value for each row is extracted into a vector graph (Figure 7). The edges of the filaments can be detected by searching for the two most prominent peaks in the vector graph that correlate to the expected diameter and are in close proximity to the center of the box. The center of the filament is located based on the edges and then the filament is reboxed into a tighter box to eliminate unnecessary background noise and possible surrounding contamination or adjacent filaments. The filter value that creates the smoothest and cleanest vector graph is highly dataset dependent. If the proper filter is not used the graph will either be too noisy or too smooth and the reboxing algorithms could fail to find the proper peaks or any peaks at all, which is why this step requires user intervention. During preHIP, a default value of 200 is initially used and the user is asked to evaluate the reboxed filaments and determine if the procedure was successful. If it failed, the user is asked to supply a new filter value and repeat the process until it is successful. For future HIP jobs, the optimal filter value is simply entered in the webform. We have found this method to be very successful on multiple datasets, however if the box contains multiple filaments, the box mask tool within Appion can be used prior to running HIP to exclude any possibility of the program selecting adjacent filament edges and improperly centering the target filament.
Figure 7. Reboxing and centering of the filament segments.
The filament segments are transposed to the conventional orientation for Phoelix with the helical axis parallel to the x-axis (A). The image is filtered with a Gaussian filter and the average pixel value for each row is extracted into a vector (B). The vector graph is used to find the filament edges and thus the filament center. The filament can then be centered and reboxed in a tighter box (C) to eliminate unnecessary background noise and possible surrounding contamination or adjacent filaments.
4.5.4 Step 3: Searching for strong layer lines
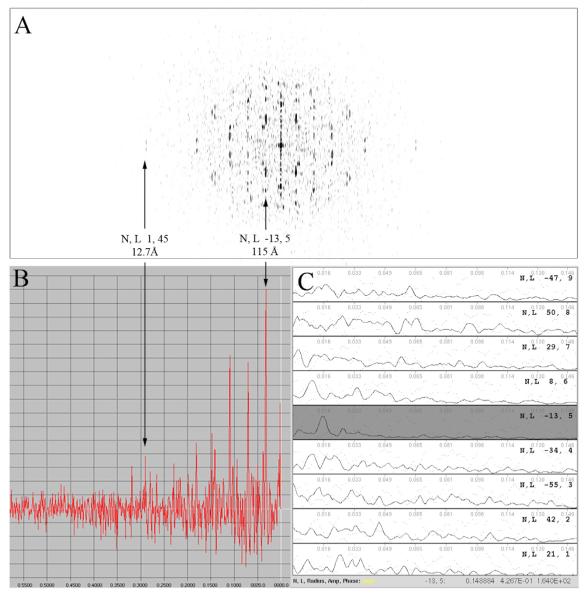
The power spectra for each of the filament segments are summed and a search is conducted for the strongest layer lines on the collapsed vector (Figure 8). These layer lines and their respective Bessel orders and intercepts are written into a file that is later used to determine the layer line spacing and predict the layer line location for each individual filament. The text file is again displayed for the user to evaluate. This file generally only contains three or four layer lines so it can be easily edited through command line prompts. If the user would prefer different LLBO combinations in the file, preHIP will remove, add, or change the lines in accordance with the user feedback.
Figure 8. Layer lines are extracted from the filament power spectrum.
Background variations are subtracted from the image prior to calculating the power spectrum (A) and collapsed vector (B). Strong layer lines are detected by searching for peaks that are two standard deviations above the background and located within a specified range around a predicted interval. Two layer lines (5 and 45) have been labeled to illustrate the relationship between the power spectrum and collapsed vector. The average layer line spacing is calculated based on the strong peaks found and then near-(C) and far-side amplitudes and phases are extracted for each layer line. Layer line 5 has been shaded on the layer line plot for comparison.
4.5.5 Step 4: Refining tilt and shift
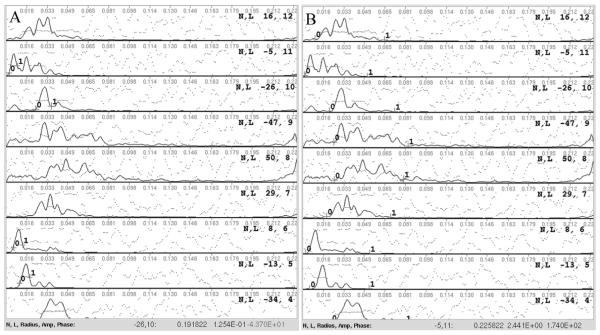
The predicted radial spacing of the signal, which is the range along the layer line where the Bessel order is expected given the inner and outer radii of the helix, is calculated for each strong layer line located in 4.5.4 and the LLBO combination and respective ranges are written into a text file. This information is presented to the user through a customized display tool, called TKLL (Figure 8C and 9). The user can select additional layer line ranges, adjust the ranges, or delete ranges and then save the modified file. For this step, only a few strong, low-resolution layer lines are needed. The ranges over these layer lines are used for correction of out-of-plane tilt and shift of each filament segment, which is performed as previously described [44].
Figure 9. Minimal user interaction is required during initial setup for Phoelix.
When running the preHIP setup function for Phoelix, the user is required to verify or specify a few parameters. Averaging of layer lines is done by fitting and aligning a few strong layer lines from each filament to a reference, or template. The user selects the radial extent of the peak, denoted by the 0-1 markers, on each strong layer line (A). Sniffing is performed between each round of averaging and each round of averaging has three iterations. Sniffing is done by searching a range around the predicted location of the Bessel order on each layer line, which is based on the inner and outer radii of the helix, and extracting the area with the lowest phase residual. During setup, the user verifies or adjusts the significant portion of each layer line for sniffer to use when calculating phase residual (B).
4.5.6 Step 5: Declaring a template
The user is asked to specify a template, which is a layer line file used for fitting, scaling, and aligning phase origins during the averaging routines. The template must contain the same LLBO combination as the raw layer line files. As mentioned above (section 4.5.3) variation in the repeat distance is not uncommon. If the variation is small, an average repeat distance (and LL spacing) may be used in the template parameters. Large variations in the repeat or in the underlying helical lattice are not compatible with the current procedures described here and may require sorting the data into families, each with its own template. For the first HIP run, the layer line file from the best diffracting filament segment with the most logical peak amplitudes and peak positions should be used. For subsequent runs, an average from a previous run can be used. Error checks have been incorporated to ensure the template is compatible with the raw data.
4.5.7 Step 6: Averaging and fitting
Averaging and fitting is done over a few of the strongest layer line peaks. In the next preHIP step, the template file is displayed using TKLL and the user is asked to select the radial extent of a few strong layer line peaks (Figure 9A). The revised version of Phoelix has a standardized averaging and sniffing protocol; two rounds of layer line sniffing interpose three rounds of iterative averaging. Each round of averaging contains three iterations of fitting. Each iteration of fitting should use more layer lines than the previous iteration. For example, iteration one might do fitting over three layer lines, iteration two over five layer lines, and iteration three over seven layer lines. The operator uses the cursor to select the peaks then save the files as cutfit#.dek (where “#” equals the fitting iteration number, i.e. 1, 2, or 3). The selected layer lines are used to align and scale the near- and far-side layer line files from each raw filament with the template. In addition, a phase residual is calculated by comparing the agreement of phases between the near and far side data over the selected layer lines. The user specifies a phase residual cutoff, typically <30, and only filaments that meet this criterion are included in the final average. The average after each round is used as the template for the next round of averaging and sniffing.
4.5.8 Step 7: Layer line sniffing
The final step in the setup function is generating the range file for sniffing, which contains the location of the significant portion along the radius of each layer line where the peaks should be located. The significant portion is defined as the area between the inner and outer radii, and is similar to the range described in 4.5.5 used for tilt and shift correction. The sniffer algorithm searches a region around each predicted layer line location to find and extract the layer line with the lowest phase residual over the specified range [48]. The layer line file for the template is again displayed using TKLL and the user then approves or adjusts the ranges for each layer line and saves the file as chop#.dek (where “#” equals the round of sniffing, i.e. 1 or 2) (Figure 9B). Typically the ranges for round one are more generous whereas the ranges for round two are more constrained.
4.5.9 Full automation with HIP
At the end of preHIP, the directory containing all of the essential files generated for HIP is displayed along with a reminder of the optimal filter value, determined in step 2 (section 4.5.4). The final average is also stored in this directory and can be used as the template for subsequent runs if desired. The HIP protocol is essentially the same as preHIP, but the interactive steps are turned off so it runs from start to finish without interruption. Multiple runs can be executed simultaneously and all of the history is automatically stored and displayed for the user in the report pages.
4.6. Reporting the Results
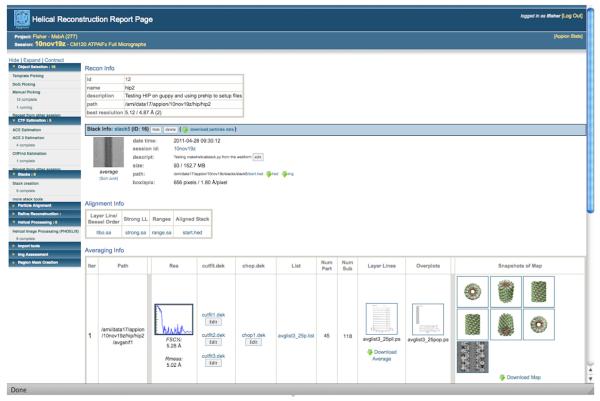
For simplicity and convenience, the report pages for HIP conform to the general layout for all refinement packages within Appion (Figure 10). After submission of a job, the status can be monitored from the web page. All processing tools are organized in the sidebar menu by job type. Status updates will appear under each tool and will either read “# queued”, “# running”, or “# completed”. Clicking on the status update will redirect the user to either the log file output if the job is still running or the summary page if the job has completed. The summary page contains an abbreviated version of the report page for each run. Only the basic information is displayed in the summary page, but the user can access the full report page by clicking on a run name. The report pages for Phoelix contain important information such as the average layer line files, overplots of the phase components included in the average, snapshots of the final reconstruction, and FSC plots and resolution calculations (Figure 10). The report pages also have download options for many output files, including stacks and maps.
Figure 10. Output data is displayed using standardized report pages.
Phoelix, like most refinement protocols, outputs a myriad of data. To a novice or even experienced user this data can be very confusing and time-consuming to analyze. The Appion Helical Pipeline facilitates communication from the python wrapper to the MySQL database. The data can then be queried from the PHP web interface and displayed in an organized and easily interpreted report page.
4.7. Documentation
All help information and documentation required for a novice user to run Phoelix start to finish can be found either in the webform, wikipages, or during execution of the setup function. Hovering the cursor over any blue input parameter labels in the Appion webforms will display a pop-up window with brief help information describing the parameter and how to determine the optimal input value (Figure 1D). The complete wikipages for the Appion helical pipeline containing more detailed help information and a step-by-step guide to a helical reconstruction can be found at http://www.appion.org. In addition, while running preHIP, instructions and prompts are displayed at each step involving user interaction. The user instructions are displayed in blue font, commands being performed by the program are displayed in green, and error messages and warnings are displayed in red.
5. MSBA: A Case Study
5.1. A Brief Background
MsbA, an ATP-binding cassette (ABC) transporter that exports lipid A and various substrates across the inner membrane of Gram-negative bacteria [54, 55], is a structural and functional homologue of the human multidrug resistant transporter, P-glycoprotein (Pgp) [56], which is widely studied for its ability to pump chemotherapeutics and a variety of drugs out of cells. When purified and reconstituted in buffer in the presence of lipid and nucleotide, MsbA forms helical tubes. These MsbA filaments were prepared and imaged as previously described [57].
5.2. A Quick Comparison
Two images from an MsbA helical dataset collected on a CM120 microscope at 120kV were randomly selected for a comparison run between the semi-automated version of Phoelix and the new revised version (HIP) that has been integrated into the Appion Helical Pipeline. The same filaments were selected for processing from each micrograph and the same parameters, such as binning factor and phase residual cutoff, were used. A comparison of the total time, user interaction time, number of asymmetric subunits, and final resolution can be found in Table 1. Preparing the parameter and range files for Phoelix took several hours and was done manually. The entire procedure took approximately 90 minutes per image. When comparing Phoelix to HIP, the overall processing time is not significantly different, but user interaction is dramatically reduced. For Phoelix, the operator had to remain at the computer the entire time in order to monitor the processing and keep it moving forward after checkpoints. It took approximately 45 minutes for the operator to run preHIP and other than that the only user interaction time was the 1-2 minutes it took to launch jobs from the web form.
Table 1. Comparing manual execution of Phoelix with execution from the Integrated Helical Pipeline.
Two raw micrographs from an MsbA dataset were randomly selected and processed using both the original Phoelix package and HIP. The same 10 filaments and the same parameters were used for each package. This table shows the total processing time, total user interaction time, and the quality of the final map from the two different processing runs. HIP used a 60% overlap during filament picking, but the number of asymmetric subunits has been adjusted to include only unique subunits. The extent of meaningful phase and amplitudes on the layer line plots show similar resolution estimates as the FSC plots generated from maps of two random halves of the data (see Figure 11).
| Total Processing Time |
Total User Interaction Time |
Number of Asymmetric Subunits in Final Map |
Resolutino from Layer Line Data |
Resolution from FSC Coefficient |
|
|---|---|---|---|---|---|
|
Original Phoelix |
8hr 20min | 8hr 20min | 16338 | 20.6Å | 22.8Å |
|
Integrated Helical Pipeline (HIP) |
7hr 45min | 50min | 10674 | 12.7Å | 14.8Å |
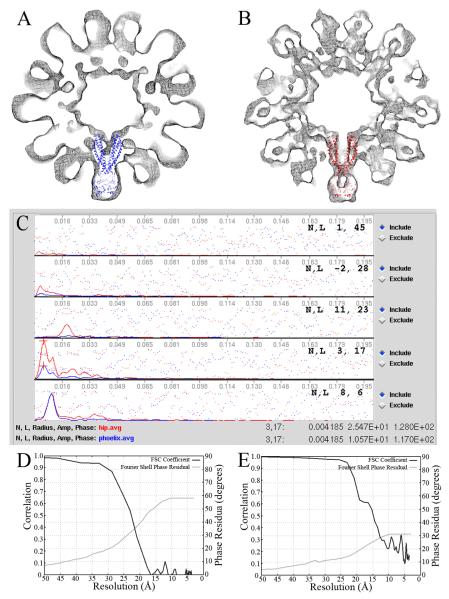
The resolution estimates found in Table 1 were determined based on the highest order layer line from the averages containing amplitudes with significant signal over the background and smooth phases. A Fourier Shell Coefficient was also calculated by comparing maps from two random halves of both datasets. The same 80 pixel cubic density was boxed out of each map, the boxes were padded to 128 pixels, and then masked with a Gaussian falloff to eliminate any hard edges before the FSC was calculated. Fourier Shell phase residual plots were generated by plotting the amplitude weighted phase differences of two independent helical averages as a function of resolution, as described previously [58]. All three resolution estimates are in agreement with one another (Figure 11). After evaluating the layer line plots and the density maps, it is clear that HIP was able to better sort the data and extract more high resolution information from the test dataset than Phoelix (Figure 11). Phoelix, which uses the straightening routine described earlier, does improve the signal to noise ratio in the low resolution layer line information. However, the high resolution information is lost, possibly due to blurring and distortion during unbending. Evaluating small helical segments removes the need for this reinterpolation and preserves the high resolution information. In addition, due to variation in helical parameters such as pitch and twist and many other variables, some areas of a filament diffract better than others. With Phoelix, a problem arises by not sorting these areas of variability. In some cases a filament will not diffract well in its entirety and therefore will not meet the phase residual cutoff requirements. The whole filament will be excluded from the final average, even though some regions may contain valuable information. In other cases the filament may get included, but the overall quality of the diffraction pattern is diluted because areas with poor and strong diffraction are merged together. In HIP the filament segments are evaluated separately and therefore more good data and less bad data is included in the final average.
Figure 11. Comparing manual execution of Phoelix with execution from the Integrated Helical Pipeline.
Cross-sectional views of the helical density maps from Phoelix (A) and HIP (B) are shown with the X-ray structure of MsbA from Salmonella typhimurium with AMPPNP (PDB ID: 3B60) docked in denoting a single subunit. The density maps were lowpass filtered to their respective resolution estimates. The layer line plots (C) show a subset of the final average from Phoelix (in blue) and the final average from HIP (in red). The amplitude signals correlate at low resolution (i.e. LL 6), however the HIP amplitudes are significantly improved over Phoelix at higher resolution (i.e. LL 17). Layer line 28 is equivalent to 20.6Å resolution and is the highest order layer line that the Phoelix average shows meaningful amplitude and phases. The HIP average shows meaningful signal out to 12.7Å (layer line 45). Evaluation of the reconstructions with FSC and Fourier Shell phase residual show similar resolution estimates. At an FSC of 0.5 the resolution is estimated to be 22.8Å for original Phoelix (D) and 14.8Å for HIP (E).
6. Discussion
We have incorporated the Phoelix package for Fourier-Bessel helical reconstructions with an added segmental approach into a more efficient and standardized routine, called HIP. In addition, we have integrated HIP into Appion creating a Helical Image Processing pipeline that conforms to typical single particle processing methods. This addition to Appion is the first step in making helical processing a more straightforward and useful tool for electron microscopy.
One of the biggest advantages of integrating Phoelix into the Appion pipeline is the localization of each processing step and related output data. Users no longer need to search through Linux directories or handwritten notes to recall previous processing jobs or backtrack through log files to figure out which filament went into which reconstruction. Multiple runs with different datasets or parameter combinations can be executed simultaneously. All jobs and metadata are tracked in the MySQL database automatically and pertinent information is fed back to the operator in easy-to-navigate viewers and report pages.
Another improvement is the guided setup function that walks the operator through the process of generating indexing files required for Phoelix. The user specifies a few additional indexing parameters on the webform and executes a supervised, interactive form of Phoelix on a subset of the data. Although it is optional, preHIP is highly recommended for first time users since the essential files must adhere to specific formats. The setup function removes the need to know how to generate each file and the required format, but still gives the operator control over certain processing steps that cannot be optimized without user input.
HIP has been successfully tested on three diverse helical datasets (microtubule and TMV results not shown here) proving that it is versatile, efficient, and effective. The MsbA case study presented here has also shown that this new platform outperforms the original version of Phoelix in terms of obtaining resolution. When compared with previous methods for Fourier-Bessel processing, HIP results in averages with stronger amplitudes on higher resolution layer lines. These improvements are due to a combination of new or modified features within the Phoelix package, such as processing short filament segments, better alignment routines, better selection of data, and implementing an optimized averaging routine. Processing within the pipeline conserves operator interaction time and makes data analysis easier to track, more convenient, and more transparent. In addition, other common issues when dealing with helical specimens can be alleviated by utilizing the variety of tools available in Appion. As of now, Phoelix is best for a single family of well-indexed filaments with strong diffraction and low variability. However, heterogeneity in helical specimens can be addressed by classifying the stack of filaments with commonly used single particle methods available in Appion. Each helical family can then be sorted into a separate stack prior to running HIP. We have long term plans, described in the next section, for offering alternative solutions for dealing with heterogeneity and other helical processing complications.
7. Future Directions
In the future we intend to integrate several additional helical processing packages into the Appion pipeline. This will permit operators to utilize multiple methods and determine which works best for their data. Phoelix mainly operates in Fourier space and works best for filaments that provide diffraction patterns with several strong layer lines. In contrast, the Iterative Helical Real Space Reconstruction method (IHRSR) operates in real space and has been shown to work well for helical filaments that diffract weakly and contain a high level of disorder [59-63]. Appion encourages the use of independent methods as every dataset is different and therefore responds differently to various protocols. In addition, the use of multiple packages can be a tool to improve reliability of reconstructions, as each method should converge on a similar result. The Appion pipeline facilitates this type of multi-package analysis through its standardized web forms and report pages, and the ability to launch numerous jobs simultaneously.
Further improvements that will be addressed in the future include the ability to execute all steps of the helical pipeline from within the pipeline. As of now certain protocols, such as manual picking and preHIP, must be performed outside of Appion because they require user interfaces that are not executable from the webpages. Tools such as an auto-helical picker or custom, interactive webforms will increase the efficiency and power of the pipeline.
We would also like to incorporate various tools into the Helical Pipeline to overcome the issue of helical indexing, which is often the biggest hurdle in helical processing due to variation in helical arrays, complex diffraction patterns, and the complicated methods currently used. Windex [53] is a semi-automated set of procedures designed to make helical indexing more straightforward and accessible, which will be a great addition to the helical pipeline. Helical data from Tomograms and a helical initial model generator are other examples of tools that could supplement Windex, further simplifying the processing of helical indexing.
Acknowledgements
The work presented here was supported by grants R01GM095573 (to B.C.), GM52468 and GM75820 (to R.A.M.), and GM61941 (to N.U.). Some of the work was conducted at the National Resource for Automated Molecular Microscopy, which is supported by the National Institutes of Health though the National Center for Research Resources’ P41 program (RR017573). We thank the laboratory of Geoffrey Chang for kindly providing purified MsbA that was used to make the helical arrays presented here.
Footnotes
Publisher's Disclaimer: This is a PDF file of an unedited manuscript that has been accepted for publication. As a service to our customers we are providing this early version of the manuscript. The manuscript will undergo copyediting, typesetting, and review of the resulting proof before it is published in its final citable form. Please note that during the production process errors may be discovered which could affect the content, and all legal disclaimers that apply to the journal pertain.
References
- [1].Fujiyoshi Y, Unwin N. Electron crystallography of proteins in membranes. Curr Opin Struct Biol. 2008;18:587–592. doi: 10.1016/j.sbi.2008.07.005. [DOI] [PMC free article] [PubMed] [Google Scholar]
- [2].Raunser S, Walz T. Electron Crystallography as a Technique to Study the Structure on Membrane Proteins in a Lipidic Environment. Annu Rev Biophys. 2009;38:89–105. doi: 10.1146/annurev.biophys.050708.133649. [DOI] [PubMed] [Google Scholar]
- [3].Kuhlbrandt W, Gennis RB. MEMBRANE-PROTEINS. Curr Opin Struct Biol. 1994;4:517–518. doi: 10.1016/S0959-440X(99)80062-1. [DOI] [PubMed] [Google Scholar]
- [4].Murata K, Mitsuoka K, Hirai T, Walz T, Agre P, Heymann JB, Engel A, Fujiyoshi Y. Structural determinants of water permeation through aquaporin-1. Nature. 2000;407:599–605. doi: 10.1038/35036519. [DOI] [PubMed] [Google Scholar]
- [5].Breyton C, Haase W, Rapoport TA, Kuhlbrandt W, Collinson I. Three-dimensional structure of the bacterial protein-translocation complex SecYEG. Nature. 2002;418:662–665. doi: 10.1038/nature00827. [DOI] [PubMed] [Google Scholar]
- [6].Gonen T, Cheng YF, Sliz P, Hiroaki Y, Fujiyoshi Y, Harrison SC, Walz T. Lipid-protein interactions in double-layered two-dimensional AQPO crystals. Nature. 2005;438:633–638. doi: 10.1038/nature04321. [DOI] [PMC free article] [PubMed] [Google Scholar]
- [7].Holm PJ, Bhakat P, Jegerschold C, Gyobu N, Mitsuoka K, Fujiyoshi Y, Morgenstern R, Hebert H. Structural basis for detoxification and oxidative stress protection in membranes. J Mol Biol. 2006;360:934–945. doi: 10.1016/j.jmb.2006.05.056. [DOI] [PubMed] [Google Scholar]
- [8].Oshima A, Tani K, Hiroaki Y, Fujiyoshi Y, Sosinsky GE. Three-dimensional structure of a human connexin26 gap junction channel reveals a plug in the vestibule. Proc Natl Acad Sci U S A. 2007;104:10034–10039. doi: 10.1073/pnas.0703704104. [DOI] [PMC free article] [PubMed] [Google Scholar]
- [9].Miyazawa A, Fujiyoshi Y, Unwin N. Structure and gating mechanism of the acetylcholine receptor pore. Nature. 2003;423:949–955. doi: 10.1038/nature01748. [DOI] [PubMed] [Google Scholar]
- [10].Unwin N. Refined structure of the nicotinic acetylcholine receptor at 4A resolution. J Mol Biol. 2005;346:967–989. doi: 10.1016/j.jmb.2004.12.031. [DOI] [PubMed] [Google Scholar]
- [11].Unwin N, Miyazawa A, Li J, Fujiyoshi Y. Activation of the nicotinic acetylcholine receptor involves a switch in conformation of the alpha subunits. J Mol Biol. 2002;319:1165–1176. doi: 10.1016/S0022-2836(02)00381-9. [DOI] [PubMed] [Google Scholar]
- [12].Kukulski W, Schenk AD, Johanson U, Braun T, de Groot BL, Fotiadis D, Kjellbom P, Engel A. The 5A structure of heterologously expressed plant aquaporin SoPIP2;1. J Mol Biol. 2005;350:611–616. doi: 10.1016/j.jmb.2005.05.001. [DOI] [PubMed] [Google Scholar]
- [13].Leschziner AE, Nogales E. Visualizing flexibility at molecular resolution: analysis of heterogeneity in single-particle electron microscopy reconstructions. Annu Rev Biophys Biomol Struct. 2007;36:43–62. doi: 10.1146/annurev.biophys.36.040306.132742. [DOI] [PubMed] [Google Scholar]
- [14].Zhou ZH. Towards atomic resolution structural determination by single-particle cryo-electron microscopy. Curr Opin Struct Biol. 2008;18:218–228. doi: 10.1016/j.sbi.2008.03.004. [DOI] [PMC free article] [PubMed] [Google Scholar]
- [15].Jiang W, Baker ML, Jakana J, Weigele PR, King J, Chiu W. Backbone structure of the infectious epsilon15 virus capsid revealed by electron cryomicroscopy. Nature. 2008;451:1130–1134. doi: 10.1038/nature06665. [DOI] [PubMed] [Google Scholar]
- [16].Yu X, Jin L, Zhou ZH. 3.88 A structure of cytoplasmic polyhedrosis virus by cryo-electron microscopy. Nature. 2008;453:415–419. doi: 10.1038/nature06893. [DOI] [PMC free article] [PubMed] [Google Scholar]
- [17].Zhang X, Settembre E, Xu C, Dormitzer PR, Bellamy R, Harrison SC, Grigorieff N. Near-atomic resolution using electron cryomicroscopy and single-particle reconstruction. Proc Natl Acad Sci U S A. 2008;105:1867–1872. doi: 10.1073/pnas.0711623105. [DOI] [PMC free article] [PubMed] [Google Scholar]
- [18].Grigorieff N, Harrison SC. Near-atomic resolution reconstructions of icosahedral viruses from electron cryo-microscopy. Curr Opin Struct Biol. 2011;21:265–273. doi: 10.1016/j.sbi.2011.01.008. [DOI] [PMC free article] [PubMed] [Google Scholar]
- [19].Zhang X, Jin L, Fang Q, Hui WH, Zhou ZH. 3.3 A cryo-EM structure of a nonenveloped virus reveals a priming mechanism for cell entry. Cell. 2010;141:472–482. doi: 10.1016/j.cell.2010.03.041. [DOI] [PMC free article] [PubMed] [Google Scholar]
- [20].Liu H, Jin L, Koh SB, Atanasov I, Schein S, Wu L, Zhou ZH. Atomic structure of human adenovirus by cryo-EM reveals interactions among protein networks. Science. 2010;329:1038–1043. doi: 10.1126/science.1187433. [DOI] [PMC free article] [PubMed] [Google Scholar]
- [21].Zhou ZH. Atomic resolution cryo electron microscopy of macromolecular complexes. Adv Protein Chem Struct Biol. 2011;82:1–35. doi: 10.1016/B978-0-12-386507-6.00001-4. [DOI] [PMC free article] [PubMed] [Google Scholar]
- [22].Grob P, Cruse MJ, Inouye C, Peris M, Penczek PA, Tjian R, Nogales E. Cryo-electron microscopy studies of human TFIID: conformational breathing in the integration of gene regulatory cues. Structure. 2006;14:511–520. doi: 10.1016/j.str.2005.11.020. [DOI] [PubMed] [Google Scholar]
- [23].Scheres SH, Nunez-Ramirez R, Gomez-Llorente Y, San Martin C, Eggermont PP, Carazo JM. Modeling experimental image formation for likelihood-based classification of electron microscopy data. Structure. 2007;15:1167–1177. doi: 10.1016/j.str.2007.09.003. [DOI] [PMC free article] [PubMed] [Google Scholar]
- [24].Golas MM, Sander B, Will CL, Luhrmann R, Stark H. Molecular architecture of the multiprotein splicing factor SF3b. Science. 2003;300:980–984. doi: 10.1126/science.1084155. [DOI] [PubMed] [Google Scholar]
- [25].Luhrmann R, Stark H. Structural mapping of spliceosomes by electron microscopy. Curr Opin Struct Biol. 2009;19:96–102. doi: 10.1016/j.sbi.2009.01.001. [DOI] [PubMed] [Google Scholar]
- [26].Ge P, Zhou ZH. Hydrogen-bonding networks and RNA bases revealed by cryo electron microscopy suggest a triggering mechanism for calcium switches. Proc Natl Acad Sci U S A. 2011;108:9637–9642. doi: 10.1073/pnas.1018104108. [DOI] [PMC free article] [PubMed] [Google Scholar]
- [27].Ludtke SJ, Serysheva, Hamilton SL, Chiu W. The pore structure of the closed RyR1 channel. Structure. 2005;13:1203–1211. doi: 10.1016/j.str.2005.06.005. [DOI] [PMC free article] [PubMed] [Google Scholar]
- [28].Rubinstein JL. Structural analysis of membrane protein complexes by single particle electron microscopy. Methods. 2007;41:409–416. doi: 10.1016/j.ymeth.2006.07.019. [DOI] [PubMed] [Google Scholar]
- [29].Glaeser RM. Retrospective: Radiation damage and its associated “Information Limitations”. J Struct Biol. 2008;163:271–276. doi: 10.1016/j.jsb.2008.06.001. [DOI] [PubMed] [Google Scholar]
- [30].Whittaker M, Carragher BO, Milligan RA. PHOELIX: a package for semi-automated helical reconstruction. Ultramicroscopy. 1995;58:245–259. doi: 10.1016/0304-3991(95)00057-8. [DOI] [PubMed] [Google Scholar]
- [31].Carragher B, Whittaker M, Milligan RA. Helical processing using PHOELIX. J Struct Biol. 1996;116:107–112. doi: 10.1006/jsbi.1996.0018. [DOI] [PubMed] [Google Scholar]
- [32].Stagg SM, Lander GC, Quispe J, Voss NR, Cheng A, Bradlow H, Bradlow S, Carragher B, Potter CS. A test-bed for optimizing high-resolution single particle reconstructions. J Struct Biol. 2008;163:29–39. doi: 10.1016/j.jsb.2008.04.005. [DOI] [PMC free article] [PubMed] [Google Scholar]
- [33].Lander GC, Stagg SM, Voss NR, Cheng A, Fellmann D, Pulokas J, Yoshioka C, Irving C, Mulder A, Lau PW, Lyumkis D, Potter CS, Carragher B. Appion: an integrated, database-driven pipeline to facilitate EM image processing. J Struct Biol. 2009;166:95–102. doi: 10.1016/j.jsb.2009.01.002. [DOI] [PMC free article] [PubMed] [Google Scholar]
- [34].Voss NR, Lyumkis D, Cheng A, Lau PW, Mulder A, Lander GC, Brignole EJ, Fellmann D, Irving C, Jacovetty EL, Leung A, Pulokas J, Quispe JD, Winkler H, Yoshioka C, Carragher B, Potter CS. A toolbox for ab initio 3-D reconstructions in single-particle electron microscopy. J Struct Biol. 2010;169:389–398. doi: 10.1016/j.jsb.2009.12.005. [DOI] [PMC free article] [PubMed] [Google Scholar]
- [35].Lyumkis D, Moeller A, Cheng A, Herold A, Hou E, Irving C, Jacovetty EL, Lau PW, Mulder AM, Pulokas J, Quispe JD, Voss NR, Potter CS, Carragher B. Automation in single-particle electron microscopy connecting the pieces. Methods Enzymol. 2010;483:291–338. doi: 10.1016/S0076-6879(10)83015-0. [DOI] [PubMed] [Google Scholar]
- [36].Potter CS, Chu H, Frey B, Green C, Kisseberth N, Madden TJ, Miller KL, Nahrstedt K, Pulokas J, Reilein A, Tcheng D, Weber D, Carragher B. Leginon: a system for fully automated acquisition of 1000 electron micrographs a day. Ultramicroscopy. 1999;77:153–161. doi: 10.1016/s0304-3991(99)00043-1. [DOI] [PubMed] [Google Scholar]
- [37].Carragher B, Kisseberth N, Kriegman D, Milligan RA, Potter CS, Pulokas J, Reilein A. Leginon: an automated system for acquisition of images from vitreous ice specimens. J Struct Biol. 2000;132:33–45. doi: 10.1006/jsbi.2000.4314. [DOI] [PubMed] [Google Scholar]
- [38].Suloway C, Pulokas J, Fellmann D, Cheng A, Guerra F, Quispe J, Stagg S, Potter CS, Carragher B. Automated molecular microscopy: the new Leginon system. J Struct Biol. 2005;151:41–60. doi: 10.1016/j.jsb.2005.03.010. [DOI] [PubMed] [Google Scholar]
- [39].Stagg SM, Lander GC, Pulokas J, Fellmann D, Cheng A, Quispe JD, Mallick SP, Avila RM, Carragher B, Potter CS. Automated cryoEM data acquisition and analysis of 284742 particles of GroEL. J Struct Biol. 2006;155:470–481. doi: 10.1016/j.jsb.2006.04.005. [DOI] [PubMed] [Google Scholar]
- [40].Crowther RA, Henderson R, Smith JM. MRC image processing programs. J Struct Biol. 1996;116:9–16. doi: 10.1006/jsbi.1996.0003. [DOI] [PubMed] [Google Scholar]
- [41].Moore PB, Huxley HE, DeRosier DJ. Three-dimensional reconstruction of F-actin, thin filaments and decorated thin filaments. J Mol Biol. 1970;50:279–295. doi: 10.1016/0022-2836(70)90192-0. [DOI] [PubMed] [Google Scholar]
- [42].DeRosier DJ, Moore PB. Reconstruction of three-dimensional images from electron micrographs of structures with helical symmetry. J Mol Biol. 1970;52:355–369. doi: 10.1016/0022-2836(70)90036-7. [DOI] [PubMed] [Google Scholar]
- [43].Schroeter JP, Bretaudiere JP. SUPRIM: easily modified image processing software. J Struct Biol. 1996;116:131–137. doi: 10.1006/jsbi.1996.0021. [DOI] [PubMed] [Google Scholar]
- [44].Milligan RA, Flicker PF. Structural relationships of actin, myosin, and tropomyosin revealed by cryo-electron microscopy. J Cell Biol. 1987;105:29–39. doi: 10.1083/jcb.105.1.29. [DOI] [PMC free article] [PubMed] [Google Scholar]
- [45].Unwin N. Nicotinic acetylcholine receptor at 9 A resolution. J Mol Biol. 1993;229:1101–1124. doi: 10.1006/jmbi.1993.1107. [DOI] [PubMed] [Google Scholar]
- [46].McGough A, Way M, DeRosier D. Determination of the alpha-actinin-binding site on actin filaments by cryoelectron microscopy and image analysis. J Cell Biol. 1994;126:433–443. doi: 10.1083/jcb.126.2.433. [DOI] [PMC free article] [PubMed] [Google Scholar]
- [47].Schmid MF, Agris JM, Jakana J, Matsudaira P, Chiu W. Three-dimensional structure of a single filament in the Limulus acrosomal bundle: scruin binds to homologous helix-loop-beta motifs in actin. J Cell Biol. 1994;124:341–350. doi: 10.1083/jcb.124.3.341. [DOI] [PMC free article] [PubMed] [Google Scholar]
- [48].Morgan DG, Owen C, Melanson LA, DeRosier DJ. Structure of bacterial flagellar filaments at 11 A resolution: packing of the alpha-helices. J Mol Biol. 1995;249:88–110. doi: 10.1006/jmbi.1995.0282. [DOI] [PubMed] [Google Scholar]
- [49].Mallick SP, Carragher B, Potter CS, Kriegman DJ. ACE: automated CTF estimation. Ultramicroscopy. 2005;104:8–29. doi: 10.1016/j.ultramic.2005.02.004. [DOI] [PubMed] [Google Scholar]
- [50].Mindell JA, Grigorieff N. Accurate determination of local defocus and specimen tilt in electron microscopy. J Struct Biol. 2003;142:334–347. doi: 10.1016/s1047-8477(03)00069-8. [DOI] [PubMed] [Google Scholar]
- [51].Diaz R, Rice WJ, Stokes DL. Fourier-Bessel reconstruction of helical assemblies. Methods Enzymol. 2010;482:131–165. doi: 10.1016/S0076-6879(10)82005-1. [DOI] [PMC free article] [PubMed] [Google Scholar]
- [52].Toyoshima C. Structure determination of tubular crystals of membrane proteins. I. Indexing of diffraction patterns. Ultramicroscopy. 2000;84:1–14. doi: 10.1016/s0304-3991(00)00010-3. [DOI] [PubMed] [Google Scholar]
- [53].Ward A, Moody MF, Sheehan B, Milligan RA, Carragher B. Windex: a toolset for indexing helices. J Struct Biol. 2003;144:172–183. doi: 10.1016/j.jsb.2003.10.008. [DOI] [PubMed] [Google Scholar]
- [54].Doerrler WT, Gibbons HS, Raetz CR. MsbA-dependent translocation of lipids across the inner membrane of Escherichia coli. J Biol Chem. 2004;279:45102–45109. doi: 10.1074/jbc.M408106200. [DOI] [PubMed] [Google Scholar]
- [55].Doerrler WT, Reedy MC, Raetz CR. An Escherichia coli mutant defective in lipid export. J Biol Chem. 2001;276:11461–11464. doi: 10.1074/jbc.C100091200. [DOI] [PubMed] [Google Scholar]
- [56].Gottesman MM, Pastan I. Biochemistry of multidrug resistance mediated by the multidrug transporter. Annu Rev Biochem. 1993;62:385–427. doi: 10.1146/annurev.bi.62.070193.002125. [DOI] [PubMed] [Google Scholar]
- [57].Ward A, Mulligan S, Carragher B, Chang G, Milligan RA. Nucleotide dependent packing differences in helical crystals of the ABC transporter MsbA. J Struct Biol. 2009;165:169–175. doi: 10.1016/j.jsb.2008.11.006. [DOI] [PMC free article] [PubMed] [Google Scholar]
- [58].Xu C, Rice WJ, He W, Stokes DL. A structural model for the catalytic cycle of Ca(2+)-ATPase. J Mol Biol. 2002;316:201–211. doi: 10.1006/jmbi.2001.5330. [DOI] [PubMed] [Google Scholar]
- [59].Egelman EH. The iterative helical real space reconstruction method: surmounting the problems posed by real polymers. J Struct Biol. 2007;157:83–94. doi: 10.1016/j.jsb.2006.05.015. [DOI] [PubMed] [Google Scholar]
- [60].Egelman EH. Reconstruction of helical filaments and tubes. Methods Enzymol. 2010;482:167–183. doi: 10.1016/S0076-6879(10)82006-3. [DOI] [PMC free article] [PubMed] [Google Scholar]
- [61].Pomfret AJ, Rice WJ, Stokes DL. Application of the iterative helical real-space reconstruction method to large membranous tubular crystals of P-type ATPases. J Struct Biol. 2007;157:106–116. doi: 10.1016/j.jsb.2006.05.012. [DOI] [PMC free article] [PubMed] [Google Scholar]
- [62].Mears JA, Hinshaw JE. Visualization of dynamins. Methods Cell Biol. 2008;88:237–256. doi: 10.1016/S0091-679X(08)00413-5. [DOI] [PMC free article] [PubMed] [Google Scholar]
- [63].Wang YA, Yu X, Ng SY, Jarrell KF, Egelman EH. The structure of an archaeal pilus. J Mol Biol. 2008;381:456–466. doi: 10.1016/j.jmb.2008.06.017. [DOI] [PMC free article] [PubMed] [Google Scholar]


