Abstract
Ovarian cancer, the most deadly gynecologic malignancy, is often diagnosed late and at the advanced stage when the cancer cells have already migrated and invaded into other tissues and organs. Better understanding of the mechanism of metastasis in ovarian cancer cells is essential to the design of effective therapy. In this study, we investigated the function of scaffolding adaptor protein Gab2 in ovarian cancer cells. Gab2 is found to be overexpressed in a subset of ovarian tumors and cancer cell lines. Gab2 expression mainly regulates the migratory behaviors of ovarian cancer cells. Overexpression of Gab2 promotes the migration and invasion, and down-regulates E-cadherin expression in ovarian cancer cells with low-Gab2 expression. Conversely, knockdown of Gab2 expression inhibits the migration and invasion, and promotes E-cadherin expression in ovarian cancer cells with high-Gab2 expression. By expressing Gab2 wild type and Gab2 mutants that are defective in activation the PI3K and Shp2-Erk pathways, we find that Gab2 inhibits E-cadherin expression and enhances the expression of Zeb1, a transcription factor involved in epithelial-to-mesenchymal transition (EMT), and cell migration and invasion through the activation of the PI3K pathway. Knockdown of Zeb1 expression blocks Gab2-induced suppression of E-cadherin expression and increase in cell invasion. LY294002 and GDC-0941, inhibitors of PI3K, or Rapamycin, an inhibitor of PI3K downstream target mTOR, can reverse the effects of Gab2 on migration and invasion. Overall, our studies reveal that Gab2 overexpression, via activation of the PI3K-Zeb1 pathway, promotes characteristics of EMT in ovarian cancer cells.
Keywords: Gab2, PI3K, Zeb1, E-cadherin, EMT, ovarian cancer
Introduction
About 90% of the ovarian cancers are thought to originate from the epithelium of the ovarian surface, the peritoneum, or cortical inclusion cysts (Bast et al 2009, Feeley and Wells 2001, Shih Ie and Kurman 2004). However, recent studies support a model that ovarian serous carcinoma arise from the epithelium of the fallopian tube (Karst et al 2011, Kurman and Shih Ie 2010, Levanon et al 2008). Unfortunately, most women with ovarian cancer are originally diagnosed at advanced stages (Jemal et al 2004), during which time the ovarian tumor cells have already migrated out from their primary sites, attached and invaded into adjacent organs, or organs in the peritoneal cavity. Ovarian cancer patients with advanced diseases show initial sensitivity to available standard chemotherapies (i.e. carboplatin and paclitaxel); however, 80% will have recurrent diseases (Tan et al 2008) and only 20% of them survive beyond 5-years (Jemal et al 2004). Although studies have identified detailed steps of primary ovarian tumor cells metastasizing to secondary organs (Tan et al 2006), no current therapeutics can successfully treat metastatic ovarian cancer. Thus, better understanding of the mechanism or molecules that regulate the growth and migratory behaviors of ovarian cancer cells is essential to develop new effective therapies.
Gab2 is a member of the DOS/Gab family of scaffolding adapters that include mammalian Gab1, Gab3, Drosophila DOS, and C. elegans SOC-1 (Gu and Neel 2003, Wohrle et al 2009). Like its family member, Gab2 contains an N-terminal pleckstrin homology (PH) domain, and C-terminal portion of molecule with proline rich motifs and multiple tyrosine phosphorylation sites. Tyrosyl phosphorylated Gab2 recruits SH2-domain containing signaling proteins including tyrosine phosphatase Shp2 and p85 (the regulatory subunit of PI3K), resulting in the activation of the Ras-Erk and PI3K-Akt pathways, respectively, downstream of a variety of cell surface receptors. One of the PI3K-Akt regulated pathways is the mTOR-S6K cascade that is involved in growth regulation by controlling the cap-dependent protein translation (Luo et al 2003). These Gab2-regulated pathways play critical roles in regulating the growth, survival, differentiation, and migration of different cell types (Gu and Neel 2003, Wohrle et al 2009).
Gab2 also plays a role in human cancers. Gab2 is overexpressed in several human cancers including breast cancer (Bentires-Alj et al 2006, Daly et al 2002, Fleuren et al 2010), and melanoma (Horst et al 2009). Gab2 gene amplification is at least one mechanism contributing to Gab2 protein overexpression in breast cancer (Bentires-Alj et al 2006, Bocanegra et al 2010) and melanoma (Horst et al 2009). Gab2 overexpression alone or in combination with other oncogenes promote the proliferation and invasive growth of mammary epithelial cells in three dimensional (3D) culture (Bentires-Alj et al 2006, Brummer et al 2006), and the growth (Bentires-Alj et al 2006), migration and metastasis of mammary tumors in mice (Ke et al 2007). Gab2 regulates the proliferation and migratory behaviors of the mammary epithelial and tumor cells mainly through the activation of Shp2-dependent pathways (Abreu et al 2011, Bentires-Alj et al 2006, Ke et al 2007). Higher Gab2 expression is associated with metastatic melanomas. Interestingly, Gab2 expression promotes the migration, invasion, and metastasis of melanoma cells via activation of the PI3K pathway although the detailed mechanism is still not well understood (Horst et al 2009). These data indicate that Gab2 uses distinct cell signaling pathways to regulate the migratory behaviors and metastasis of tumor cells in different cancers. Understanding the cancer context dependent Gab2 action on migration and metastasis should provide insights for novel cancer therapy.
Compared to its role in breast cancer and melanoma, the function of Gab2 in ovarian cancer is less understood. Amplification of the Gab2 gene located in the 11q13 locus has been reported in a subset (~15%) of ovarian cancers (Brown et al 2008, Shih Ie et al 2005). However, it is not known whether the Gab2 protein is also overexpressed in ovarian tumors and whether Gab2 plays any role in the growth and metastasis of ovarian cancer cells. Considering the involvement of Gab2 in breast cancer and melanoma, we hypothesize that Gab2 expression contributes to the progression of ovarian cancer. In this study, we investigated the function of Gab2 in ovarian cancer by manipulating the expression of Gab2 in ovarian cancer cell lines. We find that Gab2 expression mainly promotes the characteristics of epithelial-to-mesenchymal transition (EMT) such as increase in cell migration, invasion, and decrease in the expression of E-cadherin, an epithelial cell marker. Gab2 down-regulates the expression of E-cadherin, via a novel pathway involving PI3K and EMT transcription factor Zeb1.
Results
Gab2 is overexpressed in ovarian cancer
Gab2 gene amplification occurs in a subset of ovarian cancers with 11q13 amplification (Brown et al 2008, Shih Ie et al 2005). However, it is not known whether Gab2 gene is overexpressed in ovarian cancer. We first examined Gab2 mRNA expression in the publicly available database Oncomine™. Compared to normal ovary, Gab2 mRNA expression is significantly increased in ovarian serous cystadenocarcinoma (Figure 1a). Serous cystadenocarcinoma is the subtype of ovarian adenocarcinoma with relative poor survival rate (Kosary 2007).
Figure 1.
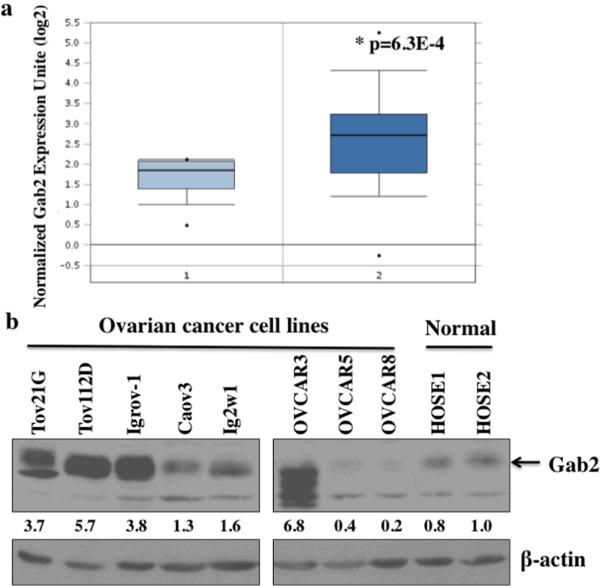
Gab2 expression is increased in ovarian cancer cell lines and tumors. (a) Gab2 RNA expression is increased in ovarian serous cystadenocarcinoma (2) (n=38) compared to normal ovary (1) (n=10). Data is downloaded from the TCGA Ovarian dataset in the Oncomine database (https://www.oncomine.org). (b) Gab2 protein is overexpressed in a subset of ovarian cancer cell line lines. Equal amount (50 μg) of protein lysates from primary human ovarian surface epithelial (HOSE) and ovarian cancer cell lines, Tov21G, Tov112D, Igrov1, Caov3, Ig2w1, OVCAR3, OVCAR5, OVCAR8, were immunoblotted with anti-Gab2 antibodies and reprobed with beta-actin (as loading control) antibodies. Numbers under the Gab2 immunoblot are relative Gab2 protein level normalized to beta-actin protein level quantified by densitometry.
In addition, we also analyzed Gab2 protein expression in ovarian cancer cell lines (Figure 1b). While Gab2 protein expression can be detected in two different normal human ovarian surface epithelial cell (HOSE) lines, Gab2 protein expression is significantly higher in 5 of the ovarian cancer cell lines including TOV21G, Tov112D, Igrov-1, OVCAR3, and Ig2w1. One interesting note, the size of Gab2 protein is significantly smaller although Gab2 is highly overexpressed in the OVCAR 3 cells. The smaller Gab2 in OVCAR3 probably represents the isoform b of Gab2 (Geneband accession # NP_036428), which is ~4 kDa smaller than the full length Gab2 protein. Ovarian cancer cell lines OVCAR5 and OVCAR8 express very low amounts of Gab2 protein compared to the HOSE lines (Figure 1b).
Gab2 overexpression induces phenotypes of EMT in ovarian cancer cells
To explore the functional significance of the enhanced Gab2 protein expression in ovarian cancer cells, we first examined the effects of Gab2 overexpression in OVCAR5 cells that express low level of Gab2 (see Figure 1b and Figure 4a). Although Gab2 overexpression did not enhance the growth of OVCAR5 cells in tissue culture plastic (data not shown), cells with Gab2 overexpression displayed scattering growth behavior compared to vector control cells, which were grown as epithelial colonies (Figure 2a). In addition, when grown in 3D condition with matrigel (Figure 2b), OVCAR5-vector control cells were generally grown into round and smooth colonies. In contrast, the colonies from OVAR5-Gab2 cells were generally disorganized and with protrusions extending into matrigel. These results suggest that Gab2 expression promotes migratory and invasive growth, signs of EMT, in ovarian cancer cells.
Figure 4.
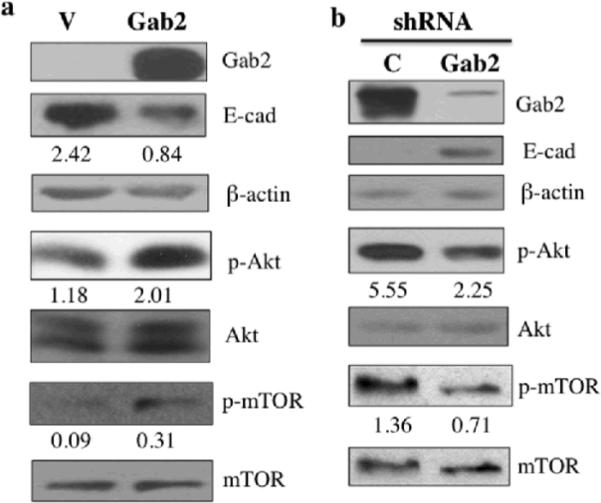
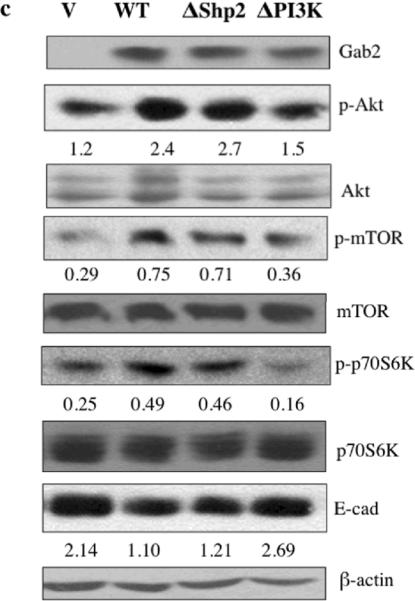
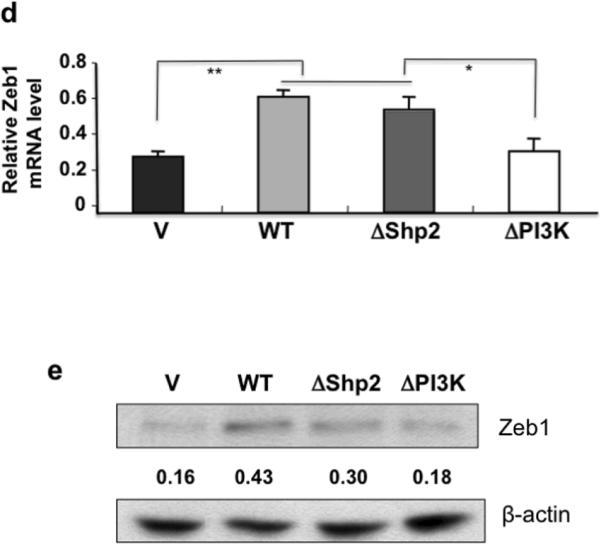
Gab2 expression regulates the activation of the PI3K-Zeb1 pathway and inhibits E-cadherin expression. (a) Gab2 overexpression inhibits E-cadherin protein expression and activates Akt and mTOR. Equal amounts of lysates from OVCAR5-Vector (V) and OVCAR5-Gab2 cells were immunoblotted with antibodies against Gab2, E-cadherin, p-Akt, p-mTOR, and reprobed with antibodies against Akt, mTOR, and beta-actin. (b) Knockdown of Gab2 enhances E-cadherin protein expression and inhibits Akt and mTOR activation. Equal amounts of lysates from TOV21G-C-shRNA and Gab2-shRNA cells were immunoblotted with indicated antibodies as described in (a). (c, d, e) Gab2-regulated PI3K pathway upregulates Zeb1 gene expression to downregulate E-cadherin expression. Equal amounts of lysates from OVCAR5 cells stably expressing vector (V), Gab2WT, and Gab2 mutants such as ΔShp2 (cannot bind Shp2), and ΔPI3K (cannot bind p85) were immunoblotted and reprobed with the indicated antibodies. Numbers under the E-cadherin (E-cad) blot are relative E-cad protein level normalized to beta-actin protein level quantified by densitometry (c). (d, e) Gab2 via interaction with PI3K up-regulates Zeb1 expression. Zeb1 mRNA expression was quantified by the real-time RT-PCR using total RNAs isolated from OVCAR5-vector, Gab2WT, ΔShp2, and ΔPI3K cells (d). Zeb1 protein expression was analyzed by immunoblotting using equal amounts of lysates from OVCAR5-V, -Gab2WT, -ΔShp2, and -ΔPI3K cells. Numbers under the E-cad and Zeb1 blots are relative E-cad and Zeb1 protein levels normalized to beta-actin protein level quantified by densitometry. Numbers under the phospho-protein blots are relative phospho-protein levels normalized to its corresponding total protein levels quantified by densitometry.
Figure 2.
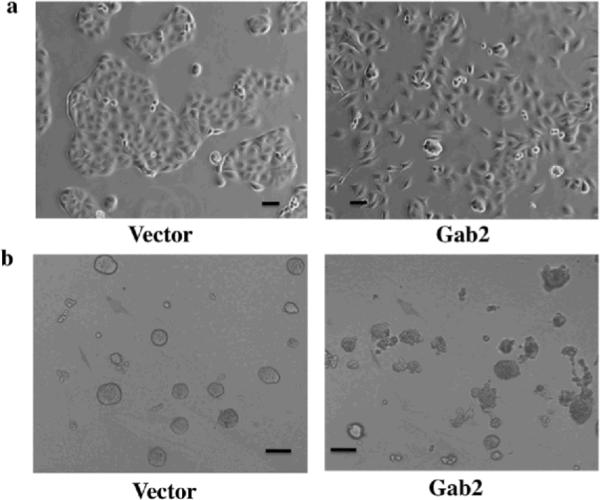
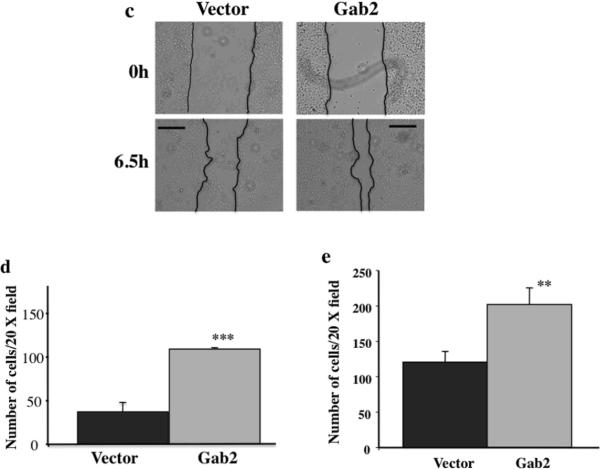
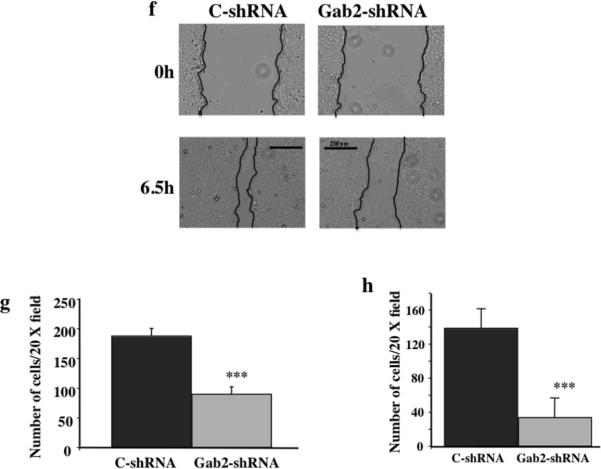
Gab2 expression enhances EMT-like behaviors in ovarian cancer cells. OVCAR5 cells stably expressing pBabe vector or pBabe-Gab2 were grown in tissue culture dishes for 2 days (a), or in 2% matrigel for 8 days (b), and photographed by phase contrast microscope. Note that Gab2 overexpression promotes cell scattering (a) and invasive cell growth (b). (c, d, e, f, g, h) Gab2 expression promotes migration and invasion of ovarian cancer cells. (c, d, e) Gab2 overexpression promotes cell migration and invasion in OVCAR5 cells. Confluent cultures of OVCAR5-Vector and -Gab2 cells were subjected to wound-healing assay (see Materials and methods). Cell images were taken immediately (0) and 6.5 hours later (c). Equal numbers of OVCAR5-Vector and -Gab2 cells were subjected to transwell migration assay (d) for 8 hours and invasion assay (e) for 20 hours (see Materials and methods). **p<0.01 and ***p<0.001. (f, g, h) Knockdown of Gab2 reduces cell migration and invasion in TOV21G cells. TOV21G cells infected with the pSuper-puro-retroviruses stably expressing the control shRNA (C) and Gab2-shRNAs were subjected to the wound healing (f), transwell migration (g), and invasion (h) and assays as described in (c), (d), and (e) respectively. **p<0.01. Shown are representative results from three independent experiments. Scale bar=50 μm in (a), 100 μm in (b), and 250 μm in (c, d).
To provide further evidence that Gab2 expression promotes migration and invasion of ovarian cancer cells, wound healing, transwell migration and invasion assays were used to assess the effects of Gab2 expression on the migratory behaviors. Compared to vector cells, OVCAR5 cells with Gab2 overexpression closed the wound-scratch quickly (Figure 2c) and migrated through the transwell membrane (Figure 2d) and invade through the matrigel faster (Figure 2e). Similarly, when Gab2 was overexpressed in OVCAR8, another cell line that expresses very low Gab2 protein (see Figure 1b and Figure S2a), cell invasion was enhanced significantly in OVCAR8-Gab2 cells compared to OVCAR8-V cells (Figure S1a). The levels of Gab2 overexpression in OVCAR5 and OVCAR8 cells are comparable to the endogenous Gab2 expression in ovarian cancer cell lines with high Gab2 expression (Figure 1b, Figure 4a, Figure S2a, and data not shown).
Conversely, we examined the effects of knocking down (KD) Gab2 expression by shRNA in TOV21G cells, which express higher level of Gab2 protein (see Figure 1b and Figure 4b). In contrast to cells with Gab2 overexpression, TOV21G cells with Gab2-shRNA showed impaired cell migration both in wound healing (Figure 2f) and transwell migration (Figure 2g) assays, and cell invasion through the matrigel (Figure 2h) compared to cells with control shRNA. Similarly, when Gab2 was knocked down by shRNA in Igrov-1, another cell line that expresses very high Gab2 protein (see Figure 1b and Figure S2b), cell invasion was reduced significantly in cells expressing Gab2-shRNA compared to control-shRNA (Figure S1b).
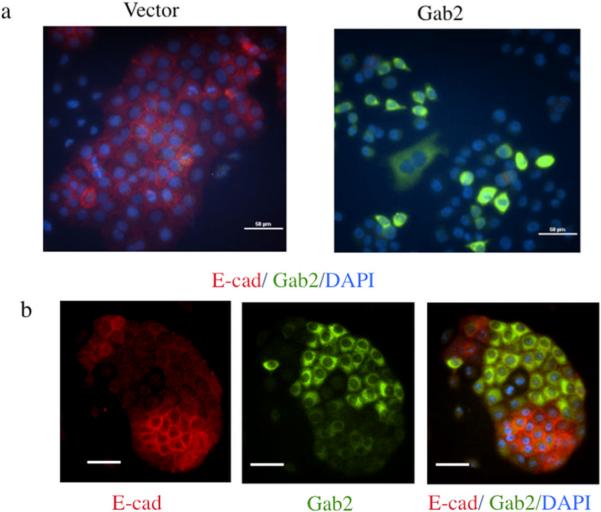
E-cadherin is a protein involved in cell-cell contacts in epithelial cells. E-cadherin expression is usually inhibited when epithelial cells are undergone EMT (Wells et al 2008). E-cadherin protein expression was examined by immunofluorescent staining in OVCAR5-vector and Gab2 cells (Figure 3). In OVCAR5-vector cells, E-cadherin staining was strong and mainly present in cell-cell contacts (Figure 3a left panel). In contrast, E-cadherin expression was barely detectable in OVCAR5-Gab2 cells (Figure 3a right panel). Most strikingly, in the same field of OVCAR5-Gab2 cells, cells with high E-cadherin staining had very low Gab2 expression. Conversely, cells with low E-cadherin staining had high Gab2 protein expression (Figure 3b). This result demonstrates that Gab2 overexpression suppresses E-cadherin expression in ovarian cancer cells. Together, these data indicate that Gab2 expression promotes EMT in ovarian cancer cells.
Figure 3.
Gab2 expression inhibits E-cadherin expression. OVCAR5-Vector (a) and OVCAR-Gab2 (a, b) cells were grown on glass cover slips for three days, fixed, and immuno-stained with anti-E-cadherin (E-cad) (Red) and anti-Gab2 (Green) antibodies, and DAPI (Blue) for nuclei. Scar bars=50 μm in (a) and (b).
Gab2 expression inhibits E-cadherin expression and promotes cell migration/invasion via activation of the PI3K-Zeb1 pathway
To further confirm that Gab2 expression affects E-cadherin protein expression, western blot analysis was used to assess E-cadherin protein expression in ovarian cancer cells with Gab2 overexpression or Gab2 KD. In OVCAR5 and OVCAR8 cells, Gab2 overexpression dramatically reduced E-cadherin protein expression compared to vector control (Figure 4a and Figure S2a). Conversely, in TOV21G and Igov-1 cells, Gab2-shRNA enhanced E-cadherin protein expression compared to control-shRNA (Figure 4b and Figure S2b).
To explore the mechanism by which Gab2 expression promotes EMT and down-regulation of E-cadherin expression, we first looked at the activation of PI3K, one of the key signaling pathways activated by Gab2 expression in different cell types (Gu and Neel 2003), in ovarian cancer cells. To examine activation of the PI3K pathway, we assessed the phosphorylation status of Akt, a direct target of PI3K lipid product, and mTOR, a downstream signaling enzyme by performing immunoblot using phospho-specific Akt and mTOR antibodies. While activation of Akt and mTOR were low in OVCAR5-vector cells, activation of Akt and mTOR was increased significantly in OVCAR5-Gab2 (Figure 4a). Similarly, Gab2 overexpression enhanced Akt activation in OVCAR8 cells (Figure S2a). Conversely, activation of Akt and mTOR was reduced by Gab2-shRNA compared to control-shRNA in TOV21G cells (Figure 4b). Likewise, Gab2 knockdown reduced Akt activation in Igrov-1 cells (Figure S2b).
To understand how Gab2 regulates E-cadherin expression and migration/invasion in ovarian cancer cells, we expressed Gab2 wild type (WT) and Gab2 mutants that are defective in activating the PI3K (ΔPI3K) and Shp2 (ΔShp2) pathways in OVCAR5 cells (Figure 4c). Gab2 WT and Gab2 ΔShp2 mutant both enhanced Akt, mTOR, and p70S6K activation and reduced E-cadherin protein expression compared to vector control. In contrast, Gab2 ΔPI3K mutant failed to increase the activation of Akt, mTOR, and p70S6K, and did not inhibit E-cadherin protein expression compared to vector control (Figure 4c). These data indicate that Gab2 expression activates the PI3K pathway that contributes to the inhibition of E-cadherin in ovarian cancer cells. The Shp-2/Erk pathway does not mediate Gab2 inhibition of E-cadherin expression.
We also compared the migratory abilities of Gab2 WT and mutant expressing OVCAR5 cells using transwell migration and invasion assays. We found that the Gab2 ΔPI3K expressing cells displayed impaired migration and invasion compared to Gab2 WT expressing cells (Figure S3a and S3b), indicating that Gab2 via activation of PI3K, promotes the migration and invasion of ovarian cancer cells.
Transcription factors such as Zeb1, Snail, Slug, and Twist are involved in the induction of EMT. These transcription factors inhibit E-cadherin transcription directly (Yang and Weinberg 2008). We asked whether Gab2 increases the expression of Zeb1, Snail, and Twist mRNAs. Our real-time RT-PCR analysis revealed that Zeb1 mRNA expression was enhanced significantly in OVCAR5-Gab2 cells compared to OVCAR5-vector cells (Figure 4e). In contrast, Snail, and Slug mRNA expression was not affected by Gab2 expression, and Twist mRNA was not expressed at all in OVCAR5 cells (data not shown). Similarly, we also found that Gab2 overexpression enhanced Zeb1 protein expression in OVCAR8 cells (Figure S2a). To examine how Gab2 induces Zeb1 expression, we examined the effects of Gab2 WT and Gab2 mutant expression on Zeb1 protein and mRNA expression in OVCAR5 cells by western blot (Figure 4d) and real-time RT-PCR (Figure 4e). While the expression of Zeb1 protein and mRNA were relatively low in vector control cells, both Zeb1 protein and mRNA expression were increased by more than 2 fold in Gab2 WT and Gab2 ΔShp2 mutant expressing cells. In contrast, expression of Gab2 ΔPI3K mutant did not enhance Zeb1 expression significantly compared to vector control. This data indicate that Gab2 via activation of the PI3K promotes Zeb1 gene expression.
To address whether Zeb1 expression mediates Gab2-invoked suppression of E-cadherin expression and enhancement of cell migration and invasion, we knocked down Zeb1 expression by two different Zeb1 shRNA constructs in OVCAR-Gab2 cells (Figure S4). E-cadherin protein expression was enhanced significantly in Zeb1 shRNA expressing cells compared to control shRNA cells (Figure S4a). In addition, invasion of OVCAR5-Gab2 cells was significantly reduced in Zeb1 shRNA expressing cells compared to control shRNA cells (Figure S4b). These date support a model by which Gab2 via activation of PI3K-Zeb1 pathway promotes cell migration/invasion and inhibits E-cadherin expression in ovarian cancer cells.
Pharmacological inhibitors of PI3K and mTOR inhibit Gab2-enhanced cell migration and invasion in ovarian cancer cells
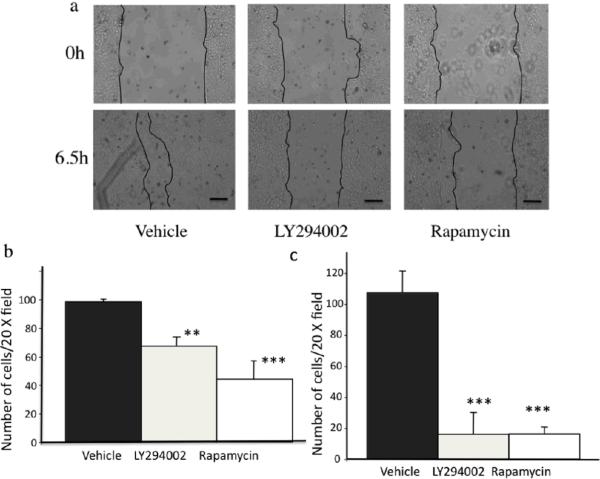
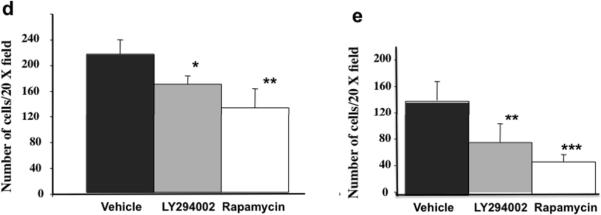
Gab2 expression via activation of PI3K promotes phenotypes of EMT. Small molecule inhibitors for PI3K and PI3K-regulated downstream signaling enzyme mTOR are being actively tested for cancer therapies (Engelman 2009). To find potential treatment for ovarian cancer with higher Gab2 expression, we tested whether LY294002, an effective PI3K inhibitor, and rapamycin, a specific mTOR inhibitor, can block Gab2-enhanced cell migration and invasion in ovarian cancer cells. Migration of OVCAR5-Gab2 cells was analyzed in the absence or presence of LY294002 or rapamycin using wound healing, transwell migration, and invasion assays (Figure 5). While OVCAR5-Gab2 cells migrated quickly in vehicle control in both assays, migration of the OVCAR5-Gab2 cells was significantly reduced in the presence of LY294002 or Rapamcyin in wound healing (Figure 5a) and transwell migration (Figure 5b). Likewise, invasion of the OVCAR5-Gab2 cells was also reduced by LY294002 or Rapamcyin treatment compared to vehicle control (Figure 5d). In addition, we also tested the effects of LY294002 and rapamcyin on cell migration and invasion in TOV21G cells, which express higher level of Gab2 protein (Figure 1b, lane 1) compared to OVCAR5 cells (Figure 1b, lane 7). While TOV21G cells migrated (Figure 5c) and invaded (Figure 5e) robustly in vehicle control, presence of LY294002 or rapamycin significantly impaired migration (Figure 5c) and invasion (Figure 5e) of TOV21G cells. Furthermore, we also examined the effects of GDC-0941, a more specific PI3K inhibitor currently used in clinical trial (Kong et al 2010), on OVAR5-Gab2 and Tov21G cells. Similar to LY294002, GDC-0941 treatment significantly reduced migration and invasion of OVCAR5-Gab2 (Figure S5a) and Tov21G (Figure S5b) cells compared to treatment with vehicle control. These data indicate that the PI3K/mTOR plays an important role in mediating Gab2-induced cell migration and invasion. Drugs that block activation of PI3K or mTOR may potentially be used to alleviate metastases in ovarian cancer patients with high Gab2 expression.
Figure 5.
Inhibitors of PI3K or mTOR reduces Gab2-enhanced cell migration and invasion in ovarian cancer cells. (a) Confluent OVCAR5-Gab2 cells were subjected to wound healing assay in the absence (vehicle) or presence of 10 μM LY294002, and 40 nM Rapamycin respectively for 6.5 hours. Scale bar= 100 μm in (a). OVCAR5-Gab2 (b, d) and TOV21G (c, e) cells were subjected to transwell migration (for 8 hours) (b, c) and invasion (for 20 hours) (d, e) assays in the absence (vehicle), or presence of 10 μM LY294002, or 40 nM rapamycin (see Materials and Methods). **p<0.01 and ***p<0.001. Shown are representative results from two independent experiments.
Discussion
In this manuscript, we demonstrate that Gab2 overexpression, via activation of the PI3K pathway, promotes migration and invasion, and inhibits E-cadherin expression in ovarian cancer cells. Although the role of Gab2 in promoting cell migration and invasion via activation of the PI3K pathway has been reported in melanoma, it is not clear how the Gab2-PI3K pathway regulates the migratory behaviors of melanoma cells (Horst et al 2009). We find that Gab2 via PI3K enhances the expression of Zeb1, a transcription factor associated with EMT, and down-regulates E-cadherin expression. The result of our study indicates that cell context-dependent pathway regulates the migratory behaviors of different types of cancer cells. Published studies including ours have shown that Gab2 via association with Shp-2 promotes mammary epithelial cells migration and invasion through multiple mechanisms. Gab2 via activation of Shp-2-Erk pathway promotes the invasion of MCF10A-ErbB2 cells (Bentires-Alj et al 2006) and migration of mammary tumor cells (Ke et al 2007). Gab2 via association with Shp2 also promotes migration of MCF10A cells through inhibition of RhoA activation (Abreu et al 2011). In addition, Gab2 over-expression changes the localization of E-cadherin without affecting E-cadherin expression in v-src expressing MCF10A cells (Bennett et al 2008). In ovarian cancer cells, we find that the Gab2-Shp2 pathway is not required for E-cadherin downregulation and increased Zeb1 expression (Figure 4c, d, e). In addition, Gab2 overexpression does not affect Erk activation (Data not shown), which is correlated to the lack of Shp2 interaction with Gab2 in OVCAR5 cells (Data not shown). Understanding the mechanism of how Gab2 activates different signaling pathways to promote cancer cell migration should provide new insights to design effective therapies to treat different metastatic cancers.
Our results indicate that Gab2 expression turns on the EMT program through activation of the PI3K-Zeb1 pathway, which inhibits E-cadherin expression in ovarian cancer cells. Activation of the PI3K pathway is involved in promoting EMT in different types of cancer cells (Larue and Bellacosa 2005). However, the mechanism by which the PI3K pathway inhibits E-cadherin is still not well-understood. A very recent paper showed that PI3K down-regulates E-cadherin expression through an increase in the expression of Slug and Twist transcription factors (Cheng et al 2010). However, Zeb1 and Snail expression were not affected by the enhanced PI3K activation in this system (Cheng et al 2010). In contrast, we find that Gab2 expression increases Zeb1 expression (Figure 4d and Figure S2a) without affecting the expression of Slug, Snail, and Twist (Data not shown). Thus, our findings represent the first example that activation of the PI3K pathway promotes Zeb1 expression to inhibit E-cadherin expression, the mechanism of which requires further study in the future.
Oncogenic activation of the PI3K pathway usually occurs through genetic mutations in cancer. Activating mutations in PIK3CA, the catalytic subunit of PI3K, have been found frequently (~30%) in colon, brain, and breast cancers (Bachman et al 2004, Samuels et al 2004). Loss of function mutations in PTEN, a PI3,4,5P lipid phosphatase, is prevalent in brain and prostate cancers (Li et al 1997). However, PIK3CA or PTEN mutations are not commonly founded in ovarian cancer (Agarwal et al 2010, Kolasa et al 2009), and PIK3CA gene amplification is more common (~25%) (Kolasa et al 2009). The NRG (heregulin)/ErbB3 signaling module is important to activate the PI3K pathway and promote cell growth in a subset of ovarian cancer (Sheng et al 2010). Our finding reveals that Gab2 overexpression contributes to activation of the PI3K pathway and promotes EMT in a subset of ovarian cancer. Interestingly, for the cell lines used in our study, OVCAR5 cells have no ErbB3 signaling and TOV21G and Igrov-1 cells express very low level of ErbB3 protein (Sheng et al 2010), suggesting that ErbB3 and Gab2 expression contributes to activation of the PI3K pathway in different subset of ovarian cancer. Considering LY294002, GDC-0941 or Rapamycin can reduce Gab2-enhanced cell migration and invasion of ovarian cancer cells, drugs that target the PI3K/mTOR pathway can be potentially used to treat Gab2-overexpressed ovarian cancer in combination with standard chemotherapy.
The fact that Gab2 expression promotes phenotypes of EMT in ovarian cancer cells suggests that ovarian tumors with high Gab2 expression may possess higher metastatic potential in patients. It will be important to determine whether Gab2 protein expression has any prognostic value for ovarian cancer patients in future study. mTOR inhibitor such as Temsirolimus has shown signs of efficacy in treating ovarian cancers in clinical trials (unpublished data, K.B.). It will be interesting to examine whether Gab2 expression status in ovarian tumors can predict response to Temsirolimus treatment.
Materials and methods
Cell Culture and reagents
Two primary human ovarian surface epithelial cell lines (HOSE) were derived from cells obtained from patients with ovarian cancer under protocols approved by the Dana-Farber/Harvard Cancer Center Institutional Review Board (DFHCC IRB) and the Partners Human Research Committee. Consent from patients was obtained as per IRB guidelines (Sheng et al 2010). Ovarian cancer cell lines OVCAR3, OVCAR5, OVCAR8, Caov3, TOV21G, TOV112D, Ig2w-1, and Igrov-1 were as described (Sheng et al 2010). All of the ovarian cell lines were cultured in RPMI-1640 medium (Sigma) supplemented with 10% heat-inactivated fetal bovine serum (FBS) (Hyclone), 1× Glutamine, 100 units/ml penicillin and 100μg/ml streptomycin (Sigma). 293T cells were cultured in Dulbecco's modified Eagle's medium (DMEM) supplemented with 10% heat-inactivated FBS, 1mM sodium pyruvate, 100 units/ml penicillin and 100μg/ml streptomycin (Hyclone). For cells grown in 3D culture condition, OVCAR5 cells were seeded as single cells over a solidified layer (40 μl) of growth factor-reduced Matrigel (BD Bioscience) in an eight-well glass chamber slide (Falcon). Cells were cultured in RPMI-1640 supplemented with 2% Matrigel, 2% FBS, and 100 IU/ml of penicillin and 100 μg/ml of streptomycin, and were refed every 3 days. All cell lines were cultured in tissue incubator with 5% CO2. LY294002, Rapamycin, and GDC-0941 were purchased from LC Laboratory.
Plasmids, retrovirus and lentivirus production
Retroviral expression vector pBabe-puro, and pBabe-puro containing Gab2 wild type (WT), and Gab2 mutants, ΔShp2, and ΔPI3K plasmids were as described (Bentires-Alj et al 2006). Control-shRNA construct and Gab2 shRNA construct targeting human Gab2 cDNA sequence were generated by inserting a double-stranded oligonucleotide into retroviral pSuper-puro vector (Brummelkamp et al 2002). The Gab2 shRNA sequence is 5'-GTGAGAACGATGAGAAATA-3', and the control-shRNA sequence is GTGAcAtCcATGtGAAAat, which is the Gab2 shRNA sequence containing six point mutations. PLKO.1-puro vector expressing control shRNA (Sigma Cat# SHC001) and two different human Zeb1 shRNAs (Sigma TRC clone# 17565 and 17567) were purchased from the Functional Genomics Facility at University of Colorado Boulder. For the production of VSV-G pseudotyped retrovirus, 293T cells (8×10⁶) were cotransfected with 10 μg retroviral plasmid together with three packaging plasmids, 5 μg pCMV-VSV-G, 5 μg JK3, and 5 μg pCMV-TAT2 as described (Battini et al 1999). Retroviral supernatants were collected at 48 and 72 hours post-transfection, and filtered through 0.45 μm low protein-binding sterile filter. PLKO.1 lentiviruses were produced according to the manufacture instruction (Sigma).
Retroviral and lentiviral Infection of Cells
Cells were incubated with appropriate retroviral or lentiviral supernatants and 8 μg/ml of polybrene (Sigma) for 16 hours. Thirty-six hours post-infection, stable pools of cells were selected with 1.5 μg/ml puromycin (Sigma), except for Igrov-1 cells that need 2.5 μg/ml of puromycin, for 3 days before used for experiments. For each construct, three different stable pools of cells from different retroviral infections were used in our experiments, and gave the same results.
Antibodies and immunoblotting
Gab2 anti-serum was generated against the C-terminal region of mouse Gab2 protein (Gu et al 1998). Anti-phospho-Akt (S473) (p-Akt), phospho-mTOR (S2448) (p-mTOR), phospho-p70S6K (T389) (p- p70S6K), mTOR, and p70S6K rabbit antibodies were from Cell Signaling Technology, Inc. Anti-Akt1/2/3 antibodies were purchased from Santa Cruz Biotechnology, Inc. Anti-beta actin mouse monoclonal antibody was from Sigma. Anti-E-cadherin mouse monoclonal antibody (Cat# 610181) was from BD-Bioscience. Anti-Zeb1 rabbit serum was a kind gift from Dr. Jennifer Richer (University of Colorado Denver) and Dr. Doug Darling (University of Kentucky). For western blot, cells were directly lysed in 1× SDS sample buffer. Protein samples were separated by SDS-PAGE, transferred to Immobilon-P membrane (Millipore Inc.), immunoblotted using the appropriate primary and the HRP-conjugated secondary antibodies, and detected by enhanced chemiluminescence. Western blot data shown in the paper are representatives from three independent experiments. The intensities of bands in western blots were quantified by densitometry analysis using the NIH Image J software.
Immunofluorescent staining
OVCAR5 cells were grown on the glass-cover slips for 3 days, fixed and permeabilized in cold methanol for 10 minutes at −20°C. Cells were then incubated with anti-Gab2 rabbit antibodies (1:400) (Millipore, Cat#06-967), anti-E-cadherin monoclonal antibody (1:500) and 4',6-diamidino-2-phenylindole (DAPI) (Invitrogen), followed by incubation with Alexa Fluor 488 goat anti-rabbit and Alexa Fluor 546 goat anti-mouse IgGs (Molecular Probe), and mounted with Prolong Gold antifade reagent (Invitrogen). Fluorescent images were captured under the 20× objective lens using the Nikon Eclipse Ti-S/L 100 microscope system.
Quantitative reverse transcription-PCR (qRT-PCR)
Total RNAs (1 μg) isolated from cells using Trizol Reagent (Invitrogen) were treated with DNase I and reverse-transcribed into cDNA using Superscript III (Invitrogen). Quantitative RT-PCR was performed on 7500 fast real-time PCR systems (Applied Biosystems) using Power SYBR Green PCR Master Mix (Applied Biosystems). PCR primers were: human Zeb1 gene forward primer 5'-GATGATGAATGCGAGTCAGATGC -3', reverse primer 5'-ACAGCAGTGTCTTGTTGTTGTAG -3', whose sequence information was chosen from the Primerbank (http://pga.mgh.harvard.edu/primerbank) (Spandidos et al 2010); human beta-actin gene forward primer 5'-AAATCTGGCACCACACCTTC-3', reverse primer 5'-CAGAGGCGTACAGGGATAGC-3'. The specificities of the Zeb1 and beta-actin primers for real-time PCR were verified by running the PCR products in the agarose gel electrophoresis. The Zeb1 PCR results were normalized to beta-actin and expressed as relative mRNA level.
Cell migration and invasion assays
Wound healing assay
The same size wounds were generated on confluent cultures of OVCAR5 or TOV21G cells using a 1 ml pipette tip. Cells were allowed to heal for different lengths of time in the absence or presence of LY294002 (10 μM) or rapamycin (40 nM) (LC laboratory). Images of the wounds at different time points were captured using the Nikon Eclipse Ti-S/L 100 microscope system.
Transwell migration assay
OVCAR5 (4×10⁵/ml), or TOV21G (2×10⁵/ml) cells were resuspended in RPMI medium alone. Cell suspension (100 μl) was added to the top chamber of transwell (6.5 mm in diameter and 8 μm pore size) (Costar), and 400 μl of RPMI medium containing 10% FBS were added to the bottom chamber of transwell.
Transwell invasion assay
The upper side of the transwell was coated with 100 μl of 1mg/ml matrigel diluted in RPMI at 37°C for 2 hours, and rinsed gently wash RPMI once. One hundred μl of OVCAR5 and Igrov1 (10×105/ml) or TOV21G and OVCAR8 (6×10⁵/ml) cells resuspended in RPMI +0.5% FBS were added to the top chamber of the matrigel coated transwell and 400 μl of RPMI medium containing 10% FBS were added to the bottom chamber. DMSO (vehicle), LY294002 (10 μM), Rapamycin (40 nM), or GDC-0941 (0.8 μM) was added to both the top and bottom of transwell.
Quantification of the transwell migration and invasion assays
After incubation for different lengths of time at 37°C, transwells were fixed in 70% ethanol for 20 minutes. Non-migrated cells in the upper side of the transwell membrane were removed completely by cotton swab. Cells were permeabilized in 0.3% triton X-100 in phosphate buffered saline (PBS) for 5 minutes, and stained with 5 μg/ml DAPI for 20 minutes. Nuclei on bottom side of the transwell membrane were visualized under UV light by the Nikon Eclipse Ti-S/L 100 microscope. Nuclei images in five random 20× fields of cell images were captured and quantified using the NIS-Element software (Nikon). The mean of the nuclei was determined for each transwell. The experiments were repeated at least three times.
Statistical analysis
Unpaired Student's t-test was used for statistical analysis using the Prism 4 software (GraphPad). * p<0.05, ** p<0.01, and *** p<0.001.
Supplementary Material
Acknowledgments
We thank Dr. Sam Mok for the HOSE lines. This work is supported by the Department of Pathology, University of Colorado, Anschutz Medical Campus and in part by the National Institutes of Health grant R01-AI51612 (to H.G).
Footnotes
Conflict of Interest The authors declare no conflict of interest.
Oncomine™ (Compendia Bioscience, Ann Arbor, MI) was used for analysis and visualization.
References
- Abreu MT, Hughes WE, Mele K, Lyons RJ, Rickwood D, Browne BC, et al. Gab2 regulates cytoskeletal organization and migration of mammary epithelial cells by modulating RhoA activation. Mol Biol Cell. 2011;22:105–116. doi: 10.1091/mbc.E10-03-0185. [DOI] [PMC free article] [PubMed] [Google Scholar]
- Agarwal R, Carey M, Hennessy B, Mills GB. PI3K pathway-directed therapeutic strategies in cancer. Curr Opin Investig Drugs. 2010;11:615–628. [PubMed] [Google Scholar]
- Bachman KE, Argani P, Samuels Y, Silliman N, Ptak J, Szabo S, et al. The PIK3CA gene is mutated with high frequency in human breast cancers. Cancer Biol Ther. 2004;3:772–775. doi: 10.4161/cbt.3.8.994. [DOI] [PubMed] [Google Scholar]
- Bast RC, Jr., Hennessy B, Mills GB. The biology of ovarian cancer: new opportunities for translation. Nat Rev Cancer. 2009;9:415–428. doi: 10.1038/nrc2644. [DOI] [PMC free article] [PubMed] [Google Scholar]
- Battini JL, Rasko JE, Miller AD. A human cell-surface receptor for xenotropic and polytropic murine leukemia viruses: possible role in G protein-coupled signal transduction. Proc Natl Acad Sci U S A. 1999;96:1385–1390. doi: 10.1073/pnas.96.4.1385. [DOI] [PMC free article] [PubMed] [Google Scholar]
- Bennett HL, Brummer T, Jeanes A, Yap AS, Daly RJ. Gab2 and Src co-operate in human mammary epithelial cells to promote growth factor independence and disruption of acinar morphogenesis. Oncogene. 2008;27:2693–2704. doi: 10.1038/sj.onc.1210928. [DOI] [PubMed] [Google Scholar]
- Bentires-Alj M, Gil SG, Chan R, Wang ZC, Wang Y, Imanaka N, et al. A role for the scaffolding adapter GAB2 in breast cancer. Nat Med. 2006;12:114–121. doi: 10.1038/nm1341. [DOI] [PubMed] [Google Scholar]
- Bocanegra M, Bergamaschi A, Kim YH, Miller MA, Rajput AB, Kao J, et al. Focal amplification and oncogene dependency of GAB2 in breast cancer. Oncogene. 2010;29:774–779. doi: 10.1038/onc.2009.364. [DOI] [PubMed] [Google Scholar]
- Brown LA, Kalloger SE, Miller MA, Shih Ie M, McKinney SE, Santos JL, et al. Amplification of 11q13 in ovarian carcinoma. Genes Chromosomes Cancer. 2008;47:481–489. doi: 10.1002/gcc.20549. [DOI] [PubMed] [Google Scholar]
- Brummelkamp TR, Bernards R, Agami R. Stable suppression of tumorigenicity by virus-mediated RNA interference. Cancer Cell. 2002;2:243–247. doi: 10.1016/s1535-6108(02)00122-8. [DOI] [PubMed] [Google Scholar]
- Brummer T, Schramek D, Hayes VM, Bennett HL, Caldon CE, Musgrove EA, et al. Increased proliferation and altered growth factor dependence of human mammary epithelial cells overexpressing the Gab2 docking protein. J Biol Chem. 2006;281:626–637. doi: 10.1074/jbc.M509567200. [DOI] [PubMed] [Google Scholar]
- Cheng JC, Auersperg N, Leung PC. Oncogene. 2010. Inhibition of p53 induces invasion of serous borderline ovarian tumor cells by accentuating PI3K/Akt-mediated suppression of E-cadherin. [DOI] [PubMed] [Google Scholar]
- Daly RJ, Gu H, Parmar J, Malaney S, Lyons RJ, Kairouz R, et al. The docking protein Gab2 is overexpressed and estrogen regulated in human breast cancer. Oncogene. 2002;21:5175–5181. doi: 10.1038/sj.onc.1205522. [DOI] [PubMed] [Google Scholar]
- Engelman JA. Targeting PI3K signalling in cancer: opportunities, challenges and limitations. Nat Rev Cancer. 2009;9:550–562. doi: 10.1038/nrc2664. [DOI] [PubMed] [Google Scholar]
- Feeley KM, Wells M. Precursor lesions of ovarian epithelial malignancy. Histopathology. 2001;38:87–95. doi: 10.1046/j.1365-2559.2001.01042.x. [DOI] [PubMed] [Google Scholar]
- Fleuren ED, O'Toole S, Millar EK, McNeil C, Lopez-Knowles E, Boulghourjian A, et al. Overexpression of the oncogenic signal transducer Gab2 occurs early in breast cancer development. Int J Cancer. 2010;127:1486–1492. doi: 10.1002/ijc.25172. [DOI] [PubMed] [Google Scholar]
- Gu H, Pratt JC, Burakoff SJ, Neel BG. Cloning of p97/Gab2, the major SHP-2 binding protein in hematopoietic cells, reveals a novel pathway for cytokine-induced gene activation. Mol Cell. 1998;2:729–740. doi: 10.1016/s1097-2765(00)80288-9. [DOI] [PubMed] [Google Scholar]
- Gu H, Neel BG. The “Gab” in signal transduction. Trends Cell Biol. 2003;13:122–130. doi: 10.1016/s0962-8924(03)00002-3. [DOI] [PubMed] [Google Scholar]
- Horst B, Gruvberger-Saal SK, Hopkins BD, Bordone L, Yang Y, Chernoff KA, et al. Gab2-mediated signaling promotes melanoma metastasis. Am J Pathol. 2009;174:1524–1533. doi: 10.2353/ajpath.2009.080543. [DOI] [PMC free article] [PubMed] [Google Scholar]
- Jemal A, Tiwari RC, Murray T, Ghafoor A, Samuels A, Ward E, et al. Cancer statistics, 2004. CA Cancer J Clin. 2004;54:8–29. doi: 10.3322/canjclin.54.1.8. [DOI] [PubMed] [Google Scholar]
- Karst AM, Levanon K, Drapkin R. Modeling high-grade serous ovarian carcinogenesis from the fallopian tube. Proc Natl Acad Sci U S A. 2011;108:7547–7552. doi: 10.1073/pnas.1017300108. [DOI] [PMC free article] [PubMed] [Google Scholar]
- Ke Y, Wu D, Princen F, Nguyen T, Pang Y, Lesperance J, et al. Role of Gab2 in mammary tumorigenesis and metastasis. Oncogene. 2007;26:4951–4960. doi: 10.1038/sj.onc.1210315. [DOI] [PubMed] [Google Scholar]
- Kolasa IK, Rembiszewska A, Felisiak A, Ziolkowska-Seta I, Murawska M, Moes J, et al. PIK3CA amplification associates with resistance to chemotherapy in ovarian cancer patients. Cancer Biol Ther. 2009;8:21–26. doi: 10.4161/cbt.8.1.7209. [DOI] [PubMed] [Google Scholar]
- Kong D, Dan S, Yamazaki K, Yamori T. Inhibition profiles of phosphatidylinositol 3-kinase inhibitors against PI3K superfamily and human cancer cell line panel JFCR39. Eur J Cancer. 2010;46:1111–1121. doi: 10.1016/j.ejca.2010.01.005. [DOI] [PubMed] [Google Scholar]
- Kosary C. Chapter 16: Cancers of the Ovary in SEER Survival Monograph: Cancer Survival Among Adults: US SEER Program, 1988–2001, Patient and Tumor Characteristics. NCI; Bethesda, MD: 2007. pp. 133–144. NIH Pub. No. 07-6215. [Google Scholar]
- Kurman RJ, Shih Ie M. The origin and pathogenesis of epithelial ovarian cancer: a proposed unifying theory. Am J Surg Pathol. 2010;34:433–443. doi: 10.1097/PAS.0b013e3181cf3d79. [DOI] [PMC free article] [PubMed] [Google Scholar]
- Larue L, Bellacosa A. Epithelial-mesenchymal transition in development and cancer: role of phosphatidylinositol 3' kinase/AKT pathways. Oncogene. 2005;24:7443–7454. doi: 10.1038/sj.onc.1209091. [DOI] [PubMed] [Google Scholar]
- Levanon K, Crum C, Drapkin R. New insights into the pathogenesis of serous ovarian cancer and its clinical impact. J Clin Oncol. 2008;26:5284–5293. doi: 10.1200/JCO.2008.18.1107. [DOI] [PMC free article] [PubMed] [Google Scholar]
- Li J, Yen C, Liaw D, Podsypanina K, Bose S, Wang SI, et al. PTEN, a putative protein tyrosine phosphatase gene mutated in human brain, breast, and prostate cancer. Science. 1997;275:1943–1947. doi: 10.1126/science.275.5308.1943. [DOI] [PubMed] [Google Scholar]
- Luo J, Manning BD, Cantley LC. Targeting the PI3K-Akt pathway in human cancer: rationale and promise. Cancer Cell. 2003;4:257–262. doi: 10.1016/s1535-6108(03)00248-4. [DOI] [PubMed] [Google Scholar]
- Samuels Y, Wang Z, Bardelli A, Silliman N, Ptak J, Szabo S, et al. High frequency of mutations of the PIK3CA gene in human cancers. Science. 2004;304:554. doi: 10.1126/science.1096502. [DOI] [PubMed] [Google Scholar]
- Sheng Q, Liu X, Fleming E, Yuan K, Piao H, Chen J, et al. An activated ErbB3/NRG1 autocrine loop supports in vivo proliferation in ovarian cancer cells. Cancer Cell. 2010;17:298–310. doi: 10.1016/j.ccr.2009.12.047. [DOI] [PMC free article] [PubMed] [Google Scholar]
- Shih Ie M, Kurman RJ. Ovarian tumorigenesis: a proposed model based on morphological and molecular genetic analysis. Am J Pathol. 2004;164:1511–1518. doi: 10.1016/s0002-9440(10)63708-x. [DOI] [PMC free article] [PubMed] [Google Scholar]
- Shih Ie M, Sheu JJ, Santillan A, Nakayama K, Yen MJ, Bristow RE, et al. Amplification of a chromatin remodeling gene, Rsf-1/HBXAP, in ovarian carcinoma. Proc Natl Acad Sci U S A. 2005;102:14004–14009. doi: 10.1073/pnas.0504195102. [DOI] [PMC free article] [PubMed] [Google Scholar]
- Spandidos A, Wang X, Wang H, Seed B. PrimerBank: a resource of human and mouse PCR primer pairs for gene expression detection and quantification. Nucleic Acids Res. 2010;38:D792–799. doi: 10.1093/nar/gkp1005. [DOI] [PMC free article] [PubMed] [Google Scholar]
- Tan DS, Agarwal R, Kaye SB. Mechanisms of transcoelomic metastasis in ovarian cancer. Lancet Oncol. 2006;7:925–934. doi: 10.1016/S1470-2045(06)70939-1. [DOI] [PubMed] [Google Scholar]
- Tan DS, Ang JE, Kaye SB. Ovarian cancer: can we reverse drug resistance? Adv Exp Med Biol. 2008;622:153–167. doi: 10.1007/978-0-387-68969-2_13. [DOI] [PubMed] [Google Scholar]
- Wells A, Yates C, Shepard CR. E-cadherin as an indicator of mesenchymal to epithelial reverting transitions during the metastatic seeding of disseminated carcinomas. Clin Exp Metastasis. 2008;25:621–628. doi: 10.1007/s10585-008-9167-1. [DOI] [PMC free article] [PubMed] [Google Scholar]
- Wohrle FU, Daly RJ, Brummer T. Function, regulation and pathological roles of the Gab/DOS docking proteins. Cell Commun Signal. 2009;7:22. doi: 10.1186/1478-811X-7-22. [DOI] [PMC free article] [PubMed] [Google Scholar]
- Yang J, Weinberg RA. Epithelial-mesenchymal transition: at the crossroads of development and tumor metastasis. Dev Cell. 2008;14:818–829. doi: 10.1016/j.devcel.2008.05.009. [DOI] [PubMed] [Google Scholar]
Associated Data
This section collects any data citations, data availability statements, or supplementary materials included in this article.


