

Abstract
CONTEXT
Depression is a treatable illness that disproportionately places older adults at increased risk for mortality.
OBJECTIVE
We sought to examine whether there are patterns of course of depression severity among older primary care patients that are associated with increased risk for mortality.
DESIGN AND SETTING
Our study was a secondary analysis of data from a practice-based randomized controlled trial within 20 primary care practices in New York, New York, and Philadelphia and Pittsburgh, Pennsylvania.
PARTICIPANTS
The study sample consisted of 599 adults aged 60 years and older recruited from primary care settings. Participants were identified though a two-stage, age-stratified (60-74; 75+) depression screening of randomly sampled patients. Severity of depression was assessed using the 24-item Hamilton Depression Rating Scale (HDRS).
MEASUREMENTS
Longitudinal analysis via general curve mixture modeling was carried out to classify patterns of course of depression severity across 12 months. Vital status at 5 years was ascertained via the National Death Index Plus.
RESULTS
Three patterns of change in course of depression severity over 12 months were identified: (1) persistent depressive symptoms, (2) high but declining depressive symptoms, (3) low and declining depressive symptoms. After a median follow-up of 52.0 months, 114 patients had died. Patients with persistent depressive symptoms were more likely to have died compared with patients with a course of high but declining depressive symptoms (adjusted hazard ratio 2.32, 95% confidence interval (CI) [1.15, 4.69]).
CONCLUSIONS
Persistent depressive symptoms signaled increased risk of dying in older primary care patients, even after adjustment for potentially influential characteristics such as age, smoking status, and medical comorbidity (244 words).
Keywords: Aged, Primary health care, Geriatric depression, Mortality
INTRODUCTION
Depression is a treatable illness that disproportionately places older adults at increased risk for mortality [1-5]. While some elderly patients may respond quickly to treatment, other elderly patients may have a slower road to recovery [6, 7]. Primary care occupies a strategic position in the evaluation and treatment of depression in late life [8-12] and enhancing primary care depression management for patients most at risk of poor outcomes would be a promising use of health care resources [13]. There is a focus on syndromes such as major depressive disorder (MDD) but a realization that MDD describes a clinically diverse set of people. The National Institute of Mental Health Strategic Plan states the “developmental trajectory of illnesses opens the possibility that we could intervene and alter trajectories” [14]. Experienced clinicians often follow and use course to guide the next steps in therapy. A further understanding of the depression as determined by evolving patterns of depressive symptoms and whether such patterns are related to increased risk of mortality among elderly primary care patients would be a key step in intervening to improve treatment and outcomes of late life depression.
Although many prospective studies from a variety of venues have shown that depression is associated with increased risk of death [1-5, 15-18], only a few prospective studies have attempted to examine longitudinal depression data and mortality using more than two time points in order to examine change [19-22]. Our work differs from prior work in the following ways. The prior studies on course of depression and mortality focus on community settings, but primary care is an important pathway to mental health care in community settings and remains important for the treatment of psychiatric disorders in the elderly [23]. In addition, previous work has focused on symptoms of depression and has not employed standardized interviews keyed to the diagnostic criteria for depression. Therefore, we do not know how many participants in previous work were clinically depressed. Third, our study used an innovative technique for longitudinal data analysis, the general curve mixture model, which is well suited to the study of individual differences in development and change over time [24]. The general curve mixture model enables us to classify patients into clinically meaningful categories for understanding the heterogeneity of course of depression. This technique identifies different subgroups of patients based on their underlying trends and whether membership in a subgroup signals increased risk for death during the follow-up interval.
Studying course and disease outcomes has provided important insights into prediction of prostate cancer and alcohol dependence. Muthén and colleagues have pioneered in models for prediction of risk for prostate cancer from prostate specific antigen course subtypes [25-27] and in predicting risk for alcohol dependence in developmental patterns of alcohol use [28-31]. More recently, similar models have been used to examine heterogeneity in the development of clinical response after the initiation of antidepressants among adults with major depression [32]. Our project brings similar strategies to the evaluation of patterns of depressive symptoms and the outcome of mortality among older adults.
Our purpose was to further understand 1) course of depressive symptoms through the course of depression severity over 12 months among older adults, and 2) whether such patterns of depressive symptoms were related to death at 5 years. To accomplish these goals, we employed data from the multi-site, randomized trial, PROSPECT (Prevention of Suicide in Primary Care Elderly: Collaborative Trial). The study intervention was implemented at the practice level and involved a depression care manager working with physicians to provide algorithm-based care [33]. In this paper, we focus on the association of patterns of depressive symptoms with mortality, independent of several potentially influential covariates, over the course of a 5-year follow-up interval. We hypothesized that older primary care patients with persistent depressive symptoms over 12 months would be at high risk for mortality at 5 years.
METHODS
Study design
The study was conducted in 20 primary care practices located in greater New York City, Philadelphia, and Pittsburgh from May 1999 to August 2001. Practices ranged in size (solo to medium sized), setting (rural, suburban and urban), population type (including two serving primarily African-American patients), and affiliation (16 community-based and 4 academic practices). The study used a two-stage sampling design to generate a representative sample of primary care patients with the DSM-IV diagnosis of major depression or minor depression. Minor depression was defined as depression meeting at least three DSM-IV criteria, having a 24-item Hamilton Depression Rating Scale (HDRS) score of 10 or higher, and persisting for at least one month. An age-stratified (60-74 years, over 75 years), random sample was obtained of patients with an appointment with their primary care physician within 2 weeks. Patients were interviewed in person at the primary care practices. Patients who gave oral consent were screened for depressive symptoms using the Centers for Epidemiologic Studies Depression scale (CES-D) [34]. All patients with CES-D above 20 as well as a 5% random sample of patients with lower scores were invited to enter the study. The purpose of the 5% sample was to assess for “false negative” cases of screened depression. To increase the sensitivity of the screening procedure, patients with CES-D <20 and not selected for the 5% random sample were also recruited if they reported history of depression or antidepressant treatment. Details of the study design of the PROSPECT Study are available elsewhere [33, 35]. Our study was a secondary analysis of the PROSPECT Study. The study protocols were approved by the Institutional Review Boards of Cornell University, University of Pittsburgh, and University of Pennsylvania Schools of Medicine.
Measurement strategy
Sociodemographic characteristics
We used standard questions to obtain information from the patients on baseline age, sex, self-reported ethnicity, education, marital status, and smoking status (according to tobacco use within the past 6 months).
Depression diagnoses
Trained research assistants (Ph.D., M.A. or experienced B.A. level) assigned depression diagnoses to patients using the Structured Clinical Interview for Axis I DSM-IV Diagnoses (SCID) [36] at baseline. Study psychiatrists reviewed all the SCID ratings. Severity of depression was assessed using the 24-item Hamilton Depression Rating Scale (HDRS) [37] at baseline, 4 months, 8 months, and 12 months. HDRS scores were analyzed as a continuous variable. We used the Scale for Suicidal Ideation (SSI) [38] to measure presence and intensity of current suicidal ideation at baseline. Scores of 0 indicated no suicidal ideation, while scores ≥1 on items 1-3 indicated passive suicidal ideation.
Medical comorbidity
Persons were classified as having a medical comorbidity by self-report at baseline. The questionnaire used was based on the Charlson Comorbidity Index, supplemented by questions about the common disabling conditions of late life [39].
Mini-Mental State Examination
Baseline cognitive status was assessed with the Mini-Mental State Examination (MMSE) which is a short standardized mental status examination that has been widely employed for clinical and research purposes [40]. The MMSE assesses orientation to time and place, registration, memory, attention and concentration, praxis, and constructional and language capacity.
Ascertainment of vital status
Vital status in this investigation was based on follow-up of patients employing the National Center for Health Statistics (NCHS) National Death Index (NDI Plus) [41]. Because obtaining vital status requires that we provide personally identifiable information to the NCHS for NDI searches, confidentiality safeguards warrant discussion here. We did not transmit any PROSPECT study data (e.g., information about depression status, physical disorders, or functional status) with identifying data, nor did we transmit identifying data via e-mail. Upon obtaining vital status data, the University of Pennsylvania Data Core sent the data to the sites for verification. Study sites then sent the data file -- stripped of any identifying data -- to the University of Pennsylvania Data Core for final production of the study data linked to vital status for analysis. The time frame for the ascertainment of vital status was the period of five years from overall commencement of the PROSPECT study.
Analytic strategy
We employ a two-stage approach to modeling patterns of depressive symptoms and mortality. In the first phase we used a general curve mixture model (GCMM) [24] to create latent classes corresponding to subtypes of depression based on course of depressive symptoms (measured by HDRS) across the first 12 months of the study (baseline, 4, 8, and 12 months). The model for the course of depressive symptoms included random intercepts and slopes to account for within-subject correlations and separate fixed-effect intercepts and fixed-effects slopes for time within each subtype (i.e. within each latent class). We compared the results of this longitudinal linear model to models that accommodated nonlinear changes in depression across time. The structure of the subtypes was similar across the different models, so we base our results on the more parsimonious linear model. Clustering by practice and pairs of practice was negligible and did not affect the analysis. In presenting the results of the latent class model, each respondent was assigned to their most likely class under the GCMM as indicated by the posterior probabilities of class membership.
In the second phase, we carried out survival analysis adjusting for within-practice clustering (27). The Cox proportional hazards model for clustered data was used to explore the effect of the subtypes of depression based on 12 months of depressive symptoms on survival. We related the subtypes of depression based on 12 months of depressive symptoms to the vital status at 5 years using hazard ratios. We sorted patients into the subtype corresponding to the highest posterior probability from the GCMM. These assignments were then used in the analysis of associations with vital status at 5 years. Survival curves were prepared using the method of Kaplan and Meier [42] to illustrate the mortality of each trajectory based on 12 months of depressive symptoms. We began by exploring potential confounding variables using univariate models with baseline characteristics as predictors of time to death. Our final model included influential covariates identified by their association (p < 0.05) with the outcome of interest, time to death. The final model included terms to adjust for baseline age, sex, education, smoking status, cardiovascular disease, stroke, diabetes, cancer, cognition, and suicidal ideation as well as for type of practice (intervention versus usual care).
The choice of the number of classes was determined through examination of fit indices as well as for clinically interpretable results. The Akaike Information Criteria (AIC) [43] and Bayesian Information Criteria (BIC) [44] were used to assess the model goodness of fit, and the Rubin-Lo-Mendell test [45] was used to determine if additional classes added further information to the model. The GCMM was fitted using Mplus version 5.1 and other analyses were conducted in SAS version 9.2.
RESULTS
Study sample
The CONSORT flow diagram for the PROSPECT trial has been published elsewhere [33]. Our study sample included 599 depressed patients, of whom 396 (66.1%) met DSM-IV criteria for major depression. Mplus does allow missing data in the random effects component that determines the latent classes or subtypes, but does not allow missing values on covariates, thus 2 respondents with a missing value on a baseline covariate were not classified, leaving 597 for this analysis. The mean age of our analysis sample was 70.2 years with a standard deviation of 7.9 years. The age range was 60 to 94 years. Four hundred and twenty-seven (71.5%) of the patients were women. The self-identified ethnic groups of the patients consisted of 419 white patients (70.2%), 162 African-American patients (27.1%), and 16 American Indian or Asian patients (2.7%). In all, 220 persons (36.9%) were married. The mean education was 12.8 years with a standard deviation of 4.2 years, and the mean MMSE score was 27.4 with a standard deviation of 2.7. In all, 260 persons (43.6%) had 3 or more medical conditions. After 5 years, 114 depressed patients had died. One documented suicide occurred during the study. The median length of follow-up in ascertainment of vital status was 52.0 months (range 0.8 to 67.7 months).
Patterns of depressive symptoms
The three-class model of longitudinal depression subtypes improved the model fit over the two- and four-class models. The two-class model produced two declining trajectories, one with a higher HDRS baseline value and the other with a lower HDRS baseline value. The four-class model split a group with high but declining depressive symptoms into two subgroups, one with 11 patients who had a higher HDRS baseline value and had a more rapid decline. The three-class model was clinically most relevant. Figure 1 shows the mean observed HDRS scores for the respondents assigned to each pattern of depressive symptoms at the four time points at which HDRS scores were collected during the first 12 months. Pattern 1 (n=144,19.1% of the entire sample, ‘High persistent course’) had an HDRS baseline value of 20.2, and slope of −0.03 (95% confidence interval (CI) [−0.22, 0.17]). The slope was not significantly significant (z=−0.28, p=0.78). Pattern 2 (n=86, 14.4% of the entire sample, ‘High declining course’) had a baseline value of 25.8 with a statistically significant decline (z=−11.68, p<0.001), a slope of −1.43 (95% CI [−1.67, −1.19]), interpreted as a rapid decline of 1.43 HRDS points per month. Pattern 3 (n=397, 66.5% of the entire sample, ‘Low declining course’) had a baseline value of 14.6, with a statistically significant decline (z=−8.17, p<0.001), a slope of −0.67 (95% CI [−0.84, −0.51].
Figure 1.
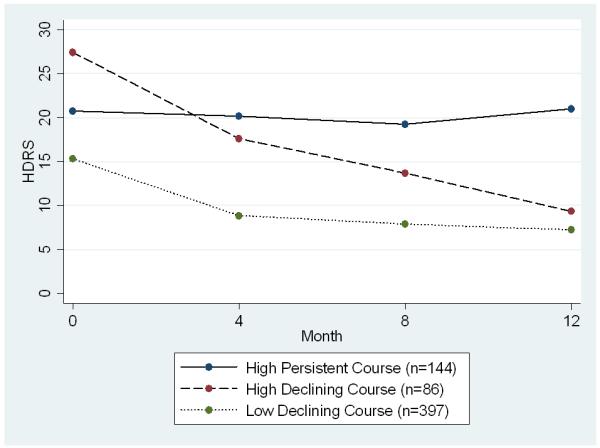
Mean observed Hamilton Depression Rating Scales across time stratified on the three patterns of depressive symptoms (n=597).
Note: Data gathered from the PROSPECT study. HDRS = Hamilton Depression Rating Scale.
Baseline patient characteristics and patterns of depressive symptoms
Table 1 shows the baseline patient characteristics and patterns of depressive symptoms. Patients with high but declining depressive symptoms show a similar pattern of associations when compared to the patients with persistent depressive symptoms. Overall, patients with persistent depressive symptoms and high but declining depressive symptoms compared to the patients with low and declining depressive symptoms were more likely to be younger, to be a smoker within the last 6 months, to have cardiovascular disease, diabetes, baseline major depression, and higher rates of baseline suicidal ideation. Patients with persistent depressive symptoms were more likely to be women and belong to an ethnic minority. Patients with high but declining depressive symptoms were more likely to be married and have respiratory disease. Patients with high but declining depressive symptoms were more likely to be in the practices randomized to the intervention compared to patients with persistent depressive symptoms and compared to patients with low and declining depressive symptoms. Patients with low and declining depressive symptoms had the highest level of educational attainment. In all, 31 deaths occurred among patients with persistent depressive symptoms, 11 deaths occurred among patients with high but declining depressive symptoms, and 72 deaths occurred among patients with low and declining depressive symptoms.
Table 1.
Baseline patient characteristics for the three patterns of depressive symptoms (n=597).
| Persistent Depression (n=114) |
High, Declining (n=86) |
Low, Declining (n=397) |
Statistic[df](p) | |
|---|---|---|---|---|
| Demographic characteristics | ||||
| Mean age in years (SD) | 69.4 (7.9) | 66.6 (7.1) | 71.3 (7.8) | F[2, 594]= 13.71 (p< 0.001) |
| Women, n(%) | 93 (81.6) | 57 (66.3) | 277 (69.8) | χ2[2]= 7.42 (p= 0.025) |
| Ethnic minority, n(%) | 51 (44.7) | 24 (27.9) | 119 (30.0) | χ2[2]= 9.76 (p= 0.008) |
| Mean education in years (SD) |
12.1 (3.2) | 11.7 (3.2) | 13.2 (4.6) | F[2, 594]= 6.02 (p= 0.003) |
| Married, n(%) | 18 (15.8) | 45 (52.3) | 157 (39.6) | χ2[2] = 31.82 (p< 0.001) |
| Smoker | ||||
| Smoker in past 6 months, n(%) |
26 (23.2) | 23 (27.1) | 64 (16.6) | χ2[2]= 6.20 (p= 0.045) |
| Medical Conditions | ||||
| Cardiovascular disease, n(%) |
63 (55.8) | 51 (60.0) | 150 (39.1) | χ2[2]= 18.42 (p< 0.001) |
| Stroke, n(%) | 26 (23.0) | 27 (31.8) | 80 (20.7) | χ2[2]= 483 (p= 0.089) |
| Diabetes, n(%) | 35 (31.0) | 21 (25.0) | 66 (17.1) | χ2[2]= 11.15 (p= 0.004) |
| Gastrointestinal tract disease, n(%) |
36 (31.9) | 30 (35.3) | 96 (24.9) | χ2[2]= 4.88 (p= 0.087) |
| Cancer, n(%) | 20 (17.5) | 17 (19.8) | 52 (13.1) | χ2[2]= 3.25 (p= 0.197) |
| Respiratory diseases, n(%) |
14 (12.5) | 21 (24.7) | 50 (12.9) | χ2[2]= 8.21 (p= 0.017) |
| Deceased | ||||
| Deceased at 5 year follow up, n(%) |
31 (27.2) | 11 (12.8) | 72 (18.1) | χ2[2]= 7.29 (p= 0.026) |
| Cognition and depression | ||||
| Mean MMSE score for cognitive function (SD) |
27.0 (3.0) | 27.2 (3.7) | 27.6 (2.3) | F[2, 594]= 2.67 (p= 0.070) |
| Major depressive disorder, n(%) |
99 (86.8) | 84 (97.7) | 212 (53.4) | χ2[2]= 88.80 (p< 0.001) |
| Suicidal ideation (SSI Score>0), n(%) |
42 (36.8) | 50 (58.1) | 58 (14.6) | χ2[2]= 81.48 (p< 0.001) |
| Patients were part of an intervention practice, n(%) |
49 (43.0) | 63 (73.3) | 208 (52.4) | χ2[2]= 18.76 (p< 0.001) |
Note: Data gathered from the PROSPECT study. P-values based on χ2 and ANOVA, as appropriate for categorical data or differences in means. SD, standard deviation; MMSE, Mini-Mental State Examination; HDRS, Hamilton Depression Rating Scale; SSI, Scale for Suicidal Ideation.
Vital status at 5 years
Table 2 shows the hazard ratios for death by pattern of depressive symptoms and adjusting for influential covariates assessed at baseline. Patients with persistent depressive symptoms were statistically significantly more likely to have died compared with patients with a course of high but declining depressive symptoms (adjusted hazard ratio 2.32, 95% confidence interval (CI) [1.15, 4.69], Wald χ2 = 5.46, df =1, p =0.019). Patients with high persistent symptoms were also statistically significantly more likely to have died compared with patients in both the other two groups, patients with a course of high but declining depressive symptoms and patients with a course of low and declining depressive symptoms (adjusted hazard ratio 1.60, 95% CI [1.03, 2.48], Wald χ2 = 4.32, df =1, p =0.036). Patients with a course of high but declining depressive symptoms were not statistically significantly more likely to have died compared with patients with a course of low and declining depressive symptoms (adjusted hazard ratio 1.60, 95% CI [0.92, 2.79], Wald χ2 = 2.77, df =1, p =0.096). We provide Kaplan-Meier curves according to patterns of depressive symptoms in Figure 2.
Table 2.
Mortality outcome at 5 years for the three patterns of depressive symptoms (n=597).
| Course subtypes of depressive symptoms (0-12 months) |
Hazard Ratio for Death [95% CI] |
|
|---|---|---|
| Unadjusted | Adjusted* | |
|
High persistent course (n=144) |
2.34** [1.31, 4.20] Wald χ2 = 8.16, df =1, p =0.004 |
2.32** [1.15, 4.69] Wald χ2 = 5.46, df =1, p =0.019 |
|
Low declining course (n=397) |
1.48 [0.84, 2.59] Wald χ2 = 1.85, df =1, p =0.174 |
1.60 [0.92, 2.79] Wald χ2 = 2.77, df =1, p =0.096 |
|
High declining course (n=86) |
1.00 | 1.00 |
Note: Data gathered from the PROSPECT study. CI = confidence interval
adjusted for baseline age, sex, education, smoking status, cardiovascular disease, stroke, diabetes, cancer, cognition, suicidal ideation, and type of practice (intervention versus usual care). 95% Wald-based confidence intervals with 1 degree of freedom are given in parentheses. Wald chi-squares, degrees of freedom and p-values are provided.
p<.05.
Figure 2.
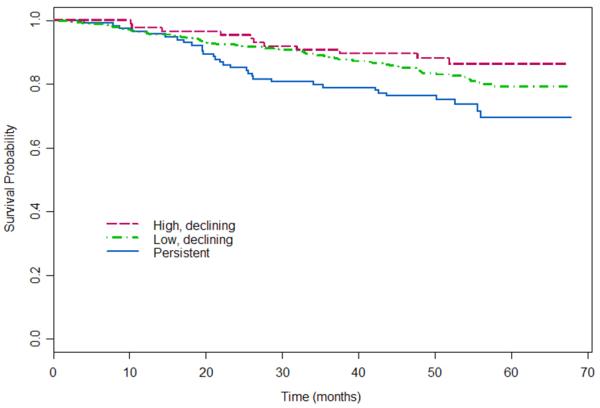
Survival curves for the three patterns of depressive symptoms (n=597).
Note: Data gathered from the PROSPECT study.
DISCUSSION
Examination of course of depressive symptoms over 12 months revealed three patterns of longitudinal depressive symptoms (persistent depressive symptoms, high but declining depressive symptoms, and low and declining depressive symptoms). Overall, relative to patients with high but declining depressive symptoms, patients with persistent depressive symptoms were more likely to have died over a 5 year follow-up period even after adjustment for type of practice (intervention versus usual care). However, no statistically significant difference was found in vital status at 5 years between patients with high but declining depressive symptoms and patients with low and declining depressive symptoms. We believe our investigation has significant implications for identification of patients who may need more intensive treatment as well as methodological implications for mental health services research.
Before discussing our findings, several limitations deserve comment. First, data were obtained only from primary care sites in greater New York City, Philadelphia, and Pittsburgh whose patients may not be representative of other primary care practices in the Northeastern United States. However, these practices were both community-based (including rural areas) and academically affiliated and are therefore probably similar to the range of other practices in that region. Second, misclassification of vital status was also a potential limitation. However, overall sensitivity of the NDI for ascertainment of vital status has generally been well over 90% in most studies [46]. Third, even with confidence in measures of exposure, misspecification of the model relating depression and death is still a possibility, such as when important variables have not been included in our model. We have tried to take care in adjusting our estimates of association for potentially influential characteristics that may relate to the outcome. Finally, our study does not examine potential mechanisms underlying the relationship between patterns of depressive symptoms and an increased mortality risk. The exact mechanism by which course of depression may increase risk of death is unknown. Both pathophysiologic mechanisms such as increased inflammation as well as behavioral processes such as poor adherence may link depression with increased mortality [47, 48]. The potential mediators between patterns of depressive symptoms and mortality require further study.
Nonetheless, despite limitations the results are noteworthy, providing new evidence on depression and mortality in older primary care patients with major and minor depression by modeling the clinical course of depression. Few previous studies with data on more than two waves of depressive assessment have examined course of depression and mortality in community settings, and previous investigations have been limited in several ways. Ariyo et al. calculated an average of depression scores over several assessments among community-dwelling older adults and found that among patients with the highest cumulative mean depression scores, the risk of death increased by 60% compared with those who had the lowest mean scores [19]. However, using mean scores over time does not provide information on changes in depressive symptoms over time. Persons with the same mean could have worsening or improving depressive symptoms. Penninx et al. examined community-dwelling older adults free of cardiovascular disease at baseline and found newly depressed older adults were at higher risk of mortality but chronically depressed older adults were not at higher risk of mortality [21]. Depression assessments were infrequent and occurred at baseline, 3 years, and 6 years which may not capture the waxing and waning of depressive symptoms. Geerlings et al. found that chronic depression as well as chronic intermittent depression (variability in depression status over time) predicted mortality at follow-up among community-dwelling older adults [20]. No adjustments were made for smoking status, cognition, or treatment of depression. Zhang et al. examined a sample of community-dwelling elderly adults and found that patients with increasing depression scores over time had a 70% increase in mortality risk compared to patients with stable depression scores over time [22]. Our approach differs from the joint model approach by Zhang et al. which relates survival to one homogeneous trend of depression and allows each individual to deviate from the one trend. Unlike other strategies to model course of depressive symptoms, our model mirrors a clinical approach in which a clinician follows an individual patient’s course to make clinical decisions regarding treatment.
Additional strengths of the study relate to data quality. PROSPECT used sensitive instruments by carefully trained research staff to measure depression diagnoses and severity. Use of semi-structured clinical interviews, the SCID and the HDRS, allowed for thorough clinical evaluation. Interviewers were expected to respond to visual cues (tearfulness, affect, appearance, demeanor), to challenge inconsistencies (patients who report no activities, yet deny anhedonia; patients who are tearful but deny sadness), and to request clarification (is sleep disturbance because the patient wakes frequently to use the bathroom, or because rumination disturbs the ability to fall back to sleep after using the bathroom?). Second, our study in primary care contrasts with the other studies based on community-dwelling samples. Considering that older adults with depression are much more likely to present and be initially managed in primary care settings [23], our study underscores the potential public mental health impact that could accrue from empowering the primary health care setting to manage psychological distress and psychiatric disturbances [49]. Because our sample was derived from primary health care, the public health significance of these findings is high. Third, our use of the general curve mixture model permits us to identify subtypes of older patients who have a different course of depression over time, which can then be linked to vital status at 5 years. Clinicians often follow course to guide the next steps in treatment.
In summary, our investigation adds to the literature on depression and mortality by examining the influence of course of depression on survival among depressed older primary care patients. Persistent depressive symptoms over 1 year were associated with a statistically significant and clinically significant increased risk of mortality over 5 years. Our results demonstrate that repeated assessments of depression may be particularly important in preventing the excess mortality that depression confers on older adults. More intensive or tailored interventions for certain subgroups of patients with persistent depressive symptoms for four or more months could lead to reduction of mortality. Our results underscore the importance of disseminating models of care that better integrate depression management into primary care. Because mortality was related to persistent depression symptoms, a focus on the treatment of depression is needed to prevent severe persistent depression and to enhance health related quality of life. As more is discovered regarding the genetic and neurobiological determinants of major depression, we may be able to more accurately identify predictors of patterns of depressive symptoms. Nevertheless, more intensive or tailored interventions for patients with persistent depression symptoms after four months could have substantial public health impact through reduction of poor clinical outcomes, including mortality.
ACKNOWLEDGMENTS
This work was supported by NIMH grant MH082799 and MH047447. The mortality follow-up of PROSPECT participants was funded by NIMH grant MH065539. Dr. Bogner was supported by an American Diabetes Association Clinical Research Award and an American Heart Association Grant-in-aid. Dr. Morales was supported by a NIMH mentored Career Development Award (MH073903).
SUPPORT: Supported by NIMH grant MH082799, MH047447, and MH065539.
Footnotes
CONFLICT OF INTEREST: No disclosures to report.
This is a PDF file of an unedited manuscript that has been accepted for publication. As a service to our customers we are providing this early version of the manuscript. The manuscript will undergo copyediting, typesetting, and review of the resulting proof before it is published in its final citable form. Please note that during the production process errors may be discovered which could affect the content, and all legal disclaimers that apply to the journal pertain.
REFERENCES
- 1.Bruce ML, Leaf PJ. Psychiatric disorders and 15-month mortality in a community sample of older adults. Am J Public Health. 1989;79(6):727–30. doi: 10.2105/ajph.79.6.727. [DOI] [PMC free article] [PubMed] [Google Scholar]
- 2.Bruce ML, et al. Psychiatric status and 9-year mortality data in the New Haven Epidemiologic Catchment Area Study. Am J Psychiatry. 1994;151(5):716–21. doi: 10.1176/ajp.151.5.716. [DOI] [PubMed] [Google Scholar]
- 3.Gallo JJ, et al. The effect of a primary care practice-based depression intervention on mortality in older adults: A randomized trial. Annals of Internal Medicine. 2007;146(10):689–98. doi: 10.7326/0003-4819-146-10-200705150-00002. [DOI] [PMC free article] [PubMed] [Google Scholar]
- 4.Penninx BW, et al. Minor and major depression and the risk of death in older persons. Arch Gen Psychiatry. 1999;56(10):889–95. doi: 10.1001/archpsyc.56.10.889. [DOI] [PubMed] [Google Scholar]
- 5.Schulz R, Drayer RA, Rollman BL. Depression as a risk factor for non-suicide mortality in the elderly. Biol Psychiatry. 2002;52(3):205–25. doi: 10.1016/s0006-3223(02)01423-3. [DOI] [PubMed] [Google Scholar]
- 6.Alexopoulos GS, et al. Remission in depressed geriatric primary care patients: a report from the PROSPECT study. Am J Psychiatry. 2005;162(4):718–24. doi: 10.1176/appi.ajp.162.4.718. [DOI] [PMC free article] [PubMed] [Google Scholar]
- 7.Katon WJ, et al. Depressive symptom deterioration in a large primary care-based elderly cohort. Am J Geriatr Psychiatry. 2006;14(3):246–54. doi: 10.1097/01.JGP.0000196630.57751.44. [DOI] [PubMed] [Google Scholar]
- 8.Gallo JJ, Lebowitz BD. The epidemiology of common late-life mental disorders in the community: Themes for the new century. Psychiatric Services. 1999;50:1158–1168. doi: 10.1176/ps.50.9.1158. [DOI] [PubMed] [Google Scholar]
- 9.Gallo JJ, Rabins PV, Iliffe S. The ‘research magnificent’ in late life: Psychiatric epidemiology and the primary health care of older adults. International Journal of Psychiatry in Medicine. 1997;27:185–204. doi: 10.2190/JF9W-9Q87-KV0F-YCY4. [DOI] [PubMed] [Google Scholar]
- 10.Gallo JJ, et al. Filters on the pathway to mental health care: II. Sociodemographic factors. Psychological Medicine. 1995;25:1149–1160. doi: 10.1017/s0033291700033122. [DOI] [PubMed] [Google Scholar]
- 11.Rabins PV. Prevention of mental disorders in the elderly: Current perspectives and future prospects. Journal of the American Geriatrics Society. 1992;40:727–733. doi: 10.1111/j.1532-5415.1992.tb01968.x. [DOI] [PubMed] [Google Scholar]
- 12.Brown DR, et al. Major depression in a community sample of African Americans. Am J Psychiatry. 1995;152(3):373–8. doi: 10.1176/ajp.152.3.373. [DOI] [PubMed] [Google Scholar]
- 13.Rost K, et al. Cost-effectiveness of enhancing primary care depression management on an ongoing basis. Ann Fam Med. 2005;3(1):7–14. doi: 10.1370/afm.256. [DOI] [PMC free article] [PubMed] [Google Scholar]
- 14.US Department of Health and Human Services [Accessed November 8, 2010];The National Institute of Mental Health Strategic Plan (Publication No. 08-6368) 2008 http://www.nimh.nih.gov/about/strategic-planning-reports/nimh-strategic-plan-2008.pdf. cited.
- 15.Koenig HG, et al. Depressive symptoms and nine-year survival of 1,001 male veterans hospitalized with medical illness. Am J Geriatr Psychiatry. 1999;7(2):124–31. [PubMed] [Google Scholar]
- 16.Reynolds SL, Haley WE, Kozlenko N. The impact of depressive symptoms and chronic diseases on active life expectancy in older Americans. Am J Geriatr Psychiatry. 2008;16(5):425–32. doi: 10.1097/JGP.0b013e31816ff32e. [DOI] [PubMed] [Google Scholar]
- 17.Unutzer J, et al. Depressive symptoms and mortality in a prospective study of 2,558 older adults. Am J Geriatr Psychiatry. 2002;10(5):521–30. doi: 10.1097/00019442-200209000-00005. [DOI] [PubMed] [Google Scholar]
- 18.Wulsin LR, Vaillant GE, Wells VE. A systematic review of the mortality of depression. Psychosom Med. 1999;61(1):6–17. doi: 10.1097/00006842-199901000-00003. [DOI] [PubMed] [Google Scholar]
- 19.Ariyo AA, et al. Cardiovascular Health Study Collaborative Research Group Depressive symptoms and risks of coronary heart disease and mortality in elderly Americans. Circulation. 2000;102(15):1773–9. doi: 10.1161/01.cir.102.15.1773. [DOI] [PubMed] [Google Scholar]
- 20.Geerlings SW, et al. Duration and severity of depression predict mortality in older adults in the community. Psychol Med. 2002;32(4):609–18. doi: 10.1017/s0033291702005585. [DOI] [PubMed] [Google Scholar]
- 21.Penninx BW, et al. Cardiovascular events and mortality in newly and chronically depressed persons > 70 years of age. Am J Cardiol. 1998;81(8):988–94. doi: 10.1016/s0002-9149(98)00077-0. [DOI] [PubMed] [Google Scholar]
- 22.Zhang JP, et al. Joint modeling of longitudinal changes in depressive symptoms and mortality in a sample of community-dwelling elderly people. Psychosom Med. 2009;71(7):704–14. doi: 10.1097/PSY.0b013e3181ac9bce. [DOI] [PMC free article] [PubMed] [Google Scholar]
- 23.Bogner HR, et al. Mental health services use: Baltimore epidemiologic catchment area follow-up. American Journal of Geriatric Psychiatry. 2009;17(8):706–15. doi: 10.1097/JGP.0b013e3181aad5c5. [DOI] [PMC free article] [PubMed] [Google Scholar]
- 24.Muthen BO, Shedden K. Finite mixture modeling with mixture outcomes using the EM algorithm. Biometrics. 1999;55:463–469. doi: 10.1111/j.0006-341x.1999.00463.x. [DOI] [PubMed] [Google Scholar]
- 25.Lin H, et al. Latent class models for joint analysis of longitudinal biomarker and event process data: application to longitudinal prostate-specific antigen readings and prostate cancer. Journal of the American Statistical Association. 2002;97(457):53–65. [Google Scholar]
- 26.McCulloch CE, et al. Discovering subpopulation structure with latent class mixed models. Stat Med. 2002;21(3):417–29. doi: 10.1002/sim.1027. [DOI] [PubMed] [Google Scholar]
- 27.Lin H, et al. A latent class mixed model for analysing biomarker trajectories with irregularly scheduled observations. Stat Med. 2000;19(10):1303–18. doi: 10.1002/(sici)1097-0258(20000530)19:10<1303::aid-sim424>3.0.co;2-e. [DOI] [PubMed] [Google Scholar]
- 28.Muthen B, Shedden K. Finite mixture modeling with mixture outcomes using the EM algorithm. Biometrics. 1999;55(2):463–9. doi: 10.1111/j.0006-341x.1999.00463.x. [DOI] [PubMed] [Google Scholar]
- 29.Muthen BO, Muthen LK. The development of heavy drinking and alcohol-related problems from ages 18 to 37 in a U.S. national sample. J Stud Alcohol. 2000;61(2):290–300. doi: 10.15288/jsa.2000.61.290. [DOI] [PubMed] [Google Scholar]
- 30.Muthen B, Muthen LK. Integrating person-centered and variable-centered analyses: growth mixture modeling with latent trajectory classes. Alcohol Clin Exp Res. 2000;24(6):882–91. [PubMed] [Google Scholar]
- 31.Muthen B. In: Second-Generation Structural Equation Modeling With a Combination of Categorical and Continuous Latent Variables, in New Methods for the Analysis of Change. Collins LM, Sayer AG, editors. American Psychological Association; Washington, DC: 2001. [Google Scholar]
- 32.Uher R, et al. Trajectories of change in depression severity during treatment with antidepressants. Psychol Med. 2009:1–11. doi: 10.1017/S0033291709991528. [DOI] [PubMed] [Google Scholar]
- 33.Bruce ML, et al. Reducing suicidal ideation and depressive symptoms in depressed older primary care patients: a randomized controlled trial. Jama. 2004;291(9):1081–91. doi: 10.1001/jama.291.9.1081. [DOI] [PubMed] [Google Scholar]
- 34.Radloff LS. The CES-D Scale: A self-report depression scale for research in the general population. Applied Psychological Measurement. 1977;1:385–401. [Google Scholar]
- 35.Raue PJ, et al. The wish to die and 5-year mortality in elderly primary care patients. Am J Geriatr Psychiatry. 2010;18(4):341–50. doi: 10.1097/JGP.0b013e3181c37cfe. [DOI] [PMC free article] [PubMed] [Google Scholar]
- 36.Spitzer RL, Gibbon M, Williams JB. Structured Clinical Interview for Axis I DSM-IV Disorders (SCID) American Association Press, Inc; Washington, D.C.: 1995. [Google Scholar]
- 37.Hamilton M. A rating scale for depression. Journal of Neurology and Neurosurgical Psychiatry. 1960;23:56–62. doi: 10.1136/jnnp.23.1.56. [DOI] [PMC free article] [PubMed] [Google Scholar]
- 38.Beck A, Brown G, Steer R. Psychometric characteristics of the scale for suicide. Ideation with psychiatric outpatients. Behavior Research and Therapy. 1997;35:1039–1046. doi: 10.1016/s0005-7967(97)00073-9. [DOI] [PubMed] [Google Scholar]
- 39.Charlson ME, et al. A new method of classifying prognostic comorbidity in longitudinal studies: Development and validation. Journal of Chronic Disease. 1987;40:373–383. doi: 10.1016/0021-9681(87)90171-8. [DOI] [PubMed] [Google Scholar]
- 40.Folstein MF, Folstein SE, McHugh PR. “Mini-Mental State”: A practical method for grading the cognitive state of patients for the clinician. Journal of Psychiatric Research. 1975;12(3):189–198. doi: 10.1016/0022-3956(75)90026-6. [DOI] [PubMed] [Google Scholar]
- 41.Doody MM, Hayes HM, Bilgrad R. Comparability of National Death Index Plus and standard procedures for determining causes of death in epidemiologic studies. Annals of Epidemiology. 2001;11:46–50. doi: 10.1016/s1047-2797(00)00177-0. [DOI] [PubMed] [Google Scholar]
- 42.Kaplan E, Meier P. Nonparametric estimation from incomplete observations. Journal of the American Statistical Association. 1958;53:457–481. [Google Scholar]
- 43.Akaike H. A Bayesian analysis of the minimum AIC procedure. Annals of the Institute of Statistical Mathematics. 1978;30:9–14. [Google Scholar]
- 44.Schwarz G. Estimating the dimension of a model. The Annals of Statistics. 1978;6:461–464. [Google Scholar]
- 45.Lo Y, Mendell NR, Rubin DB. Testing the number of components in a normal mixture. Biometrika. 2001;88(3):767–778. [Google Scholar]
- 46.Sathiakumar N, Delzell E, Abdalla O. Using the National Death Index to obtain underlying cause of death codes. J Occup Environ Med. 1998;40(9):808–13. doi: 10.1097/00043764-199809000-00010. [DOI] [PubMed] [Google Scholar]
- 47.Musselman DL, et al. Relationship of depression to diabetes types 1 and 2: epidemiology, biology, and treatment. Biol Psychiatry. 2003;54(3):317–29. doi: 10.1016/s0006-3223(03)00569-9. [DOI] [PubMed] [Google Scholar]
- 48.Joynt KE, Whellan DJ, O’Connor CM. Depression and cardiovascular disease: mechanisms of interaction. Biol Psychiatry. 2003;54(3):248–61. doi: 10.1016/s0006-3223(03)00568-7. [DOI] [PubMed] [Google Scholar]
- 49.Bartels SJ, et al. Improving access to geriatric mental health services: a randomized trial comparing treatment engagement with integrated versus enhanced referral care for depression, anxiety, and at-risk alcohol use. Am J Psychiatry. 2004;161(8):1455–62. doi: 10.1176/appi.ajp.161.8.1455. [DOI] [PubMed] [Google Scholar]