Abstract
MRI using hyperpolarized 13C-labeled pyruvate is a promising tool to biochemically profile tumors and monitor their response to therapy. This technique requires injection of pyruvate into tumor-bearing animals. Pyruvate is an endogenous entity but the influence of exogenously injected bolus doses of pyruvate on tumor microenvironment is not well understood. In this study, the effect of injecting a bolus of pyruvate on tumor oxygen status was investigated. EPR oxygen imaging revealed that the partial pressure of oxygen (pO2) in squamous cell carcinoma (SCC) implanted in mice decreased significantly 30 min after [1-13C]pyruvate injection, but recovered to pre-injection levels after 5 hours. DCE-MRI studies showed that, at the dose of pyruvate used, no changes in tumor perfusion were noticed. Immunohistochemical analysis of hypoxic marker pimonidazole independently verified that the SCC tumor transiently became more hypoxic by pyruvate injection. Efficacy of radiotherapy was suppressed when X-irradiation was delivered during the period of pyruvate-induced transient hypoxia. These results suggest importance of taking into account the transient decrease in tumor pO2 after pyruvate injection in hyperpolarized 13C MRI, since tumor oxygen status is an important factor in determining outcomes of therapies.
Keywords: electron paramagnetic resonance imaging, hyperpolarized 13C MRI, tumor hypoxia, radiotherapy
INTRODUCTION
Hyperpolarization of 13C-labeled compounds was found to greatly increase the MR signal by more than 10000-fold (1), and provides sufficient signal levels to image the hyperpolarized compounds and their metabolites in vivo. This technique provides the ability to monitor metabolic processes of the hyperpolarized substrates in live animals (2–8). The use of 13C-labeled pyruvate for cancer studies is of great interest, since pyruvate is involved in important bioenergetic processes that are altered in pathologic conditions such as cancer. Acetyl-CoA and CO2 are formed from pyruvate in a reaction catalyzed by pyruvate dehydrogenase under aerobic condition; subsequently acetyl-CoA enters the tricarboxylic acid (TCA) cycle. Under hypoxic conditions, pyruvate is metabolized to lactate in the reaction catalyzed by lactate dehydrogenase (LDH). As tumors grow, they become hypoxic since the new blood vessels are aberrant and unable to deliver oxygen, nutrients or drugs efficiently (9–11). Therefore, anaerobic metabolism of pyruvate to lactate is increased in tumors. The formation of lactate from pyruvate is also increased in some kinds of tumors even in the presence of adequate levels of oxygen through aerobic glycolysis, a phenomenon known as the Warburg effect (12,13). Recent studies using hyperpolarized [1-13C]pyruvate showed significantly higher level of [1-13C]lactate in tumors compared with normal tissue, and the formation of lactate was decreased by chemotherapies (4–6). These studies suggest that lactate is the main metabolite of pyruvate in tumors, and the [1-13C]lactate to [1-13C]pyruvate ratio can be a useful marker for estimating tumor progression and response to therapy.
Although anaerobic metabolism of pyruvate is dominant in tumors, a part of pyruvate is still aerobically metabolized. Injection of hyperpolarized [1-13C]pyruvate for MR spectroscopic imaging into tumor-bearing animals at the required doses may make tumors consume more oxygen via mitochondrial oxidative phosphorylation. Since oxygen concentration in tumors is a critical factor to determine outcomes of cancer therapies (14–16), we investigated the temporal profile of tumor oxygen status by using EPR imaging (EPRI) technique after pyruvate administration in this study.
EPR is a spectroscopic technique similar to NMR but detects paramagnetic species which have unpaired electrons. Since the line width of paramagnetic species varies depending on oxygen concentration, EPR combined with an appropriate paramagnetic tracer is widely used for estimating tissue oxygen status (17–21). Recent development of EPRI with triarylmethyl radicals (TAM) as an EPR tracer made it possible to non-invasively visualize tissue oxygen concentration in live animals using EPRI. The EPRI technique using TAM as a tracer is capable of longitudinally monitoring tumor oxygen status as a function of tumor growth and its response to therapy (19–21). In this study, changes of partial pressure of oxygen (pO2) in squamous cell carcinoma (SCC) implanted in mouse leg after [1-13C]pyruvate administration was examined using EPRI. The results showed that tumor pO2 transiently decreased after pyruvate injection, rendering tumors resistant to radiotherapy when radiation was delivered within 5 hours after pyruvate injection.
MATERIALS AND METHODS
Animal studies
All animal experiments were carried out in compliance with the Guide for the care and use of laboratory animal resources (National Research Council, 1996) and approved by the National Cancer Institute Animal Care and Use Committee. Female C3H/Hen mice were supplied by the Frederick Cancer Research Center, Animal Production (Frederick, MD). SCCVII solid tumors were formed by injecting 5 × 10⁵ SCC cells subcutaneously into the right hind leg of C3H mice. Body weight measured before the experiments was 21–27 g. In EPRI and MRI measurements, mice were anesthetized by isoflurane (4% for induction and 2% for maintaining anesthesia) in medical air (750 mL/min) and positioned prone with their tumor-bearing legs placed inside the resonator. During the measurements, the breathing rate of the mice was monitored with a pressure transducer (SA Instruments Inc.) and maintained at 60 ± 10 breaths per minute. Core body temperature was also monitored with a non-magnetic rectal temperature probe (FISO) and maintained at 37 ± 1°C with a flow of warm air. For administration of TAM and [1-13C]pyruvate solution, a 30-gauge needle was cannulated into the tail vein and extended using polyethylene tubing (PE-10).
EPR imaging with pyruvate injection
Technical details of the EPR scanner operating at 300 MHz, data acquisition based on the single-point imaging (SPI) modality, image reconstruction, and the oxygen mapping procedure were described in earlier reports (19,20). Isotonic [1-13C]pyruvate solution (pH 7.4) was prepared by dissolving 30 μL of[1-13C]pyruvic acid in 4.5 mL of alkaline solution containing 100 mg/L EDTA. After the mouse was placed in the resonator, TAM (OX063, GE Healthcare) was injected intravenously through a cannula placed in the tail vein. TAM was given as a 1.125 mmol/kg bolus followed by 0.04 mmol/kg/min continuous injection. After acquiring the first EPR data set, 1.15 mmol/kg bolus (300 μL of 96 mM) [1-13C]pyruvate solution was injected intravenously through the cannula. EPRI measurements were carried out 30 min and 1 h after [1-13C]pyruvate injection. Then, the mouse was released. The mouse was anesthetized and canulated again, 1.125 mmol/kg TAM was injected to the mouse, and EPRI measurement was carried out 5 h after the [1-13C]pyruvate injection.
EPR signals were collected following the RF excitation pulses (60 ns, 80 W, 70° flip angle) using an analog digital converter (200 Msamples/s). EPR measurements were started 3 min after TAM injection, and it took 9 min to obtain a data set for a 3D image. The repetition time (TR) was 6.0 μs. The FIDs were collected under a nested looping of the x, y, z gradients and each time point in the FID underwent phase modulation enabling 3D spatial encoding. In order to get reproducible values of T2* and to retain a more or less uniform image resolution, a set of 3 gradients was used, and data for corresponding images were collected in an interleaved fashion (19). If the power spectrum of the pulse is uniform throughout the k-space for all the gradients used, the spatial resolution is simply defined by FOV and the number of k-samples (elements in k-space). The spatial resolution was 1.8 mm, although the pixel resolution was digitally enhanced.
Co-registration of pO2 images from EPRI with anatomic images from MRI
Anatomical images of the tumor-bearing leg were obtained using 7 T MRI after the EPRI measurements. The pO2 images from EPRI and the anatomic images from MRI were co-registered, since EPRI does not give anatomical information. An identical parallel coil resonator (17 mm i.d. and 25 mm long) with Q switch was used for both EPRI and MRI operating at 300 MHz (20).
MRI scans were conducted using a 7 T scanner controlled with ParaVision 5.0 (Bruker BioSpin MRI GmbH). After a quick assessment of the sample position by a fast low-angle shot (FLASH) tripilot sequence, T2-weighted anatomical images were obtained using a fast spin echo sequence (RARE) with an echo time (TE) of 13 ms, TR of 2.5 s, 14 slices, RARE factor 8, resolution of 0.109 × 0.109 mm, and acquisition time of 80 s. For convenience of co-registration with EPRI, all MRI images had the same FOV of 2.8 cm and slice thickness of 2 mm. Co-registration of EPRI and MRI images was accomplished using code written in MATLAB (Mathworks) as described in a previous report (20).
X-irradiation
Mice were fixed in a specially designed jig for X-irradiation, by which mice were restricted to move without anesthesia. X-irradiation (12 Gy) was delivered to tumor-bearing leg 6 days after SCC tumor implantation using a XRAD-320 (Precision X-ray Inc.).
Immunohistochemical analysis
Pimonidazole, a hypoxia marker was given to tumor-bearing mice intravenously 30 min before excising tumors. The mice were euthanized, and tumor tissues were removed from mice. The tumor tissues were fixed with 4% paraformaldehyde and frozen using ultracold ethanol. The frozen tumors were sectioned to 10 μm thick using a cryostat, and the sections were thaw-mounted on glass slides. After blocking non-specific binding sites with Protein Block Serum-Free reagent (Dako North America Inc., Carpinteria, CA), the slides were covered by rabbit anti-pimonidazole antisera (Natural Pharmacia International, Inc., Burlington, MA; 1:250) overnight at 4°C. The sections were incubated with Alexa Fluor 555 anti-rabbit secondary antibody (Invitrogen, Carlsbad, CA; 1:500). Then they were mounted on Prolong Gold antifade reagent with DAPI (Invitrogen). Fluorescence microscopic observation was performed using an Axiovert 200 inverted fluorescent microscope (Carl Zeiss), and images of tissues were captured using Image-Pro Plus Ver. 4.0 imaging software. The pimonidazole positive area was quantified using Image J software.
Statistical analysis
All results were expressed as the mean ± SEM. The differences in means of groups were determined by 2-tailed Student's t test. The minimum level of significance was set at P<0.05.
RESULTS AND DISCUSSION
Tumor pO2 decreases after hyperpolarized MRI study of [1-13C]-pyruvate
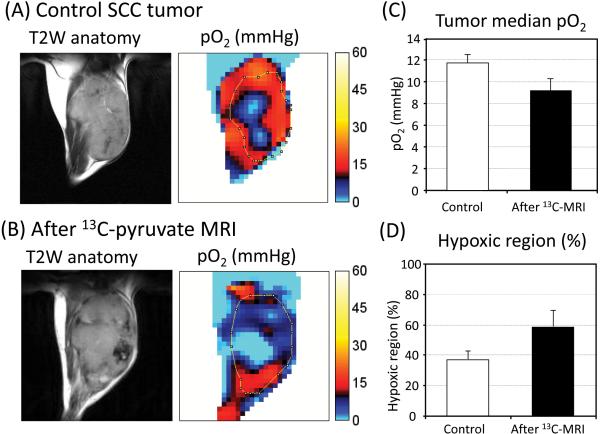
To examine changes in tumor pO2 in response to intravenous administration of a bolus dose of pyruvate (1.15 mmol/kg b. w.; 300 μL of 96 mM), EPRI experiments on a group of mice implanted with SCC tumors were carried out after MRI experiments of hyperpolarized [1-13C]pyruvate, namely 1-2 h after hyperpolarized [1-13C]pyruvate injection, and compared with a group of mice with tumors which didn't receive pyruvate injection (control group). Figure 1A, B show the center slices of T2 weighted anatomic images from MRI and the corresponding pO2 maps from EPRI in a SCC tumor leg of a control mouse and a mouse after hyperpolarized [1-13C]pyruvate MRI experiments. The results show that the median pO2 value in the control tumor group was 11.7 ± 0.7 mmHg, whereas after [1-13C]pyruvate injection, the pO2 value decreased to 9.2 ± 1.1 mmHg (Figure 1C). The tumors were relatively more hypoxic after hyperpolarized [1-13C]pyruvate MRI experiments compared with the control tumors. From the pO2 images of the tumor the hypoxic fraction (pixels with pO2< 10 mm Hg) was determined. It was found that the hypoxic fraction after pyruvate administration (58.5 ± 10.2%) was greater than the hypoxic fraction in control tumors (37.1 ± 5.6%) (Figure 1D). These results suggest that pyruvate administration results in a decrease of tumor pO2 and a corresponding increase in hypoxic fraction.
Figure 1.
Comparison of tumor pO2 between “with and without” hyperpolarized [1-13C]pyruvate experiments. (A,B) T2 weighted anatomical image of a representative SCC tumor–bearing mouse, and the corresponding pO2 maps. (A) Control tumor which didn't receive [1-13C]pyruvate injection. (B) Tumor measured after hyperpolarized [1-13C]pyruvate experiments. (C) Median pO2 and (D) percentage of the hypoxic region in control tumors (n=5) and tumors after [1-13C]pyruvate experiments (n = 4). There was no significance between control and after 13C-MRI.
Pyruvate injection transiently reduces tumor pO2
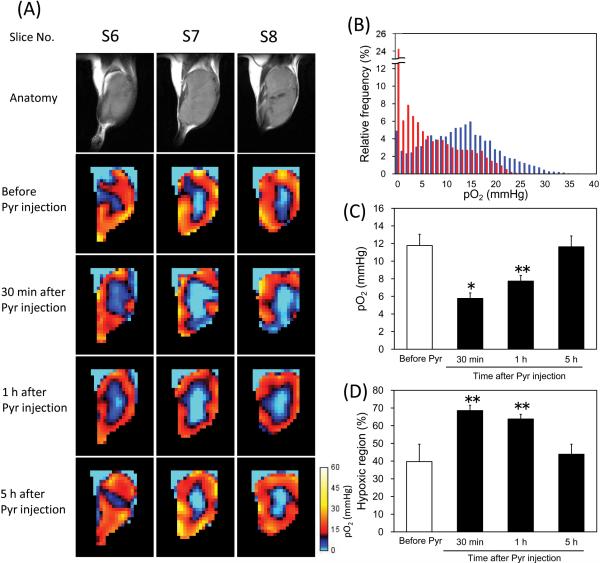
Pyruvate is mainly metabolized to lactate, alanine, and acetyl-CoA + CO2 in tumors. Large MR signal attributed to [1-13C]lactate was detected in the SCC tumors immediately after hyperpolarized [1-13C]pyruvate injection, but [1-13C]alanine and 13C-bicarbonate which (in equilibrium with 13CO2) were at negligible levels (data not shown). These results suggest that anaerobic lactate formation catalyzed by LDH is a main pathway of pyruvate metabolism in the SCC tumor. However, decreased tumor pO2 level after hyperpolarized [1-13C]pyruvate MRI experiments as shown in Figure 1 may suggest that a significant fraction of tumor oxygen is consumed by exogenously injected [1-13C]pyruvate probably due to increase of O2-dependent metabolism of pyruvate. To elucidate changes in the oxygen status of the SCC tumor as a function of time following pyruvate administration, we carried out sequential pO2 imaging experiments at different times after pyruvate administration. The pyruvate solution was not hyperpolarized, but labeled compound was used in this experiment. Figure 2A shows three adjacent slices of anatomic and pO2 images in a SCC tumor leg measured 9 days after tumor implantation. The pO2 imaging experiments were carried out before, 30 min, 1 h, and 5 h after [1-13C]pyruvate injection. From the EPRI studies, it was found that a significant decrease in pO2 occurred in the tumor 30 min after [1-13C]pyruvate injection. The frequency histogram of pO2 in the tumor region 30 min after pyruvate injection displayed a leftward shift compared with the histogram before pyruvate injection (Figure 2B). The pO2 in the tumor was still lower 1 h after injection, but recovered to the pre-injection level 5 h after injection (Figure 2A). Figure 2C and 2D show the average of median pO2 and the fractional hypoxia (%) of 4 SCC tumors. Median tumor pO2 value in the SCC tumors was 11.8 ± 1.3 mmHg before pyruvate injection, which decreased to 5.8 ± 0.6 mmHg 30 min after injection (Figure 2C). It gradually recovered to 7.7 ± 0.6 mmHg 1 h after and 11.6 ± 1.2 mmHg 5 h after pyruvate injection. There was no significant difference in tumor pO2 between before and 5 h after pyruvate injection. Hypoxic fraction in the tumors showed a similar tendency as the median pO2 (Figure 2D). The hypoxic fraction in the tumors was significantly larger 30 min and 1 h after pyruvate injection (68.5 ± 3.0 % and 63.8 ± 2.6 %, respectively) than that before the injection (39.7 ± 9.8 %), and recovered to pre-injection level 5 h after the injection (43.9 ± 5.7 %). Such trends of decrease in tumor oxygenation were observed even when the dose of pyruvate was half. The tumor pO2 decreased by 32 % 30 min after the half dose of [1-13C]pyruvate (0.58 mmol/kg b. w.) injection (data not shown).
Figure 2.
Non-invasive monitoring of tumor pO2 by EPRI and effects of pyruvate injection. (A) T2-weighted anatomical image of a representative SCC tumor–bearing mouse, and the corresponding pO2 maps measured before, 30 min, 1 h, and 5 h after [1-13C]pyruvate injection. The adjacent center three slices of the 3D images were displayed, and the every slice has 2 mm thickness. (B) Frequency histogram of the tumor pO2 shown in (A) before (blue) and 30 min after (red) pyruvate injection. (C) Median pO2 in the tumors, and (D) percentage of the hypoxic region (pO2 < 10 mmHg) in the tumors. Each value in (C) and (D) indicates the mean ± SEM of 4 mice. * P<0.01, ** P<0.05, compared with before pyruvate injection.
In Figure 1C, D, the control group of mice and the group of mice after 13C-MRI were different. There was no significance in the median pO2 and hypoxic fraction between with and without pyruvate injection, although there was a trend of decrease in tumor pO2 after 13C-MRI. The reason why there was no significance in Figure 1 would be the time after pyruvate injection. The pO2 in the mice after 13C-MRI was measured 1-2 h after [1-13C]pyruvate injection. The pO2 decreased by the pyruvate injection moderately recovered 1-2 hour after the injection. In Figure 2, we measured pO2 in same group of mice at different time points before and after pyruvate injection. The results showed that tumor pO2 decreased after pyruvate injection, and the differences in hypoxia between the control group and after 13C-MRI group in Figure 1 were not due to biological differences, but due to pyruvate injection.
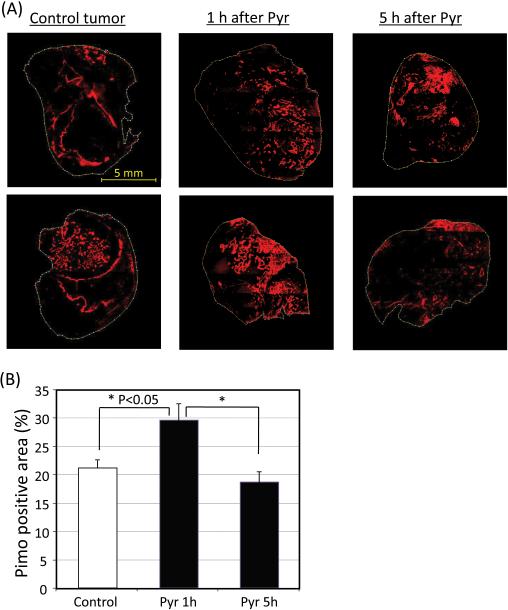
To independently confirm the changes in tumor pO2 values in response to pyruvate administration, immunohistochemical assessment of tumor pO2 using the hypoxia specific agent pimonidazole were carried out. The results showed increases in hypoxic fraction following pyruvate administration (Figure 3). Pimonidazole positive area in tumors 1 h after [1-13C]pyruvate injection was significantly larger (29.5 ± 2.9 %) than control mice (21.1 ± 1.4 %), which didn't receive [1-13C]pyruvate injection (Figure 3B). In agreement with pO2 imaging results using EPRI, there was no difference in pimonidazole positive area between the tumors 5 hours after [1-13C]pyruvate injection (18.7 ± 1.8 %) and the control tumors. The results of the EPRI and the immunohistochemical study indicate that tumor pO2 is decreased by pyruvate administration, but the effect was transient.
Figure 3.
(A) Immunostaining of hypoxia marker pimonidazole of representative tumors of control mice and pyruvate-treated mice (1 h and 5 h after [1-13C]pyruvate injection). (B) Pimonidazole positive area in control tumors (n = 5) and tumors 1 h after (n=5) and 5 h after (n=5) [1-13C]pyruvate injection.
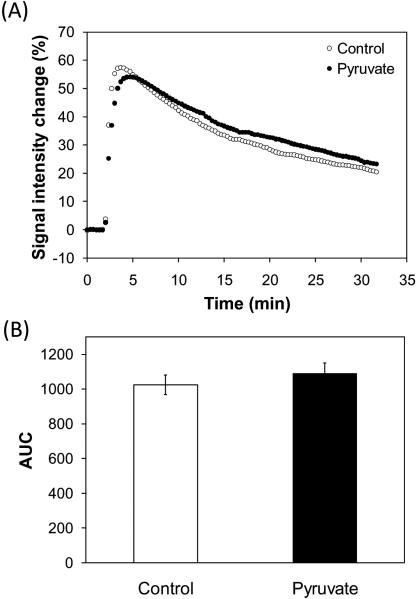
Tumor perfusion is one of the factors that affect tumor oxygen status. To elucidate effects of exogenously injected pyruvate on tumor perfusion, we carried out DCE-MRI with and without [1-13C]pyruvate injection in separate group of mice. Figure 4A shows the signal intensity changes in T1-weighted images of SCC tumors after Gd-DTPA (234.5 mg/kg body weight, BioPAL Inc.) injection. There was no significant difference in the area under the curves between with and without the pyruvate injection (Figure 4B). These results suggest that exogenously injected pyruvate did not influence tumor perfusion at the dose used in this study.
Figure 4.
Tumor perfusion measurements by DCE-MRI. (A) Signal intensity change in T1-weighted images of SCC tumors by Gd-DTPA injection. Gd-DTPA (234.5 mg/kg body weight) was intravenously injected to the mice 2 min after starting the scan. The control mice (n = 4) didn't receive [1-13C]pyruvate injection. The pyruvate group (n = 4) received [1-13C]pyruvate injection 30 min before DCE-MRI. (B) Area under the curves. Each value represents the average of 4 mice and error bars represent SEM. There was no significant difference between the control group and the pyruvate group.
Pyruvate-induced hypoxia reduces efficacy of radiotherapy
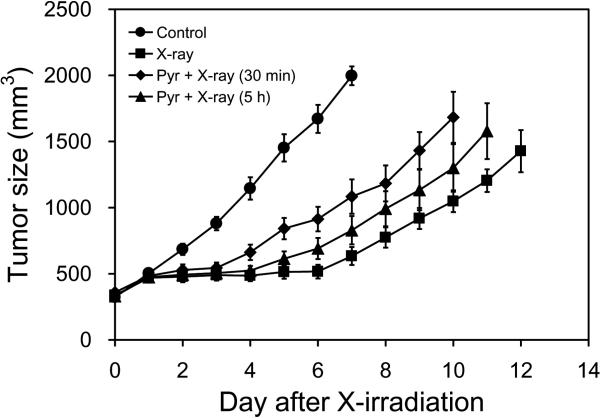
Hypoxia is a critical factor that determines tumor resistance to radiotherapy and some kinds of chemotherapy. Although the pyruvate-induced hypoxia is transient, the decrease in oxygen concentration may limit the efficacy of cancer therapy, if the cancer treatments are provided immediately after MRI with hyperpolarized [1-13C]pyruvate. To elucidate the effect of exogenously injected pyruvate on radiotherapy, we monitored tumor growth after X-irradiation with and without [1-13C]pyruvate injection (Figure 5). X-irradiation (12 Gy) without pyruvate administration suppressed the tumor growth for 6–7 days compared with non-treated control group which received neither X-irradiation nor pyruvate administration. When tumors were exposed to X-irradiation 30 min after [1-13C]pyruvate injection, a delay in tumor growth of 3–4 days was observed, indicating that the tumor growth delay effect of X-irradiation was compromised by [1-13C]pyruvate administration. Interestingly, the effect of pyruvate-induced decrease in tumor oxygenation on radiotherapy were observed even 5 hours after pyruvate injection, whereas tumor pO2 almost recovered to the levels before PA injection as shown in Figure 2. Secondary mechanisms such as activation of hypoxia inducible transcription factor-1 signaling during the pyruvate-induced transient hypoxia might partially contribute to the long lasting effect of pyruvate on radiotherapy in addition to the direct effect of oxygen concentration at the time of radiation.
Figure 5.
Tumor growth curves after X-irradiation. Control group (●, n = 5) was treated neither X-irradiation nor [1-13C]pyruvate injection. X-irradiations to the tumors were carried out without (■, n = 5), 30 min after (◆, n = 6), and 5 h after (▲, n = 7) [1-13C]pyruvate injection.
In conclusion, injection of a bolus dose of pyruvate to tumor-bearing mice needed for hyperpolarized 13C imaging experiments can cause transient decrease in tumor pO2, and this decrease in pO2 weakens the tumor suppressive effect of X-irradiation. It should be noted that the pyruvate-induced hypoxia may provide benefit if combined with hypoxic toxins. The dose of pyruvate used in this study is at the high end of doses commonly reported in the literature of hyperpolarized pyruvate studies. Secondly, a clinical dose would likely be about an order of magnitude less (~ 0.1 mmol/kg) than the dose used in this study. Hyperpolarized [1-13C]pyruvate is a promising tool for metabolically profiling the tumor and also in monitoring tumor progression and treatment response. However, when this technique is applied clinically with cancer therapies, it is important to take into account the transient microenvironmental change such as tumor oxygenation by pyruvate injection in the range of 0.1 mmol/kg itself that may modulate the efficacy of treatments.
REFERENCES
- 1.Ardenkjær-Larsen JH, Fridlund B, Gram A, Hansson G, Hansson L, Lerche MH, Servin R, Thaning M, Golman K. Increase in signal-to-noise ratio of >10,000 times in liquid-state NMR. Proc Natl Acad Sci USA. 2003;100:10158–10163. doi: 10.1073/pnas.1733835100. [DOI] [PMC free article] [PubMed] [Google Scholar]
- 2.Golman K, Zandt R, Thaning M. Real-time metabolic imaging. Proc Natl Acad Sci USA. 2006;103:11270–11275. doi: 10.1073/pnas.0601319103. [DOI] [PMC free article] [PubMed] [Google Scholar]
- 3.Kohler SJ, Yen Y, Wolber J, Chen AP, Albers MJ, Bok R, Zhang V, Tropp J, Nelson S, Vigneron DB, Kurhanewicz J, Hurd RE. In vivo 13carbon metabolic imaging at 3T with hyperpolarized 13C-1-pyruvate. Magn Reson Med. 2007;58:65–69. doi: 10.1002/mrm.21253. [DOI] [PubMed] [Google Scholar]
- 4.Golman K, Zandt R, Lerche M, Pehrson R, Ardenkjaer-Larsen JH. Metabolic imaging by hyperpolarized 13C magnetic resonance imaging for in vivo tumor diagnosis. Cancer Res. 2006;66:10855–10860. doi: 10.1158/0008-5472.CAN-06-2564. [DOI] [PubMed] [Google Scholar]
- 5.Albers MJ, Bok R, Chen AP, Cunningham CH, Zierhut ML, Zhang VY, Kohler SJ, Tropp J, Hurd RE, Yen YF, Nelson SJ, Vigneron DB, Kurhanewicz J. Hyperpolarized 13C lactate, pyruvate, and alanine: noninvasive biomarkers for prostate cancer detection and grading. Cancer Res. 2008;68:8607–8615. doi: 10.1158/0008-5472.CAN-08-0749. [DOI] [PMC free article] [PubMed] [Google Scholar]
- 6.Day SE, Kettunen MI, Gallagher FA, Hu DE, Lerche M, Wolber J, Golman K, Ardenkjaer-Larsen JH, Brindle KM. Detecting tumor response to treatment using hyperpolarized 13C magnetic resonance imaging and spectroscopy. Nat Med. 2007;13:1382–1387. doi: 10.1038/nm1650. [DOI] [PubMed] [Google Scholar]
- 7.Hu S, Chen AP, Zierhut ML, Bok R, Yen YF, Schroeder MA, Hurd RE, Nelson SJ, Kurhanewicz J, Vigneron DB. In vivo carbon-13 dynamic MRS and MRSI of normal and fasted rat liver with hyperpolarized 13C-pyruvate. Mol Imaging Biol. 2009;11:399–407. doi: 10.1007/s11307-009-0218-z. [DOI] [PMC free article] [PubMed] [Google Scholar]
- 8.Gallagher FA, Kettunen MI, Brindle KM. Biochemical application of hyperpolarized 13C magnetic resonance imaging. Prog Nucl Mag Res Sp. 2009;55:285–295. [Google Scholar]
- 9.Brown JM, Giaccia AJ. The unique physiology of solid tumors: opportunities (and problems) for cancer therapy. Cancer Res. 1998;58:1408–1416. [PubMed] [Google Scholar]
- 10.Carmeliet P, Jain RK. Angiogenesis in cancer and other diseases. Nature. 2000;407:249–257. doi: 10.1038/35025220. [DOI] [PubMed] [Google Scholar]
- 11.Matsumoto S, Yasui H, Batra S, Kinoshita Y, Bernardo M, Munasinghe JP, Utsumi H, Choudhuri R, Devasahayam N, Subramanian S, Mitchell JB, Krishna MC. Simultaneous imaging of tumor oxygenation and microvascular permeability using Overhauser enhanced MRI. Proc Natl Acad Sci USA. 2009;106:17898–17903. doi: 10.1073/pnas.0908447106. [DOI] [PMC free article] [PubMed] [Google Scholar]
- 12.Board M, Hummt S, Newsholme EA. Maximum activities of key enzymes of glycolysis, glutaminolysis, pentose phosphate pathway and tricarboxylic acid cycle in normal, neoplastic and suppressed cells. Biochem J. 1990;265:503–509. doi: 10.1042/bj2650503. [DOI] [PMC free article] [PubMed] [Google Scholar]
- 13.Warburg O. On the Origin of Cancer Cells. Science. 1956;123:309–314. doi: 10.1126/science.123.3191.309. [DOI] [PubMed] [Google Scholar]
- 14.Gatenby RA, Kessler HB, Rosenblum JS, Cola LR, Moldofsky PJ, Hartz WH, Broder GJ. Oxygen distribution in squamous cell carcinoma metastases and its relationship to outcome of radiation therapy. Int J Radiat Oncol Biol Phys. 1988;14:831–838. doi: 10.1016/0360-3016(88)90002-8. [DOI] [PubMed] [Google Scholar]
- 15.Hockel M, Schienger K, Aral B, Milze M, Schaffer U, Vaupel P. Association between tumor hypoxia and malignant progression in advanced cancer of the uterine cervix. Cancer Res. 1996;56:4509–4515. [PubMed] [Google Scholar]
- 16.Dewhirst MW. Relationships between cycling hypoxia, HIF-1, angiogenesis and oxidative stress. Radia Res. 2009;172:653–665. doi: 10.1667/RR1926.1. [DOI] [PMC free article] [PubMed] [Google Scholar]
- 17.Goda F, O'Hara JA, Rhodes ES, Liu KJ, Dunn JF, Bacie G, Swartz HM. Changes of oxygen tension in experimental tumors after a single dose of X-ray irradiation. Cancer Res. 1995;55:2249–2252. [PubMed] [Google Scholar]
- 18.Bratasz A, Pandian RP, Deng Y, Petryakov S, Grecula JC, Gupta N, Kuppusamy P. In vivo imaging of changes in tumor oxygenation during growth and after treatment. Magn Reson Med. 2007;57:950–959. doi: 10.1002/mrm.21212. [DOI] [PMC free article] [PubMed] [Google Scholar]
- 19.Matsumoto K, Subramanian S, Devasahayam N, Aravalluvan T, Murugesan R, Cook JA, Mitchell JB, Krishna MC. Electron paramagnetic resonance imaging of tumor hypoxia: enhanced spatial and temporal resolution for in vivo pO2 determination. Magn Reson Med. 2006;55:1157–1163. doi: 10.1002/mrm.20872. [DOI] [PubMed] [Google Scholar]
- 20.Matsumoto S, Hyodo F, Subramanian S, Devasahayam N, Munasinghe J, Hyodo E, Gadisetti C, Cook JA, Mitchell JB, Krishna MC. Low-field paramagnetic resonance imaging of tumor oxygenation and glycolytic activity in mice. J Clin Invest. 2008;118:1965–1973. doi: 10.1172/JCI34928. [DOI] [PMC free article] [PubMed] [Google Scholar]
- 21.Yasui H, Matsumoto S, Devasahayam N, Munasinghe JP, Choudhuri R, Saito K, Subramanian S, Mitchell JB, Krishna MC. Low-field magnetic resonance imaging to visualize chronic and cycling hypoxia in tumor-bearing mice. Cancer Res. 2010;70:6427–6436. doi: 10.1158/0008-5472.CAN-10-1350. [DOI] [PMC free article] [PubMed] [Google Scholar]


