Abstract
Reaction–diffusion computational models of cardiac electrophysiology require both dynamic excitation models that reconstruct the action potentials of myocytes as well as datasets of cardiac geometry and architecture that provide the electrical diffusion tensor D, which determines how excitation spreads through the tissue. We illustrate an experimental pipeline we have developed in our laboratories for constructing and validating such datasets. The tensor D changes with location in the myocardium, and is determined by tissue architecture. Diffusion tensor magnetic resonance imaging (DT-MRI) provides three eigenvectors ei and eigenvalues λi at each voxel throughout the tissue that can be used to reconstruct this architecture. The primary eigenvector e1 is a histologically validated measure of myocyte orientation (responsible for anisotropic propagation). The secondary and tertiary eigenvectors (e2 and e3) specify the directions of any orthotropic structure if λ2 is significantly greater than λ3—this orthotropy has been identified with sheets or cleavage planes. For simulations, the components of D are scaled in the fibre and cross-fibre directions for anisotropic simulations (or fibre, sheet and sheet normal directions for orthotropic tissues) so that simulated conduction velocities match values from optical imaging or plunge electrode experiments. The simulated pattern of propagation of action potentials in the models is partially validated by optical recordings of spatio-temporal activity on the surfaces of hearts. We also describe several techniques that enhance components of the pipeline, or that allow the pipeline to be applied to different areas of research: Q ball imaging provides evidence for multi-modal orientation distributions within a fraction of voxels, infarcts can be identified by changes in the anisotropic structure—irregularity in myocyte orientation and a decrease in fractional anisotropy, clinical imaging provides human ventricular geometry and can identify ischaemic and infarcted regions, and simulations in human geometries examine the roles of anisotropic and orthotropic architecture in the initiation of arrhythmias.
Keywords: cardiac arrhythmia, myocardium, computational modelling, diffusion tensor magnetic resonance imaging, optical imaging
1. Introduction
The regular rhythmic pumping of the heart, driven by contractions triggered by propagating waves of excitation, sustains the circulation throughout our lives. Loss of this rhythm, as in cardiac arrhythmias, can be catastrophic. Atrial arrhythmias are associated with morbidity, increasing the likelihood of stroke, while ventricular arrhythmias are associated with sudden cardiac death [1]. Ventricular fibrillation (VF) is the most common cause of mortality from cardiovascular disease in the industrialized world, and almost invariably occurs during the process of dying. VF in the ventricles results in loss of their normal synchronized rhythmic beating. Experimental and computational evidence supports the idea that VF is produced by rapid, self-sustained and spatio-temporally irregular excitation of the ventricles by re-entrant waves, in which waves of excitation propagate through, away from, and back into the same piece of tissue [2]. Re-entrant waves have been idealized in homogeneous isotropic excitable media by two-dimensional spiral and three-dimensional scroll waves [3] that break down into the spatio-temporal irregularity of clinical and experimental VF [4].
Clinical studies of the mechanisms of VF are limited, as the urgent necessity for treatment precludes more detailed investigations, and so are mostly observations and quantification of the electrical activity of the heart recorded on the body surface as a single or multi-channel electrocardiogram, or by mapping electrophysiological activity during laboratory investigations [5–7]. Experimental studies are generally restricted to mapping electrical activity on the ventricular surfaces [4,8], or to multiple plunge electrodes within the heart [9–11]. Major advances have been achieved through the simultaneous mapping in vitro of endocardial and epicardial activity in slabs of ventricular tissue [12], mid-myocardial measurements from exposed transmural surfaces [13], or using transillumination [14,15], optrodes [16] or dual excitation wavelength epi-fluoresence [17], and the panoramic mapping of activity over the surface of the entire heart [18,19]. These optical methods, developed on experimental preparations using various species, have recently been applied to the ex vivo human heart [20,21]. More recently, novel optical methods have been proposed that allow the recording of propagating activity within the ventricular wall and that achieve depth-resolved optical imaging using tomographical approaches [22–25]. Theory, experiments and clinical studies all lead to an explanation of ventricular excitation and arrhythmias in terms of the hidden spatio-temporal patterns of propagation within the ventricular wall.
Virtual cardiac tissues have proved to be an effective tool for reconstructing and dissecting cardiac propagation patterns, and for proposing hypotheses that can be tested experimentally (e.g. the reviews by Benson et al. [26], Clayton et al. [27], Holden et al. [28] and Vigmond et al. [29]). Cardiac tissue is composed of muscle cells (myocytes), other supporting cells (fibroblasts), connective tissue and its blood and nerve supply. The myocytes (and perhaps also the fibroblasts) are coupled via low-resistance pathways, and so electrical activity spreads through the tissue. Propagation, at the cell-to-cell level via current flow through gap junctions, is inherently discontinuous [30,31]. However, at the millimetre scale, propagation recorded electrophysiologically or via voltage-sensitive dyes appears continuous and can be modelled by a continuous, monodomain excitable medium. This continuum behaviour, produced by tight coupling of discrete cells into a functional syncytium, can be represented by a reaction–diffusion equation,
| 1.1 |
where V is the membrane potential (mV), t is the time (ms), ∇ is a spatial gradient operator, D is the electrical diffusion coefficient tensor (mm2 ms−1) that characterizes the electrotonic spread of voltage and Iion is the total membrane ionic current density (µA/µF). The heterogeneity of the heart—spatial differences in cell electrophysiology and protein expression—can be mapped and incorporated in equation (1.1) as spatially varying parameters. The electrical diffusion tensor D is defined within the geometry of the heart and changes with location in the ventricles: it is determined by the tissue architecture, principally the average myocyte orientation at any given location.
The main purpose of this review article is to illustrate an experimental ‘pipeline’ for small mammalian hearts we have developed in our laboratories, from ventricular cell electrophysiology, optical mapping of spatio-temporal cardiac tissue electrophysiology, magnetic resonance imaging (MRI) of cardiac geometry, diffusion tensor MRI (DT-MRI) of cardiac anisotropy and orthotropy and computational simulation of electrophysiological and opto-electrophysiological activity in the same heart. This is placed in the context of related work in other laboratories, to our developments in optical and high angular resolution MRI and to applications related to clinical imaging.
2. Constructing ventricular tissue models
In this section, we detail the experimental and computational ‘pipeline’ we use to construct and partially validate models for D for ventricular tissue, using a rat heart as an example. We first describe the anatomy of ventricular tissue, then show examples of cardiac architecture measured using DT-MRI. We show how we can use optical monitoring of the surface electrical activity on these hearts to obtain data showing details of electrical wave propagation, before describing how we use these DT-MRI and optical mapping data to construct and partially validate the ventricular tissue models. Note that all components of the pipeline can be carried out on a single heart, starting with optical mapping, followed by MRI and DT-MRI, then histology, before construction of the computational model. Thus, the data obtained from the experimental studies are very specific for the computational model, and can therefore allow a very direct validation.
2.1. Cardiac anatomy, magnetic resonance imaging and histology
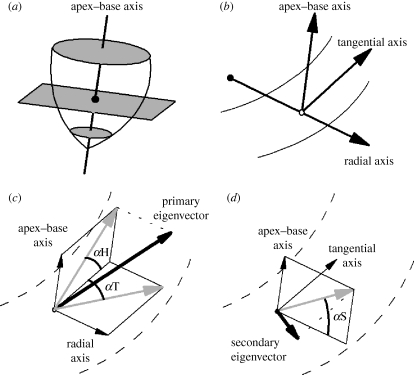
There is still controversy about the organization of myocytes within the myocardium, in sheets, and about the large-scale organization of the ventricular wall, into bands [32]. Ventricular muscle cells (myocytes) are elongated cells, from 50 to150 µm in length and 10 to 20 µm in diameter, and have more end-to-end than transverse connections with neighbouring cells via intercalated discs [33,34]. Being long extended cells, myocytes posses a principal orientation given by the long axis of the cell, and the orientation in three dimensions can be specified by a pair of angles (figure 1). The local average orientation is given by two ‘fibre’ angles—the fibre helix angle and the fibre transverse angle—with respect to a cylindrical coordinate system (around the centroid of the left ventricle). The helix angle is the angle between the transverse plane and the projection of principal orientation onto the circumferential–longitudinal plane, while the transverse angle is the angle between the circumferential–longitudinal plane and the projection of the principal orientation onto the transverse plane. Although intercellular action potential propagation is a discrete process, propagating activity in cardiac tissue (monitored optically or via electrodes) appears to be smooth at larger scales, and can be characterized by a propagation velocity. The propagation velocity is faster along the orientation of the cells. Propagation velocities for ventricular tissue are approximately 20–70 cm s−1 [9], and so the wavefront (from resting potential to the peak of the action potential, in approx. 2 ms) is approximately 1 mm, requiring spatial discretization of approximately 0.2 mm—larger than the cell size but the same order of magnitude. The cardiac geometry within which equation (1.1) is solved requires the same resolution and assumes that the cardiac structure is smooth, so the effects of tissue granularity (cellular boundaries, connective tissue and blood vessels) are averaged out.
Figure 1.
Coordinate and angle system used to describe fibre and sheet orientations in the heart. (a) A base–apex axis is fitted to the centre of the left ventricle. This axis is normal to the transverse plane, shown in grey. The centroid for each slice is the location where the apex–base axis intersects the transverse plane, and is shown as a filled circle. (b) For each voxel (shown here as an open circle), three orthogonal reference axes are defined. The base–apex axis is parallel to that defined previously, the radial axis passes through the centroid and the voxel, and the tangential axis lies in the transverse plane perpendicular to the other two axes. (c) The fibre helix (inclination) angle αH and the fibre transverse angle αT. (d) The sheet angle αS. In (c,d), the DT-MRI eigenvector is shown in bold; projections of this eigenvector are in grey.
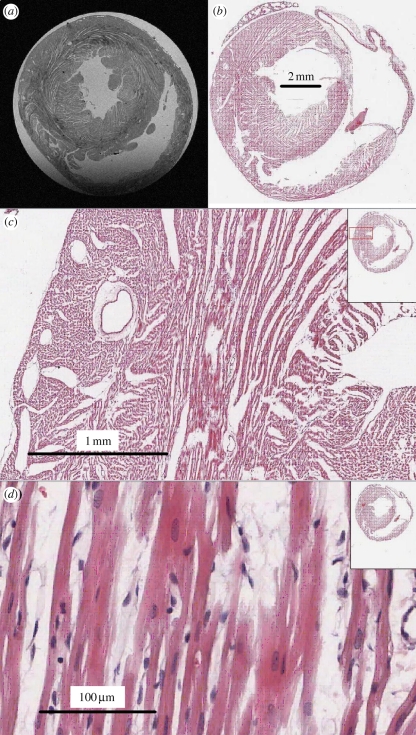
Three-dimensional tissue architecture can be reconstructed from digitized histological sections, but sectioning, fixing and staining can introduce distortions, fractures and changes in volume. MRI provides a non-destructive means of obtaining the three-dimensional architecture of soft tissue, at a resolution of approximately 1–5 mm isotropic for 1.5–3 T clinical systems and approximately 0.025–0.5 mm isotropic for 9–11 T systems, and the imaging protocol can be modified to enhance contrast between specific tissue types. Figure 2a shows a 30 µm magnetic resonance image of a short-axis section through a rat heart: individual cells are not discernible at this resolution, but cleavage planes are clearly visible. LeGrice et al. [35] proposed an organization of the fibres into a laminar structure with cleavage planes that ran radially from the endocardium to the epicardium and, when viewed in a long-axis transmural plane, could be seen to shift from a base–apex direction near the apex through to an apex–base direction in basal regions. Three-dimensional histology has demonstrated that rat myocytes are grouped in layers three or four cells thick (referred to as sheets) separated by cleavage planes [36]. Figure 2b–d shows successive magnifications of a histological section, with branching sheets about 100 µm thick and the nuclei of the myocytes, oriented along the myocyte orientation, clearly visible. From figure 2c,d it seems self-evident that propagation will be anisotropic, and faster along the local myocyte orientation; it does not seem self-evident that propagation will be reasonably smooth. However, the width of the sharp wavefront of the action potential is approximately 1 mm and so encompasses all the tissue seen in figure 2c,d. In figure 2, the fine-scale tissue structure, the penetration of the myocardium by its vascular supply, as well as its sheet-like structure are clearly evident. The sheet organization influences the direction of propagation [10], and the fine-scale vascular structure provides obstacles that can anchor re-entrant waves, prolonging re-entrant arrhythmias [37].
Figure 2.
Magnetic resonance image and histology of a short-axis section of rat ventricular myocardium illustrating cleavage planes. (a) Magnetic resonance image, obtained using a 9.4 T Bruker (Ettlingen, Germany) spectrometer with a 12.6 mm square field of view and 30 × 30 µm square pixels in the short-axis plane, with 0.25 µm in the z-direction. (b–d) Histological sections through the short axis of a rat heart, illustrating cleavage planes. Images courtesy of A. Radjenovic, E. White, D. Benoist, J. Ainscough and S. Tanner, University of Leeds.
Bishop et al. [38] have used MRI to construct a 1024 × 1024 × 2048 dataset of 25 µm voxels for the geometry of a rabbit heart, which was downsampled and segmented. Myocyte orientation was introduced into this geometry by a rule-based approach based on a mathematical model for the canine data of Streeter et al. [39], and normal and arrhythmic excitation patterns were compared in the high-resolution and simplified smoothed geometries. Although both exhibited qualitatively the same behaviours, the detailed geometry altered the evolution and the lifespan of re-entrant arrhythmias, and therefore detailed, individual cardiac geometries are necessary for the quantitative prediction of arrhythmias in hearts with normal and pathological electrophysiology.
2.2. Diffusion tensor magnetic resonance imaging
DT-MRI has been applied extensively to study the myocardial structure in ex vivo fixed or viable tissues. MRI measurements of the diffusion profile of protons (Brownian motion of water) in tissue are fitted by an ellipsoid [40] with three orthogonal axes. The primary axis (the orientation of the largest eigenvector) has been validated as an unbiased estimate of the local (averaged within the voxel) myocyte orientation [41,42]. The orientation of the tertiary (smallest eigenvector) axis has been proposed as a measure of the orientation of the sheet normal, but the existence of sheets is contested [43] and this is less well validated against histology [42]. From figure 2, it is clear that a (25 µm3) voxel may contain branching myocytes or myocytes with different orientations, and a (100 µm3) voxel could contain multiple sheet orientations.
The helical organization of ventricular cell orientation over the surface of the ventricles, and the smooth transmural change in helix angle, rotating through approximately 160° (the range depending on the phase of contraction, location and species) has been found in all normal foetal and adult mammalian hearts that have been examined, and is a necessary consequence of topology and continuity of fibre orientation in an idealized contracting ventricle [44]. Deviations from this organization may be used to localize pathology.
Fractional anisotropy (FA) is a measure of the anisotropy of diffusion at a particular voxel within the tissue (i.e. whether the primary eigenvector or local average cell orientation is well determined) and can be calculated at each voxel throughout a tissue using
 |
2.1 |
where λ1, λ2 and λ3 are the primary, secondary and tertiary eigenvalues of the diffusion tensor, respectively [45,46]. A value of FA = 0 indicates isotropy of diffusion (i.e. the magnitude of diffusion is the same in all directions, and so λ1 = λ2 = λ3), while a value of FA = 1 indicates cylindrically symmetrical anisotropy, where λ1 ≫ λ2 = λ3. The mean FA estimated from DT-MRI datasets of the entire ventricles ranges from 0.25 for the dog [47] to 0.35 for the goat [48], and the mean FA for the human ventricular tissue wedge shown in §3.3 is 0.29. The FA can also provide a measure of pathology, as a decrease in FA is a loss of the local anisotropic architecture, and the anisotropic architecture underlies the spatial pattern of excitation and propagation.
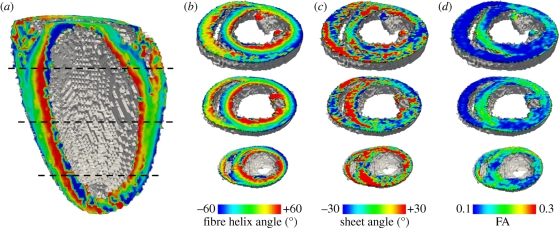
Figure 3 illustrates the architecture of a rat heart obtained from a diffusion-weighted spin-echo protocol on a Bruker (Ettlingen, Germany) 9.4 T spectroscope, in terms of the myocyte ‘fibre’ orientation as the helix angle (figure 1c), and the orientation of sheets or the cleavage planes between them (figure 1d). The heart was retrogradely perfusion fixed with 4 per cent formaldehyde, after inducing myocardial relaxation by perfusing with Tyrode solution containing 0 mM calcium and 10 mM 2,3-butanedione monoxime (BDM). The ventricles were not filled as we have demonstrated elsewhere that this can result in overfilling artefacts [49]. This results in a heart fixed in a geometry similar to end-diastole. The smooth transmural change of the helix angle is clearest in the left ventricular wall and septum, and there is a similar, but more irregular in long-axis sections, change through the right ventricular wall. The ‘sheet’ structure is more complex and irregular (see [32] for a review). The FA throughout the ventricular walls, septum and papillary muscle is generally between 0.1 and 0.2, with lower values at the boundaries.
Figure 3.
Architecture of rat heart visualized from DT-MRI with 0.2 mm isotropic voxels. (a,b) Transmural rotational anisotropy, visualized by a local average cell angle of inclination, or helix angle, estimated from the primary eigenvector. (c) ‘Sheet’ angle estimated from the secondary and tertiary eigenvectors. (d) Fractional anisotropy, computed from eigenvalues at each voxel by equation (2.1).
2.3. Optical mapping
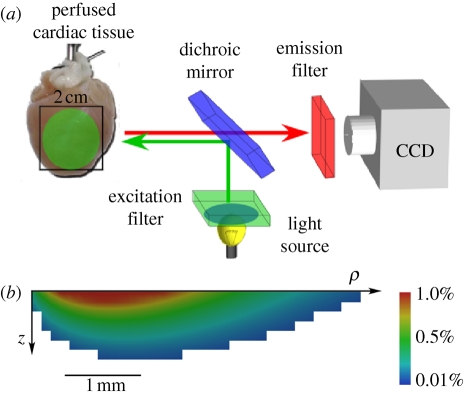
The application of voltage-sensitive dyes allows the visualization of spatio-temporal electrical activity in isolated perfused cardiac tissue and hearts, in which contraction is usually blocked by an excitation–contraction decoupler (see Efimov et al. [50] for a review). This results in a stationary heart with a geometry similar to end-diastole. Optical imaging using such dyes has allowed the quantitative study of the organization and the development of cardiac arrhythmias in isolated hearts [4,8]. Voltage-sensitive dyes can be introduced through coronary flow in perfused tissue preparations or by superfusion in smaller tissue samples. They bind to cardiac cell membranes and respond to changes in membrane potential by changes in their excitation and emission spectra. Spatio-temporal data acquisition of fluorescence is usually achieved by photodiode arrays or charge-coupled device (CCD) cameras. Contemporary CCD cameras readily allow high sampling rates (2 kHz and more) combined with superior spatial resolution. In conventional epi-fluorescence imaging of a perfused heart, both the light source for excitation of the dye and the detector are aimed at the epicardial surface. Figure 4a depicts schematically a typical epi-fluorescence set-up on Langendorff perfused hearts. Although fluorescence is obtained from the epicardial surface, significant contributions to the fluorescent signal originate from deeper myocardial layers owing to the optical scattering and absorptive properties of tissue with respect to visible light [51–55]. The epi-fluorescence signal is therefore blurred compared with the epicardial electrical activity, which is exemplified by the slower rate of rise of the optical action potential upstroke. For the commonly used voltage sensitive dye Di-4-ANEPPS, with excitation in the blue–green range of the spectrum and aquisition in the orange–red range, the surface optical signals contain components from up to 1 mm below the epicardium [56,57]. Figure 4b shows the computed subsurface contributions to the optical signal at a single surface pixel, using a hybrid modelling approach that couples the electrophysiological model described by equation (1.1) with an optical Monte Carlo model for photon propagation in tissue. Signals from 1 mm deep contribute to the optical signal; longer wavelength light (near infrared) is less prone to scattering and absorption, and so novel near-infrared voltage-sensitive dyes [58–60] with longer excitation wavelengths allow for imaging deeper layers in cardiac tissue [17]. These intramural components to the epi-fluorescence signal can be exploited to provide information about propagation direction within the heart wall [54,61]. The shape of the optically recorded action potential upstroke depends on the orientation of the wavefront: the optical upstroke is fastest near the top of the action potential for waves propagating towards the imaged surface, whereas the faster portion of the upstroke is located near the foot of the action potential when the wave propagates away from the imaged surface. Since myocardial architecture plays a major role in determining the direction of wave propagation, this technique can be used to indirectly relate intramural activation patterns to structure [17,54,62].
Figure 4.
Optical mapping of surface spatio-temporal activity. (a) Epi-fluorescence optical mapping of Langendorff perfused heart. (b) Simulation of the subsurface tissue contribution to the surface optical signal for Di-4-ANEPPS, from a rotationally anisotropic transmural slab of depth 5 mm and radius 10 mm. Scale bar indicates the percentage contribution of each pixel to the total signal recorded from the top left pixel on the epicardial surface.
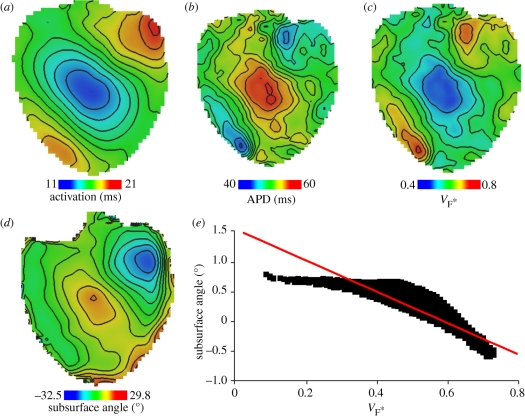
Figure 5 shows epi-fluorescence optical mapping data obtained from a rat heart that was subsequently imaged using DT-MRI (figure 3). The heart was stimulated on the left ventricular mid-free wall using an epicardial bipolar electrode. Figure 5a shows the activation map on which the anisotropic spread of activation can clearly be seen. Figure 5b shows the corresponding action potential duration (APD) map, where significant modulation of APD by the activation sequence can be observed as described previously [17,63]. Figure 5c depicts a so-called  -map, where
  is the fractional level at which the optical upstroke reaches a maximal derivative. As shown in previous studies [54,57,61],
  can be used to infer the average subsurface wavefront orientation shown in figure 5d. The subsurface angle is positive for waves propagating away from the epircardial surface and negative for waves propagating towards the epicardium. This pattern of intramural wave propagation following epicardial stimulation is consistent with the transmural rotational anisotropy presented in figure 3 [64,65]. Figure 5e shows the relationship between
  and the subsurface wavefront orientation which was used to generate figure 5d, and which was calculated using detailed photon migration models [57]. These experiments provide data that can be used to quantitatively validate the computational model for propagation in a heart with the same anisotropic and orthotropic geometry, reconstructed from DT-MRI. The pattern of irregular arrhythmic activity in the same heart can only be semiqualitatively validated, in terms of dominant frequencies and measures of irregularity [66].
Figure 5.
Surface maps imaged using Di-4-ANEPPS following epicardial point excitation in an isolated perfused rat heart. (a) Activation time. (b) Corresponding APD map. (c)  estimated from optical action potentials at each pixel. (d) Subsurface angle, computed assuming transmural rotational anisotropy in the visualized geometry. (e) Relationship between subsurface angle and
  used for panel (d) and obtained using detailed photon migration models. Red line is the linear regression for steady-state wavefronts obtained using line excitation.
2.4. Models of ventricular geometry and simulations
The histologically validated data obtained from DT-MRI describing cardiac structure, along with the data from optical mapping studies describing propagation in these hearts, can now be used to construct the partially validated geometric models of the ventricles. Using the eigenvectors and eigenvalues obtained from DT-MRI, the electrical diffusion tensor (D in equation (1.1)) at a particular point in space is given by
| 2.2 |
where D1 is the electrical diffusion along the fibre axis, D2 is the electrical diffusion in the sheet plane perpendicular to the fibre axis, D3 is the electrical diffusion normal to the sheet plane, the vectors ei are the eigenvectors from DT-MRI, and the superscript T denotes the vector transpose. If the secondary and tertiary DT-MRI eigenvalues are similar then the tissue has an anisotropic or axially isotropic structure (i.e. there is a fibre orientation but no evidence of a laminar, or sheet, structure), but if all three eigenvalues are distinct then the tissue has an orthotropic structure where the fibres are arranged into a laminar, or sheet, architecture. For simulations, the values Di will be dependent on the choice of the model used to give Iion in equation (1.1), and are scaled in the fibre and cross-fibre directions for anisotropic simulations (or fibre, sheet and sheet normal directions for orthotropic tissues) so that simulated conduction velocities match experimentally estimated values (e.g. from optical imaging experiments). Because of the paucity of experimental studies examining orthotropic propagation, most previous computational studies have used an axially isotropic architecture.
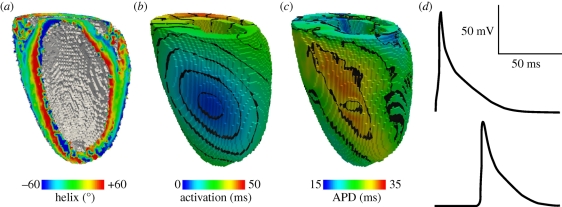
Figure 6 shows activation time and APD surface maps, computed within a rat anisotropic geometry (fibre structure only, no sheet structure) obtained using DT-MRI, and with excitation (i.e. Iion in equation (1.1)) given by the rat ventricular model of Pandit et al. [67], for epicardial excitation at a point analogous to that for figure 5. Space steps were 0.2 mm isotropic as defined by the DT-MRI dataset, and equation (1.1) was solved with a forward-time centred-space method using an operator splitting technique and an adaptive time step (see [26,68] for details). The qualitative similarity between the experimental and computed maps—compare figures 5a,b and 6b,c—provides a partial validation for our computational models where geometry and architecture are constructed using data obtained from DT-MRI. Such whole-ventricle models can therefore be used to quantitatively evaluate arrhythmic mechanisms, in the presence of a realistic anisotropic cardiac architecture and the corresponding effects that this anisotropy has on electrical wave propagation (e.g. [26,38,68–71]).
Figure 6.
Simulation of homogeneous, anisotropic electrical activity (i.e. assuming a single cell type and fibre structure only, no sheets) in a rat geometry obtained using DT-MRI, with (0.2 mm3) voxels. (a) Fibre helix angle. (b) Computed activation times for an epicardial stimulation analogous to that in figure 5. (c) Corresponding APDs. (d) Action potentials recorded from voxels with early (top) and late (bottom) activation times. Note the modulation of the action potential morphology by the activation sequence in the electrically homogeneous domain—later activation times result in decreased APDs.
As the laminar architecture of the heart is studied in more detail, the influence of sheet structure on cardiac electrical wave propagation has begun to be examined experimentally. Caldwell et al. [9] have recently used high-density electrical mapping to show that propagation in the pig ventricular wall is orthotropic, with maximum conduction velocities of approximately 70 cm s−1 aligned to the myocyte axis, 30 cm s−1 parallel to the myocyte layers and 20 cm s−1 normal to the layers. As these experimental results emerge, it becomes possible to incorporate the data into computational models such as those described here, and to use the models to study the influences of sheet structure on propagation; in particular, how orthotropic ventricular structure affects degeneration of normal sinus rhythm into an arrhythmic state—first into ventricular tachycardia then into fibrillation (see §3.3).
3. Future outlook
In this section, we describe several techniques we are currently using in our laboratories to enhance components of the pipeline described above, or to allow the pipeline to be applied to different areas of research. We describe: Q ball imaging (QBI), segmentation of infarcted tissue within the ventricular geometry, the construction and use of human ventricular models and translation of our research into a clinical setting.
3.1. Going beyond diffusion tensor magnetic resonance imaging: Q ball imaging of fibres
Within a (100 µm3) voxel there can be approximately 100 myocytes, with differing orientations, but these orientations will all be similar if the helix angle is changing smoothly with distance. In figure 2a close apposition between tissue with in-plane (extended) and normal to plane (circular) ‘bundles’ clearly occurs, and so, at these boundary zones, a voxel can contain myocytes with orientations that differ by approximately 90°. Because DT-MRI approximates the anisotropy content of a voxel by an ellipsoid shape, it is unable to resolve heterogeneity within a voxel, even though the sample is probed at length scales typical for the diffusion processes (micrometre). Moreover, the voxel size for DT-MRI cannot be decreased below approximately 100 µm on present-day clinical systems, as the signal strength drops according to the voxel volume. To estimate multi-modal diffusion within a voxel, high angular resolution diffusion imaging techniques have been developed.
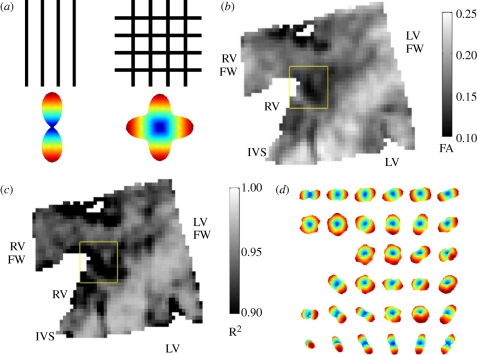
A particularly efficient diffusion MRI protocol called QBI was designed to track the crossing of axonal fibres in the central nervous system [72] and has recently been applied to ventricular architecture [73]. QBI uses a standard DT-MRI spin-echo sequence for diffusion-weighted imaging, but with multiple (162 for figure 7) gradient directions rather than the six required for DT-MRI. Although the acquisition time rises proportionally with the number of diffusion-weighted images, QBI scan times are relatively low when compared with other diffusion techniques that collect data at varying diffusion weighting strengths [74]. The additional angular information gathered in a QBI scan can be used to produce a so-called orientation distribution function (ODF) that reflects the probability of a fibre within the voxel being oriented in a particular direction, as illustrated in figure 7. Various studies in brain and muscular tissues have validated that, in voxels containing a single fibre population, the direction in which the ODF reaches its maximum value indeed shows good quantitative agreement with the primary DT eigenvector (see [75] for a review). However, approximately 10 per cent of ventricular voxels showed multiple peaks in the ODF; therefore, falling outside the scope of DT-MRI. Figure 7d zooms in on such a region in the posterior left–right ventricular fusion site of a canine heart, where complex fibre organization is observed. Within the DT-MRI formalism, this region is found to exhibit a markedly low FA together with a poor goodness-of-fit for the diffusion ellipsoid (figure 7b,c). In summary, QBI and DT-MRI techniques show good quantitative agreement, but QBI shows intravoxel heterogeneity in an orientation that cannot be resolved with the conventional diffusion tensor formalism, which only gives a single average orientation. The influence of this complex architecture on wave propagation within the heart is yet to be elucidated.
Figure 7.
Q ball imaging (QBI) of ventricular myofibre architecture. (a) The reconstructed intravoxel fibre distributions (ODFs) for two voxels with one or multiple fibre orientation. (b) Fractional anisotropy in the posterior fusion site of a canine heart. (c) Goodness-of-fit (R2-coefficient) for the tensor approximation in the same region. (d) Reconstructed intravoxel ODFs from QBI (using Laplace–Beltrami sharpening) showing complex fibre arrangement in the central region of the fusion site. Imaged with a spin-echo protocol using TR/TE = 1800/15 ms, Δ = 7 ms, δ = 2 ms, b = 3000 s mm−2; spatial resolution 0.4 × 0.4 × 1.0 mm. The region of interest shown in panels (b,c) is 4.4 × 4.4 mm.
3.2. Going beyond the healthy heart: infarction
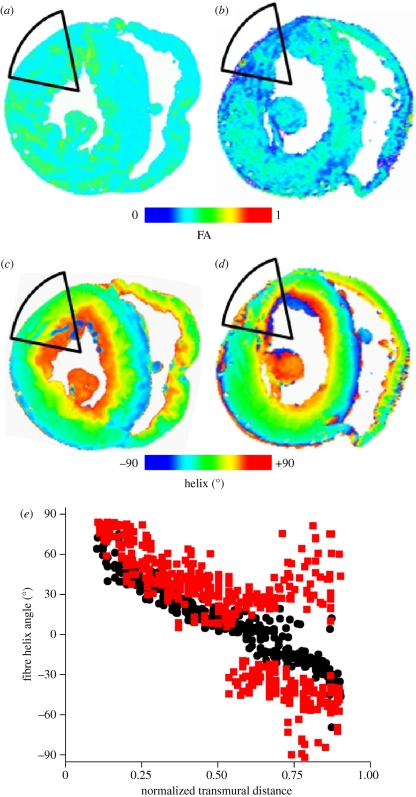
As well as examining normal cardiac structure, DT-MRI can also be used to identify and segment pathological cardiac tissue—FA, for example, has been used to segment infarcted tissue [76]. Figure 8 illustrates this for an infarct produced by coronary artery ligation in a rabbit. In the infarcted heart (eight weeks after coronary ligation surgery), the subendocardium was well preserved, but the helix angle of the infarct region has greater variability. A greater variability of the fibre angle in infarcted tissue has also been observed for infarcts in pig [77] and mouse [78] hearts. FA images show the infarct not as a single compact mass but composed of islands of tissue with low FA, similar to the organization of an infarct seen histologically [79] and in DT-MRI [74]. The increased disorder in the helix fibre angle is associated with a decreased anisotropy, and both are characteristic of the infarct. Infarcted myocardium has been shown to have decreased diffusion anisotropy [80] and so the low FA could be used to segment infarcted tissue for computational simulation, as in Jie et al. [81].
Figure 8.
(a,b) Fractional anisotropy and (c,d) helix fibre angle in normal and infarcted rabbit hearts, eight weeks after coronary artery ligation. (e) Helix angle from the infarct zone and the corresponding basal interpapillary muscle region of a normal rabbit heart. Transmural distance is normalized to the ventricular wall thickness, and is from endocardium (0) to epicardium (1). Black circles, normal; red squares, infarct.
3.3. Going beyond the animal heart: models of the human ventricles
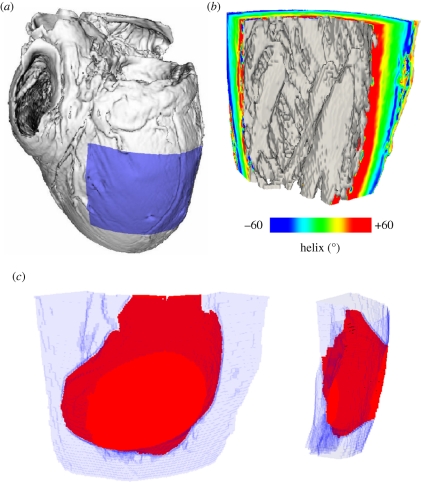
Figure 9 extracts a slab of the left ventricular free wall from a DT-MRI dataset for a human heart, in order to show the effects on propagation of a complex orthotropic architecture. Note the intricate structure of the endocardial surface, here shaded in grey, and that the helix angle, determined from the DT-MRI primary eigenvector and visualized here on the cut surfaces of the wedge, shows a smooth transmural rotation of approximately 120°. Figure 9c shows the spread of excitation within this orthotropic architecture at 60 ms following epicardial excitation: for this simulation, endocardial, mid-myocardial and epicardial tissue occupied approximately equal fractions of the transmural distance, Iion in equation (1.1) was given by the human ventricular model of Ten Tusscher et al. [82] and the electrical diffusion tensor D was constructed using equation (2.2) to give orthotropic conduction velocities in the ratio 6 : 3 : 1 with 70 cm s−1 in the fibre direction. Note that the architecture of the ventricular wall results in complex wavefront geometries owing to the rotational orthotropy inherent in the tissue. Both transmural and basal–apical changes in orthotropy are evident, as the propagation wavefront is not scalene ellipsoidal, and reaches the basal (top) extent of the geometry before the apical (bottom) extent [68].
Figure 9.
(a) Visualization of the human DT-MRI dataset geometry (see acknowledgements). The shaded area indicates the spatial extent of the wedge extracted from the left ventricular free wall. (b) View of the wedge geometry and fibre helix angle from an endocardial aspect. (c) Wavefront isosurface at 60 ms following epicardial excitation of human left ventricular free wall. The spatial extent of the wedge geometry is indicated in light blue; excited tissue is in red.
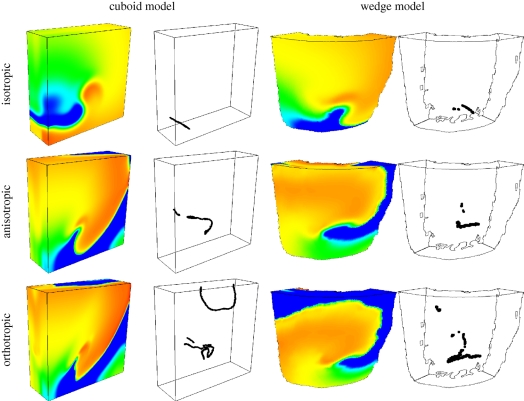
Further examples of the influence of orthotropic cardiac tissue architecture on electrical wave propagation (this time re-entrant waves, which are associated with ventricular tachycardia) are shown in figure 10, which illustrates two models of the left ventricular free wall: one a simple cuboid with a rule-based architecture, and one a wedge model with geometry and architecture obtained from DT-MRI, as in figure 9. For the cuboid model, the fibre direction was parallel to the endocardial and epicardial surfaces and rotated 120° across the ventricular wall at a rate of 6° mm−1, and the sheet direction was always transmural. The cuboid model dimensions were 60 × 60 × 20 mm, roughly similar to the wedge model. Endocardial, mid-myocardial and epicardial tissue occupied approximately equal fractions of the transmural distance in both models, and Iion was given by the model of Ten Tusscher et al. [82]. For each geometry, propagation of excitation was isotropic, anisotropic or orthotropic—corresponding to no architecture, fibre structure only (no sheet structure) and fibre and sheet structure, respectively. Figure 10 shows snapshots at t = 2 s of membrane potential on the surface of the model geometries (in all cases a single re-entrant scroll wave rotating anticlockwise, although the wave in the orthotropic cuboid model is on the verge of break-up) and corresponding filament locations (the organizing centres of the re-entrant scroll waves). There are both qualitative and quantitative differences in the dynamics of the re-entrant scroll waves in the different cardiac geometries and architectures, quantified by measuring the filament meander, length, curvature and twist [69]. For any given geometry (i.e. cuboid or wedge), changing the architecture by introducing anisotropic then orthotropic propagation results in changes to the filament meander pattern, increases in maximum filament length (from 27 to 60 mm in the wedge model), changes to the mean filament curvature (0.8–3.8 mm−1) and mean local filament twist (4.6–5.4° mm−1), and increases in the maximum total twist along a single filament (64–161°). Changes to the geometry also affect scroll wave dynamics, mainly owing to the intricate structure of the endocardial surface in the wedge model. All of these effects can lead to filament instability and breakdown, and a resulting degeneration of the arrhythmia from ventricular tachycardia into fibrillation [3]. Thus, future simulations of re-entry should take into account this complex geometry and orthotropic architecture.
Figure 10.
Snapshots of membrane potential and re-entrant scroll wave filament locations after 2 s of simulation in isotropic (no fibre or sheet structure), anisotropic (with fibre structure but without sheet structure) and orthotropic (with both fibre and sheet structure) cuboid and wedge models. Membrane potential is colour-coded using the standard rainbow palette, from blue (−70 mV) to red (30 mV). For both models, the snapshots are from an epicardial aspect, with the scroll wave rotating clockwise. The wedge dimensions are similar to those of the 60 × 60 × 20 mm cuboid.
3.4. Going beyond the animal heart: clinical imaging
Clinical cardiac magnetic resonance (CMR) imaging provides two-dimensional slices or three-dimensional datasets of the heart in any selected plane, at a typical spatial resolution of 2–3 mm [83], although higher resolution can be achieved. Gating allows images to be acquired at different times of the cardiac cycle, to produce cine-MRI of the beating heart for the assessment of ventricular volumes and contraction pattern. Strain can be estimated by tracking tagged images. The individual three-dimensional ventricular geometry that can be reconstructed from CMR imaging does not include any information about anisotropic or orthotropy: for patient-specific computational simulation this could be introduced by rule-based methods.
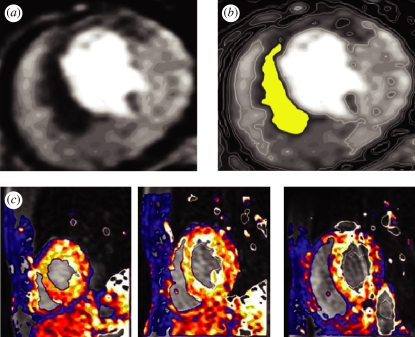
Ventricular localized ischaemia or myocardial infarction are common precursors of arrhythmias. Dynamic contrast-enhanced first-pass myocardial perfusion CMR tracks an intravenous injection of a bolus of gadolinium during vasodilator stress induced typically by adenosine. Ischaemic areas of ventricular tissue appear as underperfused and thus relatively dark tissue, as in figure 11a. For computational reconstruction, the poorly perfused tissue can be segmented as in figure 11b, and the ischaemic volume reconstructed: this gives a size, shape and location of the ischaemic tissue, within which the parameters of the cell electrophysiology model can be modified, as in Aslanidi et al. [84] and Benson et al. [85]. Myocardial perfusion CMR data (figure 11c) allow the estimation of local perfusion with a high temporal and spatial resolution. Using, for example, compartmental models for the kinetics of the dynamic myocardial signal, absolute myocardial perfusion can be estimated. Such quantitative, three-dimensional mapping of perfusion can be incorporated into computational models of electrophysiology, with reduced flow used as a measure to identify ischaemic tissue.
Figure 11.
Identification of ischaemic tissue in human ventricles by clinical cardiac magnetic resonance imaging. (a) First-pass stress perfusion images showing ischaemia (dark areas) in a patient with ischaemic heart disease. (b) The ischaemic area of panel (a) segmented by a simple threshold. (c) Visualization of ventricular myocardial perfusion in successive short-axis slices.
Persistent ischaemia can lead to myocardial infarction with changes in extracellular space and, in chronic myocardial infarcts, to fibrotic tissue. Both acute and chronic infarction increase the distribution volume of extracellular gadolinium-based contrast agents and can be identified by late gadolinium-enhanced CMR, which gives a high contrast between the normal and scar tissue, and so a sharp and unambiguous spatial localization of the scar that can act as an obstacle to propagation, or to pin re-entrant sources.
4. Conclusions
The normal sinus rhythm of the heart, re-entrant arrhythmias and fibrillation can all be described by the propagation of nonlinear waves in an excitable medium. Physiological and pathological patterns can be explained in terms of nonlinear wave properties—the dependence of velocity on rate by nonlinear dispersion, and breakdown from spatio-temporal patterned activity into irregularity by interactions between waves and by changes in wave stability. However, this emphasis on nonlinear wave dynamics neglects the overall architecture of the heart and its heterogeneities.
The anatomy of the heart—its size, shape and organization into chambers, and conducting pathways—provides the physical structure within which propagation occurs. For a quantitative computational description of propagation phenomena, this anatomy needs to be in the form of a dataset. Datasets have been constructed from DT-MRI for numerous mammalian species, or by histological methods. Anisotropy and orthotropy in conduction velocity and tissue conductivity can be interpreted in terms of fibre and sheet orientations, and can be incorporated as the diffusion tensor of a reaction–diffusion model, where the orientation of the component vectors has been obtained from DT-MRI or histologically. The scaling of the diffusion tensor of the reaction–diffusion model needs to be chosen to give the appropriate conduction velocities; these can be obtained by in vivo or in vitro optical mapping experiments.
Different parts of the myocardium have different electrophysiological properties—action potential shape, rate dependence and propagation velocity. These differences are produced by heterogeneities in expressed membrane proteins—differential expression of membrane channels, exchangers and pumps and proteins involved in intracellular calcium dynamics and excitation–contraction influence cell action potential properties and propagation, and differential expression of connexins alters cell-to-cell coupling and propagation velocities. Molecular mapping, by immunocytochemistry and quantitative PCR, can provide semiquantitative indices of these spatial distributions, but the spatial distribution of excitation properties needs to be calibrated and validated by spatial mapping of electrophysiology, say by optical methods. The heart muscle is not just composed of myocytes; there are also fibroblasts, connective tissue and intruding blood vessels, and, perhaps, scar tissue resulting from earlier damage. All these can contribute to non-excitable granularities, with length scales from 100 µm to centimetres, which can act as obstacles to propagation. These obstacles can interfere with propagation, by producing a site either for wave breaking or for pinning the free ends of re-entrant waves. High-resolution MRI can provide information about the location and distribution of these granular heterogeneities, and so they can be incorporated into computational models.
By combining all these structural (or parametric) heterogeneities into computational models of excitation, propagation can be explored and the resultant functional heterogeneities that are produced by slow recovery processes can emerge. Although the types of possible wave behaviours follow from the physics of excitable media, the details of the initiation and subsequent evolution of patterns of excitation in cardiac muscle depend on the details of geometry, anisotropic and orthotropic architecture and heterogeneities.
Acknowledgements
This work was supported by grants from MCRC Leeds (A.P.B., O.B.), BHF (S.P., G.L.S.), EPSRC (O.B., A.V.H.), MRC (A.P.B., S.H.G.), FWO Flanders (H.D.) and the European Union through the Network of Excellence BioSim Contract No. LSHB-CT-2004-005137 (AVH). We thank Drs Patrick A. Helm and Raimond L. Winslow at the Center for Cardiovascular Bioinformatics and Modelling and Dr Elliot McVeigh at the National Institute of Health for provision of the human DT-MRI dataset.
Footnotes
One contribution of 16 to a Theme Issue ‘Advancing systems medicine and therapeutics through biosimulation’.
References
- 1.Jalife J. 2000. Ventricular fibrillation: mechanisms of initiation and maintenance. Annu. Rev. Physiol. 62, 25–50 10.1146/annurev.physiol.62.1.25 (doi:10.1146/annurev.physiol.62.1.25) [DOI] [PubMed] [Google Scholar]
- 2.Vaquero M., Calvo D., Jalife J. 2008. Cardiac fibrillation: from ion channels to rotors in the human heart. Heart Rhythm 5, 872–879 10.1016/j.hrthm.2008.02.034 (doi:10.1016/j.hrthm.2008.02.034) [DOI] [PMC free article] [PubMed] [Google Scholar]
- 3.Fenton F., Karma A. 1998. Vortex dynamics in three-dimensional continuous myocardium with fiber rotation: filament instability and fibrillation. Chaos 8, 20–47 10.1063/1.166311 (doi:10.1063/1.166311) [DOI] [PubMed] [Google Scholar]
- 4.Gray R. A., Pertsov A. M., Jalife J. 1998. Spatial and temporal organization during cardiac fibrillation. Nature 392, 75–78 10.1038/32164 (doi:10.1038/32164) [DOI] [PubMed] [Google Scholar]
- 5.Codreanu A., et al. 2008. Electroanatomic characterization of post-infarct scars: comparison with 3-dimensional myocardial scar reconstruction based on magnetic resonance imaging. J. Am. Coll. Cardiol. 52, 839–842 10.1016/j.jacc.2008.05.038 (doi:10.1016/j.jacc.2008.05.038) [DOI] [PubMed] [Google Scholar]
- 6.Nash M. P., Mourad A., Clayton R. H., Sutton P. M., Bradley C. P., Hayward M., Paterson D. J., Taggart P. 2006. Evidence for multiple mechanisms in human ventricular fibrillation. Circulation 114, 536–542 10.1161/CIRCULATIONAHA.105.602870 (doi:10.1161/CIRCULATIONAHA.105.602870) [DOI] [PubMed] [Google Scholar]
- 7.Ramanathan C., Ghanem R. N., Jia P., Ryu K., Rudy Y. 2004. Noninvasive electrocardiographic imaging for cardiac electrophysiology and arrhythmia. Nat. Med. 10, 422–428 10.1038/nm1011 (doi:10.1038/nm1011) [DOI] [PMC free article] [PubMed] [Google Scholar]
- 8.Witkowski F. X., Leon L. J., Penkoske P. A., Giles W. R., Spano M. L., Ditto W. L., Winfree A. T. 1998. Spatiotemporal evolution of ventricular fibrillation. Nature 392, 78–82 10.1038/32170 (doi:10.1038/32170) [DOI] [PubMed] [Google Scholar]
- 9.Caldwell B. J., Trew M. L., Sands G. B., Hooks D. A., LeGrice I. J., Smaill B. H. 2009. Three distinct directions of intramural activation reveal nonuniform side-to-side electrical coupling of ventricular myocytes. Circ. Arrhythm. Electrophysiol. 2, 433–440 10.1161/CIRCEP.108.830133 (doi:10.1161/CIRCEP.108.830133) [DOI] [PubMed] [Google Scholar]
- 10.Hooks D. A., Trew M. L., Caldwell B. J., Sands G. B., LeGrice I. J., Smaill B. H. 2007. Laminar arrangement of ventricular myocytes influences electrical behavior of the heart. Circ. Res. 101, e103–e112 10.1161/CIRCRESAHA.107.161075 (doi:10.1161/CIRCRESAHA.107.161075) [DOI] [PubMed] [Google Scholar]
- 11.Li L., Jin Q., Dosdall D. J., Huang J., Pogwizd S. M., Ideker R. E. 2010. Activation becomes highly organized during long-duration ventricular fibrillation in canine hearts. Am. J. Physiol. 298, H2046–H2053 [DOI] [PMC free article] [PubMed] [Google Scholar]
- 12.Zaitsev A. V., Berenfeld O., Mirnov S. F., Jalife J., Pertsov A. M. 2000. Distribution of excitation frequencies on the epicardial and endocardial surfaces of fibrillating ventricular wall of the sheep heart. Circ. Res. 86, 408–417 [DOI] [PubMed] [Google Scholar]
- 13.Sharifov O. F., Ideker R. E., Fast V. G. 2004. High-resolution optical mapping of intramural virtual electrodes in porcine left ventricular wall. Cardiovasc. Res. 64, 448–456 10.1016/j.cardiores.2004.07.016 (doi:10.1016/j.cardiores.2004.07.016) [DOI] [PubMed] [Google Scholar]
- 14.Baxter W. T., Mironov S. F., Zaitsev A. V., Jalife J., Pertsov A. M. 2001. Visualizing excitation waves inside cardiac muscle using transillumination. Biophys. J. 80, 516–530 10.1016/S0006-3495(01)76034-1 (doi:10.1016/S0006-3495(01)76034-1) [DOI] [PMC free article] [PubMed] [Google Scholar]
- 15.Bernus O., Mukund K. S., Pertsov A. M. 2007. Detection of intramyocardial scroll waves using absorptive transillumination imaging. J. Biomed. Opt. 12, 014035. 10.1117/1.2709661 (doi:10.1117/1.2709661) [DOI] [PubMed] [Google Scholar]
- 16.Hooks D. A., LeGrice I. J., Harvey J. D., Smaill B. H. 2001. Intramural multisite recording of transmembrane potential in the heart. Biophys. J. 81, 2671–2680 10.1016/S0006-3495(01)75910-3 (doi:10.1016/S0006-3495(01)75910-3) [DOI] [PMC free article] [PubMed] [Google Scholar]
- 17.Walton R. D., Benoist D., Hyatt C. J., Gilbert S. H., White E., Bernus O. In press Dual excitation wavelength epi-fluorescence imaging of transmural electrophysiological properties in intact hearts. Heart Rhythm. 10.1016/j.hrthm.2010.08.019 (doi:10.1016/j.hrthm.2010.08.019) [DOI] [PubMed] [Google Scholar]
- 18.Kay M. W., Amison P. M., Rogers J. M. 2004. Three-dimensional surface reconstruction and panoramic optical mapping of large hearts. IEEE Trans. Biomed. Eng. 51, 1219–1229 10.1109/TBME.2004.827261 (doi:10.1109/TBME.2004.827261) [DOI] [PubMed] [Google Scholar]
- 19.Ripplinger C. M., Lou Q., Li W., Hadley J., Efimov I. R. 2009. Panoramic imaging reveals basic mechanisms of induction and termination of ventricular tachycardia in rabbit heart with chronic infarction: implications for low-voltage cardioversion. Heart Rhythm 6, 87–97 10.1016/j.hrthm.2008.09.019 (doi:10.1016/j.hrthm.2008.09.019) [DOI] [PMC free article] [PubMed] [Google Scholar]
- 20.Glukhov A. V., Federov V. V., Lou Q., Ravikumar V. K., Kalish P. W., Schuessler R. B., Moazami N., Efimov I. R. 2010. Transmural dispersion of repolarization in failing and nonfailing human ventricle. Circ. Res. 106, 981–991 10.1161/CIRCRESAHA.109.204891 (doi:10.1161/CIRCRESAHA.109.204891) [DOI] [PMC free article] [PubMed] [Google Scholar]
- 21.Nanthakumar K., et al. 2007. Optical mapping of Langendorff-perfused human hearts: establishing a model for the study of ventricular fibrillation in humans. Am. J. Physiol. 293, H875–H880 [DOI] [PubMed] [Google Scholar]
- 22.Khait V. D., Bernus O., Mironov S. F., Pertsov A. M. 2006. Method for the three-dimensional localization of intramyocardial excitation centers using optical imaging. J. Biomed. Opt. 11, 034007. 10.1117/1.2204030 (doi:10.1117/1.2204030) [DOI] [PubMed] [Google Scholar]
- 23.Prior P., Roth B. J. 2009. Development of an imaging modality utilizing 2D optical signals during an EPI-fluorescent optical mapping experiment. Phys. Med. Biol. 54, 3015–3030 10.1088/0031-9155/54/10/004 (doi:10.1088/0031-9155/54/10/004) [DOI] [PubMed] [Google Scholar]
- 24.Wellner M., Bernus O., Mironov S. F., Pertsov A. M. 2006. Multiplicative optical tomography of cardiac electrical activity. Phys. Med. Biol. 51, 4429–4446 10.1088/0031-9155/51/18/001 (doi:10.1088/0031-9155/51/18/001) [DOI] [PubMed] [Google Scholar]
- 25.Hillman E. M., Bernus O., Pease E., Bouchard M. B., Pertsov A. 2007. Depth-resolved optical imaging of transmural electrical propagation in perfused heart. Opt. Expr. 15, 17827–17841 10.1364/OE.15.017827 (doi:10.1364/OE.15.017827) [DOI] [PMC free article] [PubMed] [Google Scholar]
- 26.Benson A. P., Aslanidi O. V., Zhang H., Holden A. V. 2008. The canine virtual ventricular wall: a platform for dissecting pharmacological effects on propagation and arrhythmogenesis. Prog. Biophys. Mol. Biol. 96, 187–208 10.1016/j.pbiomolbio.2007.08.002 (doi:10.1016/j.pbiomolbio.2007.08.002) [DOI] [PubMed] [Google Scholar]
- 27.Clayton R. H., et al. In press Models of cardiac tissue electrophysiology: progress, challenges and open questions. Prog. Biophys. Mol. Biol. (doi:10.1016/j.pbiomolbio.2010.05.008) [DOI] [PubMed] [Google Scholar]
- 28.Holden A. V., Aslanidi O. V., Benson A. P., Clayton R. H., Halley G., Li P., Tong W. C. 2006. The virtual ventricular wall: a tool for exploring cardiac propagation and arrhythmogenesis. J. Biol. Phys. 32, 355–368 10.1007/s10867-006-9020-1 (doi:10.1007/s10867-006-9020-1) [DOI] [PMC free article] [PubMed] [Google Scholar]
- 29.Vigmond E., Vadakkumpadan F., Gurev V., Arevalo H., Deo M., Plank G., Trayanova N. A. 2009. Towards predictive modelling of the electrophysiology of the heart. Exp. Physiol. 94, 563–577 10.1113/expphysiol.2008.044073 (doi:10.1113/expphysiol.2008.044073) [DOI] [PMC free article] [PubMed] [Google Scholar]
- 30.Kleber A. G., Rudy Y. 2004. Basic mechanisms of cardiac impulse propagation and associated arrhythmias. Physiol. Rev. 84, 431–488 10.1152/physrev.00025.2003 (doi:10.1152/physrev.00025.2003) [DOI] [PubMed] [Google Scholar]
- 31.Spach M. S., Miller W. T., Geselowitz D. B., Barr R. C., Kootsey J. M., Johnson E. A. 1981. The discontinuous nature of propagation in normal canine cardiac muscle: evidence for recurrent discontinuities of intracellular resistance that affect the membrane currents. Circ. Res. 48, 39–54 [DOI] [PubMed] [Google Scholar]
- 32.Gilbert S. H., Benson A. P., Li P., Holden A. V. 2007. Regional localisation of left ventricular sheet structure: integration with current models of cardiac fibre, sheet and band structure. Eur. J. Cardiothorac. Surg. 32, 231–249 10.1016/j.ejcts.2007.03.032 (doi:10.1016/j.ejcts.2007.03.032) [DOI] [PubMed] [Google Scholar]
- 33.Satoh H., Delbridge L. M., Blatter L. A., Bers D. M. 1996. Surface:volume relationship in cardiac myocytes studied with confocal microscopy and membrane capacitance measurements: species-dependence and developmental effects. Biophys. J. 70, 1494–1504 10.1016/S0006-3495(96)79711-4 (doi:10.1016/S0006-3495(96)79711-4) [DOI] [PMC free article] [PubMed] [Google Scholar]
- 34.Spach M. S., Heidlage J. F., Barr R. C., Dolber P. C. 2004. Cell size and communication: role in structural and electrical development and remodeling of the heart. Heart Rhythm 1, 500–515 10.1016/j.hrthm.2004.06.010 (doi:10.1016/j.hrthm.2004.06.010) [DOI] [PubMed] [Google Scholar]
- 35.LeGrice I. J., Smaill B. M., Chai L. Z., Edgar S. G., Gavin J. B., Hunter P. J. 1995. Laminar structure of the heart: ventricular myocyte arrangement and connective tissue architecture in the dog. Am. J. Physiol. 269, H571–H582 [DOI] [PubMed] [Google Scholar]
- 36.Sands G. B., Gerneke D. A., Hooks D. A., Green C. R., Smaill B. H., Legrice I. J. 2005. Automated imaging of extended tissue volumes using confocal microscopy. Microsc. Res. Tech. 67, 227–239 10.1002/jemt.20200 (doi:10.1002/jemt.20200) [DOI] [PubMed] [Google Scholar]
- 37.Valderrabano M., Chen P. S., Lin F. S. 2003. Spatial distribution of phase singularities in ventricular fibrillation. Circulation 108, 354–359 10.1161/01.CIR.0000080322.67408.B4 (doi:10.1161/01.CIR.0000080322.67408.B4) [DOI] [PubMed] [Google Scholar]
- 38.Bishop M. J., Plank G., Burton R. A. B., Schneider J. E., Gavaghan D. J., Grau V., Kohl P. 2010. Development of an anatomically detailed MRI-derived rabbit ventricular model and assessment of its impact on simulations of electrophysiological function. Am. J. Physiol. 298, H699–H718 [DOI] [PMC free article] [PubMed] [Google Scholar]
- 39.Streeter D., Spontnitz H., Patel D., Ross J., Sonnenblick E. 1969. Fiber orientation in the canine left ventricle during diastole and systole. Circ. Res. 24, 339–347 [DOI] [PubMed] [Google Scholar]
- 40.Basser P. J. 1995. Inferring microstructural features and the physiological state of tissues from diffusion-weighted images. NMR Biomed. 8, 333–344 10.1002/nbm.1940080707 (doi:10.1002/nbm.1940080707) [DOI] [PubMed] [Google Scholar]
- 41.Holmes A. A., Scollan D. F., Winslow R. L. 2000. Direct histological validation of diffusion tensor MRI in formaldehyde-fixed myocardium. Magn. Reson. Med. 44, 157–161 (doi:10.1002/1522-2594(200007)44:1<157::AID-MRM22>3.0.CO;2-F) [DOI] [PubMed] [Google Scholar]
- 42.Scollan D. F., Holmes A., Winslow R., Forder J. 1998. Histological validation of myocardial microstructure obtained from diffusion tensor magnetic resonance imaging. Am. J. Physiol. 275, H2308–H2318 [DOI] [PubMed] [Google Scholar]
- 43.Anderson R. H., Smerup M., Sanchez-Quintana D., Loukas M., Lunkenheimer P. P. 2009. The three dimensional arrangement of the myocytes in the ventricular walls. Clin. Anat. 22, 64–76 10.1002/ca.20645 (doi:10.1002/ca.20645) [DOI] [PubMed] [Google Scholar]
- 44.Peskin C. S. 1989. Fiber architecture of the left-ventricular wall—an asymptotic analysis. Commun. Pure Appl. Math. 42, 79–113 10.1002/cpa.3160420106 (doi:10.1002/cpa.3160420106) [DOI] [Google Scholar]
- 45.Basser P. J., Pierpaoli C. 1996. Microstructural and physiological features of tissues elucidated by quantitative-diffusion-tensor MRI. J. Magn. Reson. B 111, 209–219 10.1006/jmrb.1996.0086 (doi:10.1006/jmrb.1996.0086) [DOI] [PubMed] [Google Scholar]
- 46.LeBihan D., Mangin J.-F., Poupon C., Clark C. A., Pappata S., Molko N., Chabriat H. 2001. Diffusion tensor imaging: concepts and applications. J. Magn. Reson. Imaging 13, 534–546 10.1002/jmri.1076 (doi:10.1002/jmri.1076) [DOI] [PubMed] [Google Scholar]
- 47.Benson A. P., Gilbert S. H., Li P., Newton S. M., Holden A. V. 2008. Reconstruction and quantification of diffusion tensor imaging-derived cardiac fibre and sheet structure in ventricular regions used in studies of excitation propagation. Math. Model. Nat. Phenom. 3, 101–130 10.1051/mmnp:2008083 (doi:10.1051/mmnp:2008083) [DOI] [Google Scholar]
- 48.Geerts L., Bovendeerd P., Nicolay K., Arts T. 2003. Characterization of the normal cardiac myofiber field in goat measured with MR-diffusion tensor imaging. Am. J. Physiol. 283, H139–H145 [DOI] [PubMed] [Google Scholar]
- 49.Gilbert S. H., Bernus O., Holden A. V., Benson A. P. 2009. A quantitative comparison of the myocardial fibre orientation in the rabbit as determined by histology and by diffusion tensor-MRI. In Proc. 5th Int. Conf. Functional Imaging and Modeling of the Heart, FIHM 2009, Nice, France, 3–5 June 2009. Lecture Notes in Computer Science, vol. 5528, pp. 49–57. Berlin, Germany: Springer. (doi:10.1007/978-3-642-01932-6_6) [Google Scholar]
- 50.Efimov I., Nikolski V. P., Salama G. 2004. Optical imaging of the heart. Circ. Res. 95, 21–33 10.1161/01.RES.0000130529.18016.35 (doi:10.1161/01.RES.0000130529.18016.35) [DOI] [PubMed] [Google Scholar]
- 51.Dillon S. M., Kerner T. E., Hoffman J., Menz V., Li K. S., Michele J. J. 1998. A system for in vivo cardiac optical mapping. IEEE Eng. Med. Biol. Mag. 17, 95–108 10.1109/51.646226 (doi:10.1109/51.646226) [DOI] [PubMed] [Google Scholar]
- 52.Ding L., Splinter R., Knisley S. B. 2001. Quantifying spatial localization of optical mapping using Monte Carlo simulations. IEEE Trans. Biomed. Eng. 48, 1098–1107 [DOI] [PubMed] [Google Scholar]
- 53.Girouard S. D., Laurita K. R., Rosenbaum D. S. 1996. Unique properties of cardiac action potentials recorded with voltage-sensitive dyes. J. Cardiovasc. Electrophysiol. 7, 1024–1038 10.1111/j.1540-8167.1996.tb00478.x (doi:10.1111/j.1540-8167.1996.tb00478.x) [DOI] [PubMed] [Google Scholar]
- 54.Hyatt C. J., Mironov S. F., Vetter F. J., Zemlin C. W., Pertsov A. M. 2005. Optical action potential upstroke morphology reveals near-surface transmural propagation direction. Circ. Res. 97, 277–284 10.1161/01.RES.0000176022.74579.47 (doi:10.1161/01.RES.0000176022.74579.47) [DOI] [PubMed] [Google Scholar]
- 55.Janks D. L., Roth B. J. 2002. Averaging over depth during optical mapping of unipolar stimulation. IEEE Trans. Biomed. Eng. 49, 1051–1054 10.1109/TBME.2002.802057 (doi:10.1109/TBME.2002.802057) [DOI] [PubMed] [Google Scholar]
- 56.Bernus O., Wellner M., Mironov S. F., Pertsov A. M. 2005. Simulation of voltage-sensitive optical signals in three-dimensional slabs of cardiac tissue: application to transillumination and coaxial imaging methods. Phys. Med. Biol. 50, 215–229 10.1088/0031-9155/50/2/003 (doi:10.1088/0031-9155/50/2/003) [DOI] [PubMed] [Google Scholar]
- 57.Hyatt C. J., Zemlin C. W., Smith R. M., Matiukas A., Pertsov A. M., Bernus O. 2008. Reconstructing subsurface electrical wave orientation from cardiac epi-fluorescence recordings: Monte Carlo versus diffusion approximation. Opt. Expr. 16, 13 758–13 772 10.1364/OE.16.013758 (doi:10.1364/OE.16.013758) [DOI] [PubMed] [Google Scholar]
- 58.Matiukas A., Mitrea B. G., Pertsov A. M., Wuskell J. P., Wei M., Watras J., Millard A. C., Loew L. M. 2007. New near-infrared optical probes of cardiac electrical activity. Am. J. Physiol. 290, H2633–H2643 [DOI] [PubMed] [Google Scholar]
- 59.Matiukas A., et al. 2007. Near-infrared voltage-sensitive fluorescent dyes optimized for optical mapping in blood-perfused myocardium. Heart Rhythm 4, 1441–1451 10.1016/j.hrthm.2007.07.012 (doi:10.1016/j.hrthm.2007.07.012) [DOI] [PMC free article] [PubMed] [Google Scholar]
- 60.Matiukas A., Mitrea B. G., Pertsov A. M., Wuskell J. P., Wei M., Watras J., Millard A. C., Loew L. M. 2006. New near-infrared optical probes of cardiac electrical activity. Am. J. Physiol. 290, H2633–H2643 [DOI] [PubMed] [Google Scholar]
- 61.Hyatt C. J., Mironov S. F., Wellner M., Berenfeld O., Popp A. K., Weitz D. A., Jalife J., Pertsov A. M. 2003. Synthesis of voltagesensitive fluorescence signals from three-dimensional myocardial activation patterns. Biophys. J. 85, 2673–2683 10.1016/S0006-3495(03)74690-6 (doi:10.1016/S0006-3495(03)74690-6) [DOI] [PMC free article] [PubMed] [Google Scholar]
- 62.Zemlin C. W., Bernus O., Matiukas A., Hyatt C. J., Pertsov A. M. 2008. Extracting intramural wavefront orientation from optical upstroke shapes in whole hearts. Biophys. J. 95, 942–950 10.1529/biophysj.107.117887 (doi:10.1529/biophysj.107.117887) [DOI] [PMC free article] [PubMed] [Google Scholar]
- 63.Sampson K. J., Henriquez C. S. 2005. Electrotonic influences on action potential duration dispersion in small hearts: a simulation study. Am. J. Physiol. 289, H350–H360 [DOI] [PubMed] [Google Scholar]
- 64.Bernus O., Wellner M., Pertsov A. M. 2004. Intramural wave propagation in cardiac tissue: asymptotic solutions and cusp waves. Phys. Rev. E 70, 061913. 10.1103/PhysRevE.70.061913 (doi:10.1103/PhysRevE.70.061913) [DOI] [PubMed] [Google Scholar]
- 65.Bernus O., Zemlin C., Matiukas A., Hyatt C. J., Pertsov A. 2006. Intra-myocardial cusp waves and their manifestations in optical mapping signals. Conf. Proc. IEEE Eng. Med. Biol. Sci. 1, 1564–1567 [DOI] [PubMed] [Google Scholar]
- 66.Biktashev V. N., Holden A. V. 2001. Characterization of patterned irregularity in locally interacting, spatially extended systems: ventricular fibrillation. Chaos 11, 653–664 10.1063/1.1380429 (doi:10.1063/1.1380429) [DOI] [PubMed] [Google Scholar]
- 67.Pandit S. V., Clark R. B., Giles W. R., Demir S. S. 2001. Mathematical model of action potential heterogeneity in adult rat left ventricular myocytes. Biophys. J. 81, 3029–3051 10.1016/S0006-3495(01)75943-7 (doi:10.1016/S0006-3495(01)75943-7) [DOI] [PMC free article] [PubMed] [Google Scholar]
- 68.Benson A. P., Halley G., Li P., Tong W. C., Holden A. V. 2007. Virtual cell and tissue dynamics of ectopic activation of the ventricles. Chaos 17, 015105. 10.1063/1.2404634 (doi:10.1063/1.2404634) [DOI] [PubMed] [Google Scholar]
- 69.Benson A. P., Ries M. E., Holden A. V. 2007. Effects of geometry and architecture on re-entrant scroll wave dynamics in human virtual ventricular tissues. In Proc. 4th Int. Conf. Functional Imaging and Modeling of the Heart, FIHM 2007, Salt Lake City, UT, 7–9 June 2007. Lecture Notes in Computer Science, vol. 4466, pp. 200–209. Berlin, Germany: Springer. (doi:10.1007/978-3-540-72907-5_21) [Google Scholar]
- 70.Pop M., et al. 2009. Fusion of optical imaging and MRI for the evaluation and adjustment of macroscopic models of cardiac electrophysiology: a feasibility study. Med. Image Anal. 13, 370–380 10.1016/j.media.2008.07.002 (doi:10.1016/j.media.2008.07.002) [DOI] [PubMed] [Google Scholar]
- 71.Ten Tusscher K. H. W. J., Hren R., Panfilov A. V. 2007. Organization of ventricular fibrillation in the human heart. Circ. Res. 100, e87–e101 10.1161/CIRCRESAHA.107.150730 (doi:10.1161/CIRCRESAHA.107.150730) [DOI] [PubMed] [Google Scholar]
- 72.Tuch D. S. 2004. Q-ball imaging. Mag. Res. Med. 52, 1358–1372 10.1002/mrm.20279 (doi:10.1002/mrm.20279) [DOI] [PubMed] [Google Scholar]
- 73.Dierckx H., Benson A. P., Gilbert S. H., Ries M. E., Holden A. V., Verschelde H., Bernus O. 2009. Intravoxel fibre structure of the left ventricular free wall and posterior left-right ventricular insertion site in canine myocardium using Q-Ball imaging. In Proc. 5th Int. Conf. Functional Imaging and Modeling of the Heart, FIHM 2009, Nice, France, 3–5 June 2009. Lecture Notes in Computer Science, vol. 5528, pp. 495–504. Berlin, Germany: Springer. (doi:10.1007/978-3-642-01932-6_53) [Google Scholar]
- 74.Sosnovik D. E., Wang R., Dai G., Wang T., Aikawa E., Novikov M., Rosenwieig A., Gilbert R. J., Wedeen V. J. 2009. Diffusion spectrum MRI tractography reveals the presence of a complex network of residual myofibres in infarcted myocardium. Circ. Cardiovasc. Imaging 2, 206–212 10.1161/CIRCIMAGING.108.815050 (doi:10.1161/CIRCIMAGING.108.815050) [DOI] [PMC free article] [PubMed] [Google Scholar]
- 75.Hagmann P., Jonasson L., Maeder P., Thiran J., Wedeen V. J., Meuli R. 2006. Understanding diffusion MR imaging techniques: from scalar diffusion-weighted imaging to diffusion tensor imaging and beyond. Radiographics 26, S205–S223 10.1148/rg.26si065510 (doi:10.1148/rg.26si065510) [DOI] [PubMed] [Google Scholar]
- 76.Vadakkumpadan F., Arevalo H., Prassl A. J., Chen J., Kickinger F., Kohl P., Plank G., Trayanova N. 2010. Image-based models of cardiac structure in health and disease. Syst. Biol. Med. 2, 489–506 [DOI] [PMC free article] [PubMed] [Google Scholar]
- 77.Wu Y., Tse H. F., Wu E. X. 2006. Diffusion tensor MRI study of myocardium structural remodeling after infarction in porcine model. Conf. Proc. IEEE Eng. Med. Biol. Soc. 1, 1069–1072 10.1109/IEMBS.2006.259840 (doi:10.1109/IEMBS.2006.259840) [DOI] [PubMed] [Google Scholar]
- 78.Strijkers G. J., Bouts A., Blankesteijn W. M., Peeters T. H., Vilanova A., Van Prooijen M. C., Sanders H. M., Heijman E., Nicolay K. 2009. Diffusion tensor imaging of left ventricular remodeling in response to myocardial infarction in the mouse. NMR Biomed. 22, 182–190 10.1002/nbm.1299 (doi:10.1002/nbm.1299) [DOI] [PubMed] [Google Scholar]
- 79.Walker N. L., Burton F. L., Kettlewell S., Smith G. L., Cobbe S. M. 2007. Mapping of epicardial activation in a rabbit model of chronic myocardial infarction. J. Cardiovasc. Electrophysiol. 18, 862–868 10.1111/j.1540-8167.2007.00858.x (doi:10.1111/j.1540-8167.2007.00858.x) [DOI] [PubMed] [Google Scholar]
- 80.Chen J., Song S.-K., Liu W., McLean M., Allen S. J., Tan J., Wickline S. A., Yu X. 2003. Remodeling of cardiac fiber structure after infarction in rats quantified with diffusion tensor MRI. Am. J. Physiol. 285, H946–H954 [DOI] [PubMed] [Google Scholar]
- 81.Jie X., Gurev V., Trayanova N. 2010. Mechanisms of mechanically induced spontaneous arrhythmias in acute regional ischemia. Circ. Res. 106, 185–192 10.1161/CIRCRESAHA.109.210864 (doi:10.1161/CIRCRESAHA.109.210864) [DOI] [PMC free article] [PubMed] [Google Scholar]
- 82.Ten Tusscher K. H. W. J., Noble D., Noble P. J., Panfilov A. V. 2004. A model for human ventricular tissue. Am. J. Physiol. 286, H1573–H1589 [DOI] [PubMed] [Google Scholar]
- 83.Lockie T., Nagel E., Redwood S., Plein S. 2009. Use of cardiovascular magnetic resonance imaging in acute coronary syndromes. Circulation 119, 1671–1681 10.1161/CIRCULATIONAHA.108.816512 (doi:10.1161/CIRCULATIONAHA.108.816512) [DOI] [PMC free article] [PubMed] [Google Scholar]
- 84.Aslanidi O. V., Clayton R. H., Lambert J. L., Holden A. V. 2005. Dynamical and cellular electrophysiological mechanisms of ECG changes during ischaemia. J. Theor. Biol. 237, 369–381 10.1016/j.jtbi.2005.04.022 (doi:10.1016/j.jtbi.2005.04.022) [DOI] [PubMed] [Google Scholar]
- 85.Benson A. P., Hodgson E. K., Bernus O., Holden A. V. 2008. Quantifying the effects of ischaemia on electrophysiology and the ST segment of the ECG in human virtual ventricular cells and tissues. Comput. Cardiol. 35, 705–708 [Google Scholar]


