Abstract
We previously proposed a detailed, 39-variable model for the network of cyclin-dependent kinases (Cdks) that controls progression along the successive phases of the mammalian cell cycle. Here, we propose a skeleton, 5-variable model for the Cdk network that can be seen as the backbone of the more detailed model for the mammalian cell cycle. In the presence of sufficient amounts of growth factor, the skeleton model also passes from a stable steady state to sustained oscillations of the various cyclin/Cdk complexes. This transition corresponds to the switch from quiescence to cell proliferation. Sequential activation of the cyclin/Cdk complexes allows the ordered progression along the G1, S, G2 and M phases of the cell cycle. The 5-variable model can also account for the existence of a restriction point in G1, and for endoreplication. Like the detailed model, it contains multiple oscillatory circuits and can display complex oscillatory behaviour such as quasi-periodic oscillations and chaos. We compare the dynamical properties of the skeleton model with those of the more detailed model for the mammalian cell cycle.
Keywords: oscillations, cell cycle, model, systems biology
1. Introduction
The mammalian cell cycle is driven by a network of cyclin-dependent kinases (Cdks) [1,2], which control the progression along four successive phases: the gap phase G1, the S phase of DNA replication, the gap phase G2 and the M phase of mitosis. When cells are not in a proliferative state, they remain in a quiescent phase, denoted G0. Several models were proposed to account for parts of the mammalian cell cycle, especially the G1/S transition [3,4], the restriction point in G1 [5], or the G2/M transition [6]. We recently proposed a detailed model describing the dynamics of the global Cdk network driving the mammalian cell cycle [7]. This model consists of four Cdk modules, each centred around one cyclin/Cdk complex. The cyclin D/Cdk4–6 and cyclin E/Cdk2 complexes promote progression in G1 and elicit the G1/S transition, respectively, the cyclin A/Cdk2 complex ensures progression in S and the transition S/G2, while the activity of the cyclin B/Cdk1 complex brings about the G2/M transition. In view of its complexity, it is not surprising that the detailed model for the Cdk network contains 39 variables and as many as 164 parameters. We used this model to show that in the presence of sufficient amounts of growth factor, the Cdk network is capable of temporal self-organization in the form of sustained oscillations [7]. The latter correspond to the ordered, sequential activation of the various cyclin/Cdk complexes that control the successive phases of the cell cycle.
Is it possible to build a model for the mammalian cell cycle that would contain a much smaller number of variables and fewer parameters, while keeping similar dynamical properties? Such a simpler model would be of interest for at least two reasons. First, it would be more amenable to computer simulations and to searching in parameter space complex oscillatory phenomena. Second, it would help to delineate the minimal regulatory structure needed for obtaining a particular mode of dynamic behaviour such as sustained oscillations. Here, we present a 5-variable model based on the regulatory backbone of the 39-variable model for the Cdk network. To build such a reduced model, we had to abandon many of the biochemical details included in the detailed model. The reduced system can thus be considered as a skeleton version of the full 39-variable representation of the Cdk network.
In the detailed model for the Cdk network, the synthesis of the various cyclins is regulated through the balance between the antagonistic effects exerted by the transcription factor E2F, which promotes, and the tumour suppressor pRB, which inhibits cell cycle progression, respectively. The Cdk network in turn regulates through phosphorylation the activity of E2F and pRB [7]. Additional regulations in the detailed model for the Cdk network bear on the control exerted by the proteins Skp2, Cdh1 or Cdc20 on the degradation of cyclins E, A and B at the G1/S or G2/M transitions, respectively. Finally, the activity of each cyclin/Cdk complex can itself be regulated through phosphorylation–dephosphorylation. The activity of cyclin D/Cdk4–6 is thus activated by phosphorylation by the CAK protein (cyclin-activated kinase), while the Cdk2 and Cdk1 complexes are activated by the phosphatase Cdc25 and inhibited by the kinase Wee1. Multiple positive feedback loops characterize the activation of the Cdks, because the phosphatases Cdc25 that activate the various Cdks are themselves activated through phosphorylation by their corresponding Cdk, while the latter inactivate their inhibitory kinase Wee1. The activity of the Cdks is further regulated through association with the protein inhibitor p21/p27 [7]. The already large number of variables in the detailed model goes up to 44 when the ATR/Chk1 checkpoint controlling DNA replication is incorporated into the model.
We show here that many of these biochemical details may be relinquished in building a skeleton, 5-variable model for the mammalian cell cycle, without losing key dynamical properties of the Cdk network. In §2, we describe the skeleton model and explain what characteristics of the detailed model are kept or abandoned in the reduced version. In §3, we show how sustained oscillations in the various cyclin/Cdk complexes occur in the skeleton model in the presence of sufficient amounts of growth factor. We address the existence of a restriction point in G1 beyond which the presence of the growth factor is not needed to complete a cycle. Section 4 is devoted to the multiple oscillatory circuits contained in the skeleton model for the Cdk network. One consequence of such multiplicity of oscillatory mechanisms is that their interplay may give rise to complex modes of oscillatory behaviour, as shown in §5. These results are discussed in §6. All along, we compare the behaviour of the reduced and detailed models for the Cdk network, to assess in what measure the skeleton model is suitable for describing the dynamics of the mammalian cell cycle.
2. A skeleton 5-variable model for the network of cyclin-dependent kinases
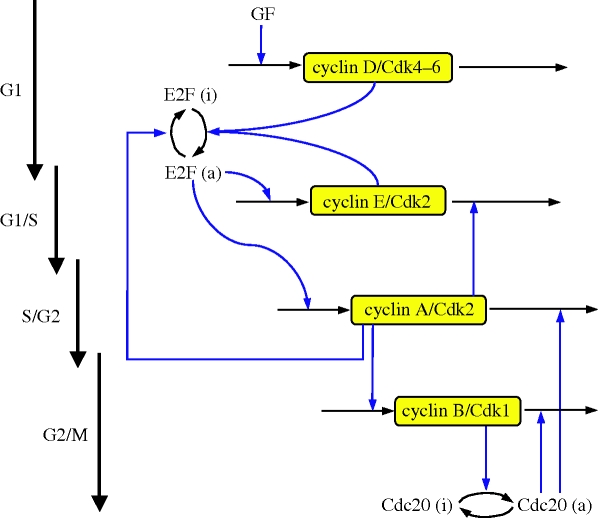
Based on the detailed model, which counts 39 variables, we construct a skeleton model with a reduced number of variables. This model involves as variables the four cyclin/Cdk complexes that allow the correct progression along the successive phases of the cell cycle. Other variables are the transcription factor E2F, and the protein Cdc20 that controls the degradation of the cyclin A/Cdk2 and cyclin B/Cdk1 complexes (figure 1). Because the level of cyclin D/Cdk4–6 is only regulated by the level of growth factor, it rapidly reaches a steady state. The model therefore contains only five variables.
Figure 1.
Scheme of the skeleton model for the Cdk network driving the mammalian cell cycle. The model contains the four main cyclin/Cdk complexes, the transcription factor E2F and the protein Cdc20. At the beginning of the cell cycle, the growth factor GF ensures the synthesis of the cyclin D/Cdk4–6 complex, which promotes progression in the G1 phase. This complex allows the activation of the transcription factor E2F, which will bring about the activation of cyclin E/Cdk2 at the G1/S transition, and cyclin A/Cdk2 during the S phase of DNA replication. Cyclin E/Cdk2 also activates E2F, which reinforces the activation by cyclin D/Cdk4–6 and promotes progression to the G1/S transition. Cyclin A/Cdk2 allows progression in S and elicits the S/G2 transition by promoting the inactivation of E2F. During G2, cyclin A/Cdk2 also triggers the activation of cyclin B/Cdk1, which leads to the G2/M transition. During mitosis, cyclin B/Cdk1 activates by phosphorylation the protein Cdc20. This protein creates a negative feedback loop involving cyclin A/Cdk2 and cyclin B/Cdk1 by promoting the degradation of these complexes. The regulations controlled by Cdc20 allow the cell to complete mitosis, and to start a new cell cycle if sufficient amounts of GF are present. The model represents a skeleton version of the much more detailed model proposed by Gérard & Goldbeter [7] for the mammalian cell cycle.
The skeleton model for the Cdk network is schematized in figure 1. At the beginning of the cell cycle, the growth factor GF activates directly the synthesis of the cyclin D/Cdk4–6 complex, which promotes progression in G1. This complex ensures the activation of the transcription factor E2F, which in turn activates the synthesis of the cyclin E/Cdk2 and cyclin A/Cdk2 complexes. During the G1 phase, cyclin E/Cdk2 reinforces the activation of the transcription factor E2F. During the S phase of DNA replication, cyclin A/Cdk2 activates the degradation of cyclin E/Cdk2, which ensures that the latter complex will not be activated at the end of the cell cycle. Cyclin A/Cdk2 also permits exit of the S phase by allowing the inactivation of the transcription factor E2F and by promoting the synthesis of cyclin B/Cdk1, whose peak of activity brings about the G2/M transition. During mitosis, cyclin B/Cdk1 activates, by phosphorylation, the protein Cdc20. This protein is at the core of the negative feedback loop since it promotes the degradation of cyclin A/Cdk2 and cyclin B/Cdk1, thereby permitting the completion of the cell cycle. A new cell cycle starts if the growth factor is still present in sufficient amounts.
As compared with the detailed, 39-variable model, what are the characteristics that had to be abandoned in building the skeleton, 5-variable model? The latter does not incorporate explicitly the reversible binding of each cyclin to its corresponding Cdk; we assume that this complex is rapidly formed. The regulation of the activity of the cyclin/Cdk complexes through phosphorylation–dephosphorylation by the phosphatases Cdc25 and the kinase Wee1 is not considered. Thus, the skeleton model contains only the active forms of the cyclin/Cdk complexes: variations in the activity of the cyclin/Cdk complexes occur solely through cyclin synthesis and degradation. Moreover, the Cdk inhibitor p21/p27 is not present in the skeleton model; this prevents the regulation of the activity of the four cyclin/Cdk complexes through reversible association with this inhibitor.
Moreover, in contrast to the detailed model, the 5-variable model does not take into account the tumour suppressor protein pRB in its various phosphorylated or unphosphorylated forms. In the detailed model, E2F was inactivated upon binding the unphosphorylated and monophosphorylated forms of pRB; activation of E2F followed from the progressive inactivation of pRB through phosphorylation by cyclin D/Cdk4–6 and cyclin E/Cdk2. In the skeleton model, because we do not include the role of pRB, and because we wish to couple E2F to cyclin D/Cdk4–6 and cyclin E/Cdk2, we assume, for simplicity, that the latter kinases directly activate E2F through phosphorylation, even if there is no evidence for such direct control of E2F by the two cyclin/Cdk complexes. In the detailed model, the specific degradation of cyclin E is brought about by the protein Skp2 and the degradation of cyclin B is partly controlled by Cdh1; cyclin A/Cdk2 inhibits Cdh1, which itself promotes the degradation of Skp2 [7]. Here, Cdh1 and Skp2 are not included, and since we wish to couple the degradation of cyclin E/Cdk2 to the rise in cyclin A/Cdk2, we assume that this degradation rate is simply proportional to the concentration of the latter complex.
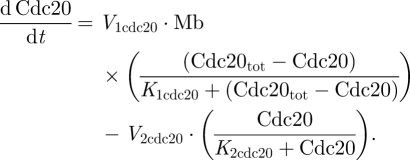
The fact that the phosphatases Cdc25 and the kinase Wee1 are not considered in the 5-variable model prevents the existence of the positive feedback loops that characterize the Cdk2 and Cdk1 modules in the detailed model. Finally, we consider that the total amount of the Cdc20 protein involved in the degradation of cyclin A/Cdk2 and cyclin B/Cdk1 remains constant, whereas the total quantity of this protein could vary in the detailed model. As in the detailed model, however, Cdc20 is present in the skeleton model both under an active, phosphorylated and an inactive, dephosphorylated form.
The kinetic equations of the skeleton model are presented as equations (2.1)–(2.6). Table 1 defines the different variables of the model, and table 2 shows the list of parameters together with their numerical values used in the simulations.
 |
2.1 |
 |
2.2 |
 |
2.3 |
 |
2.4 |
 |
2.5 |
 |
2.6 |
Table 1.
Variables of the model.
| symbol | definition |
|---|---|
| Mda | cyclin D/Cdk4–6 complex |
| E2F | transcription factor E2F |
| Me | cyclin E/Cdk2 complex |
| Ma | cyclin A/Cdk2 complex |
| Mb | cyclin B/Cdk1 complex |
| Cdc20 | protein that belongs to the anaphase-promoting complex (APC) |
aMd is uncoupled from the other variables and rapidly reaches a steady state. The model thus contains only five variables.
Table 2.
Parameters of the model. Concentrations are tentatively expressed in µM. Because many are still unknown and probably vary from one cell type to another, the parameter values are selected in a semi-arbitrary manner so as to produce sustained oscillatory behaviour [7]. The main goal of the model is indeed to determine the types of dynamic behaviour associated with the regulatory structure of the Cdk network.
| symbol | definition | numerical values |
|---|---|---|
| Cdc20tot | total concentration of the protein Cdc20 | 5 µM |
| E2Ftot | total concentration of the transcription factor E2F | 3 µM |
| GF | growth factor | 1 µM |
| Kda | Michaelis constant for the degradation, activated by Cdc20, of cyclin A/Cdk2 | 0.1 µM |
| Kdb | Michaelis constant for the degradation, activated by Cdc20, of cyclin B/Cdk1 | 0.005 µM |
| Kdd | Michaelis constant for the degradation of cyclin D/Cdk4–6 | 0.1 µM |
| Kde | Michaelis constant for the degradation of cyclin E/Cdk2 | 0.1 µM |
| Kgf | Michaelis constant for synthesis of the cyclin D/Cdk4–6 complex induced by growth factor | 0.1 µM |
| K1cdc20 | Michaelis constant for Cdc20 activation through phosphorylation by cyclin B/Cdk1 | 1 µM |
| K2cdc20 | Michaelis constant for Cdc20 inactivation through dephosphorylation | 1 µM |
| K1e2f | Michaelis constant for E2F activation by cyclin D/Cdk4–6 and cyclin E/Cdk2 complexes | 0.01 µM |
| K2e2f | Michaelis constant for E2F inactivation by the cyclin A/Cdk2 complex | 0.01 µM |
| Vda | rate constant for the degradation of the cyclin A/Cdk2 complex by the protein Cdc20 | 0.245 h−1 |
| Vdb | rate constant for the degradation of the cyclin B/Cdk1 complex by the protein Cdc20 | 0.28 h−1 |
| Vdd | maximum degradation rate of cyclin D/Cdk4–6 complex | 0.245 µM h−1 |
| Vde | rate constant for the degradation of cyclin E/Cdk2 by cyclin A/Cdk2 | 0.35 h−1 |
| vsa | rate constant for synthesis of cyclin A/Cdk2 induced by the transcription factor E2F | 0.175 h−1 |
| vsb | rate constant for synthesis of cyclin B/Cdk1 induced by cyclin A/Cdk2 | 0.21 h−1 |
| vsd | rate constant for synthesis of cyclin D/Cdk4–6 induced by growth factor GF | 0.175 h−1 |
| vse | rate constant for synthesis of cyclin E/Cdk2 induced by the transcription factor E2F | 0.21 h−1 |
| V1cdc20 | rate constant for activation of Cdc20 through phosphorylation by cyclin B/Cdk1 | 0.21 h−1 |
| V2cdc20 | maximum rate constant for inactivation of Cdc20 through dephosphorylation | 0.35 µM h−1 |
| V1e2f | rate constant for activation of E2F by cyclin D/Cdk4–6 and cyclin E/Cdk2 complexes | 0.805 h−1 |
| V2e2f | rate constant for inactivation of E2F by the cyclin A/Cdk2 complex | 0.7 h−1 |
We observe that equation (2.1) for cyclin D/Cdk4–6 (Md) is not coupled to the other equations. Numerical integration of equations (2.1)–(2.6) accordingly shows that even when the other variables oscillate in time, variable Md rapidly reaches a steady state, which only depends on the level of the growth factor, GF:
 |
2.7 |
We shall assume that the level of Md rapidly reaches its steady-state level given by equation (2.7). The dynamics of the skeleton model for the cell cycle controlled by the level of the growth factor is thus governed by the five kinetic equations (2.2)–(2.6), supplemented by the algebraic equation (2.7).
3. Growth factor-induced oscillations in the network of cyclin-dependent kinases
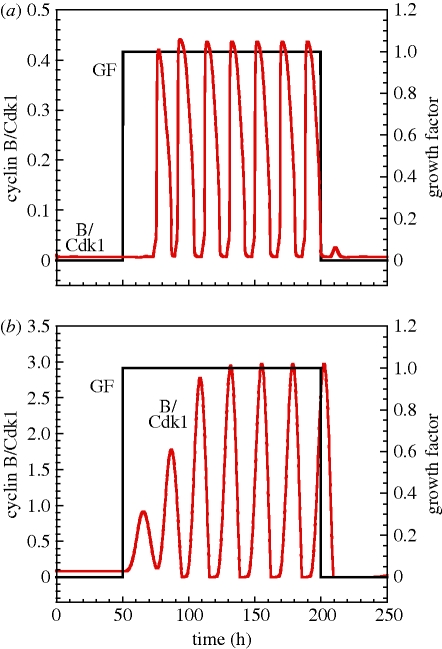
Mammalian cells progress in the cell cycle and proliferate only in the presence of sufficient amounts of growth factor. In the absence of the growth factor, healthy cells are in a quiescent phase and do not proliferate. Figure 2 shows the dynamic behaviour of the Cdk network in the presence or absence of the growth factor, for the 39-variable model (figure 2a) and for the 5-variable model (figure 2b). In both cases, in the absence of the growth factor, i.e. for t < 50 h and t > 200 h, the Cdk network, characterized by the level of cyclin B/Cdk1, tends to a stable steady state defined by low levels of the various cyclin/Cdk complexes. This stable steady state corresponds to the quiescent phase. In the presence of the growth factor, i.e. for 50 h < t < 200 h, the Cdk network undergoes sustained oscillations that correspond to cell proliferation [7]. The effect of the growth factor on cell cycle progression is qualitatively the same in the 39-variable model (figure 2a) and in the 5-variable model (figure 2b). One noticeable difference, however, is that the limit cycle is reached right away in the detailed model, and only after a few cycles of increasing amplitude in the skeleton model. This difference is due to the fact that the bifurcation is subcritical in the detailed model, and supercritical in the reduced model.
Figure 2.
Growth factor-induced oscillations in the Cdk network. Temporal series of cyclin B/Cdk1 for (a) the 39-variable model and (b) the skeleton 5-variable model in the presence (50 h < t < 200 h) or absence (t < 50 h and t > 200 h) of the growth factor (GF). In both cases, the Cdk network, represented by the level of the cyclin B/Cdk1 complex, tends to a stable steady state corresponding to cell cycle arrest in the absence of the growth factor (GF = 0), and tends to a sustained oscillatory regime corresponding to cell proliferation in the presence of sufficient amounts of the growth factor (GF = 1). The values of parameters used for the 39-variable model are given elsewhere (table S2 in Gérard & Goldbeter [7]). The values of the parameters used in (b) are given in table 2.
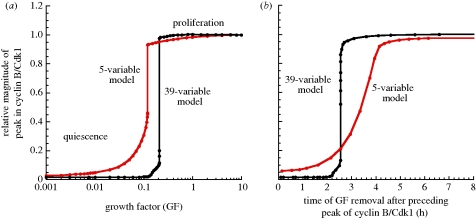
We previously showed in the detailed model that the curve showing the relative magnitude of the peak of cyclin B/Cdk1 as a function of GF exhibits a sharp threshold: above a critical value of GF, the Cdk network begins to oscillate with a high amplitude and cells enter in a proliferative mode (figure 3a, black curve). The response of the Cdk network as a function of the level of GF in the skeleton model is quite similar, but the threshold is somewhat less sharp (figure 3a, red curve). The amplitude of the peak in cyclin B/Cdk1 increases at first progressively, and then more rapidly. The bifurcation diagram for cyclin B/Cdk1 as a function of GF (see §5, figure 8d) indicates that the Cdk network tends to a stable steady state for low levels of GF. For intermediate levels of GF, the Cdk network tends to a regime of sustained oscillations characterized by small-amplitude oscillations in cyclin B/Cdk1. For high values of GF, the Cdk network tends to a regime of large-amplitude oscillations. These large amplitudes in the oscillations could correspond to active cell proliferation. At intermediate levels of GF, over a narrow range of GF values, two stable oscillatory regimes coexist; this phenomenon is known as birhythmicity (§5).
Figure 3.
Effect of growth factor on the dynamics of the Cdk network and the presence of a restriction point in G1. (a) A sharp threshold in the concentration of GF separates a non-proliferative, quiescent state (below threshold) and a proliferative state (above threshold) where the oscillations of the cyclin/Cdk complexes in the Cdk network reach a maximum level. The dynamic behaviour of the Cdk network is represented for the 39-variable (black curve) and for the skeleton, 5-variable (red curve) models by the steady state or by the maximum level of cyclin B/Cdk1 in the course of oscillations, divided by the maximum amplitude of the peak in cyclin B/Cdk1 observed in the course of oscillations at large values of GF. (b) The existence of a restriction point in G1 is reflected by the threshold in the curve showing the magnitude of the peak of cyclin B/Cdk1 relative to the magnitude of the preceding peak in cyclin B/Cdk1 as a function of the time at which GF is removed in G1. The curves pertain to the 39-variable (black curve) and to the skeleton, 5-variable (red curve) models. Parameter values used for the 5-variable model are listed in table 2 (see [7] for the parameter values used for the 39-variable model).
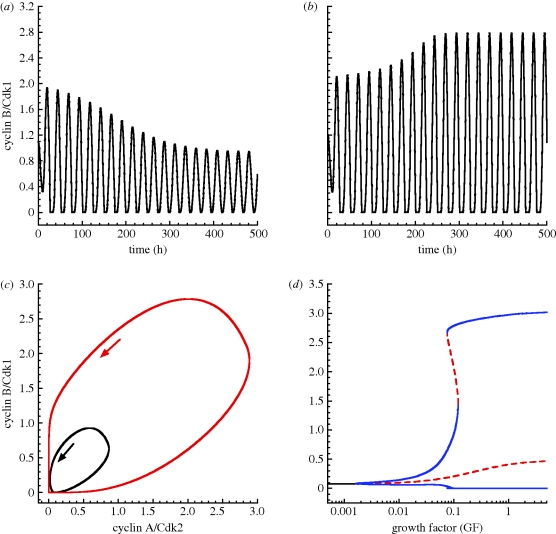
Figure 8.
Birhythmicity in the skeleton model for the Cdk network driving the mammalian cell cycle. The coexistence of two stable oscillations can be observed in the model when GF = 0.1 µM (see the bifurcation diagram in (d)). Initial conditions: the level of cyclin B/Cdk1 is equal to 1.1 µM in (a) and for the black curve in (c), or 1.2 µM in (b) and for the red curve in (c). The bifurcation diagram in (d) shows the level of cyclin B/Cdk1 as a function of GF. Black curve, stable steady state; red dashed line, unstable steady state or the envelope of unstable oscillations; blue curve, envelope of stable oscillations. The Cdk network tends to a stable steady state for a low level of GF, and to a unique oscillatory regime at high levels of GF. At intermediate levels of GF (close to 0.1 µM), the Cdk network can evolve to either one of two stable oscillations (birhythmicity). In (a)–(c), the initial conditions for the other variables of the model are equal to 0.01 µM. Other parameter values are the same as in table 2.
We also studied the dynamical properties of the Cdk network as a function of the time of GF removal in the G1 phase. For the detailed model, we previously showed the existence of a sharp threshold in the relative magnitude of cyclin B/Cdk1 as a function of the time at which GF is removed during the G1 phase (figure 3b, black curve). As previously discussed [7], this sharp threshold defines the existence of a restriction point in G1 beyond which cells do not need the presence of the growth factor anymore to complete the cell cycle [8,9]. Even if the threshold is less sharp in the 5-variable model for the Cdk network, we observe that the amplitude of the peak in Cdk1 rapidly rises as a function of the time of GF removal in G1 (figure 3b, red curve), which also defines the existence of a restriction point in G1. The fact that the threshold is less sharp in this version of the model is due to the absence of positive feedback loops in the Cdk1 module. In contrast, in the 39-variable model, two such positive feedback loops are present in the Cdk1 module: the first one is due to the mutual activation between cyclin B/Cdk1 and its phosphatase Cdc25, and the second one rests on the mutual inhibition of cyclin B/Cdk1 and the kinase Wee1. These two positive feedback loops give rise to bistability in the activation of cyclin B/Cdk1 [10,11], which leads to the abrupt activation of the kinase Cdk1 once GF passes a threshold.
In the presence of sufficient amounts of growth factor, the Cdk network self-organizes in time in the form of sustained oscillations (figure 2). The repetitive, ordered activations of the various cyclin/Cdk complexes in the detailed model and in the skeleton model are shown in figure 4a,b, respectively. The cyclin D/Cdk4–6 complex, which promotes progression in G1, changes only slightly during cell cycle progression [12]. In agreement with these experimental observations, this complex fluctuates with a small amplitude in the 39-variable model as a result of its binding to p21/p27; the latter inhibitor of Cdk2 and Cdk1 also binds to Cdk4–6 but does not affect its activity [13]. In the skeleton model, the level of cyclin D/Cdk4–6, given by equation (2.7), remains constant. In both the detailed and skeleton models for the Cdk network, the oscillations occur successively in cyclin E/Cdk2, which triggers the G1/S transition, cyclin A/Cdk2, which ensures progression in S and elicits the S/G2 transition, and cyclin B/Cdk1, which brings about the G2/M transition.
Figure 4.
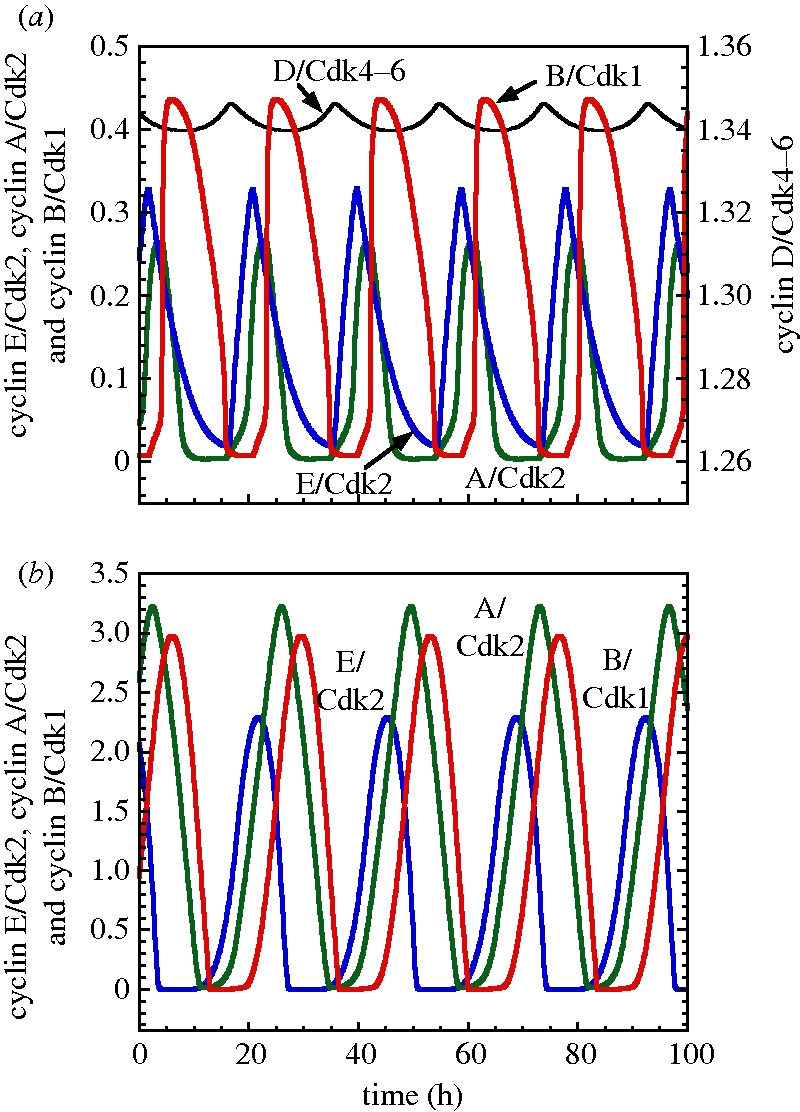
Self-sustained oscillations in the presence of sufficient amounts of growth factor. The curves show the periodic activation of the four cyclin/Cdk complexes for the 39-variable model (a) and for the skeleton, 5-variable model (b). In both cases, the sequential, repetitive activation of the various cyclin/Cdk complexes ensures the correct progression along the successive phases of the cell cycle. In agreement with the observation that the level of cyclin D/Cdk4–6 remains more or less constant during the cell cycle, this complex varies only slightly in the detailed model and remains constant in the skeleton model. Parameters used in (a) for the 39-variable model are given in table S2 in Gérard & Goldbeter [7]. (b) Parameter values are listed in table 2.
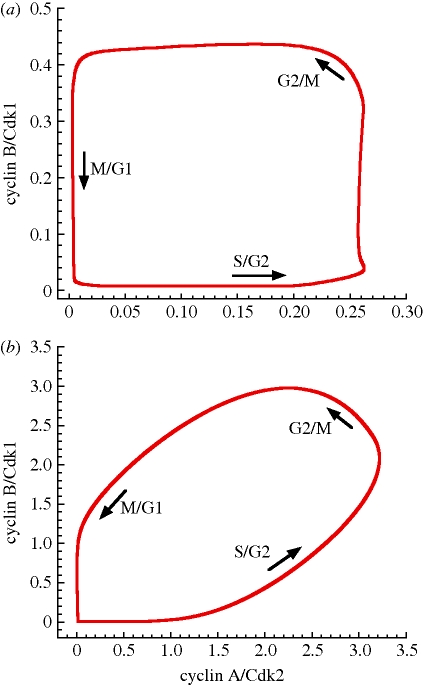
Sustained oscillations of the various cyclin/Cdk complexes correspond to the evolution to a limit cycle. Figure 5 shows the projection of the limit cycle onto the plane formed by the concentrations of cyclin A/Cdk2 and cyclin B/Cdk1, for the detailed, 39-variable model (figure 5a) and for the skeleton, 5-variable model (figure 5b). The transitions between the different phases of the cell cycle are less abrupt in the skeleton than in the detailed model. This is again due to the absence of any positive feedback loop in the 5-variable model, in contrast to the detailed model in which various positive feedback loops give rise to bistable behaviour and, thereby, to all-or-none transitions in several Cdk modules [7]. Positive feedback loops thus contribute to the abrupt activation of cyclin/Cdk complexes, leading to more abrupt transitions between the successive phases of the cell cycle, as shown in figure 5a. We note, however, that if the positive feedback loops, which are present in the detailed model, contribute to abrupt, large-amplitude changes in Cdk activation, they are not crucial to generate sustained oscillations in the Cdk network, as shown by the skeleton model, in agreement with experimental observations which show, nevertheless, that oscillations are more robust in the presence of positive feedback [14].
Figure 5.
Limit cycle oscillations in the Cdk network. The oscillations of figure 4a,b correspond to the evolution to a limit cycle shown as a projection onto the cyclin A/Cdk2 versus cyclin B/Cdk1 phase plane for the 39-variable model (a) and for the 5-variable model (b). Arrows show the direction of movement on the limit cycle. Parameter values are as in figure 4.
4. Multiple oscillatory circuits in the skeleton model for the network of cyclin-dependent kinases
The Cdk network contains several negative feedback loops that can give rise to oscillatory behaviour. In the 39-variable model for the Cdk network, we showed that there are at least four negative feedback circuits that can generate sustained oscillations in the Cdk network. Two oscillators involve Cdk1, responsible for the entry of the cell in mitosis, and are therefore considered as mitotic oscillators. The two others involve only Cdk2, which is responsible for DNA replication, without oscillation of Cdk1. The two latter oscillators will thus promote multiple rounds of DNA replication without occurrence of mitosis. This phenomenon is known as endoreplication [15,16]. The possibility of endoreplication in theoretical models for the yeast cell cycle [17] and for the eukaryotic cell cycle [18] was previously reported.
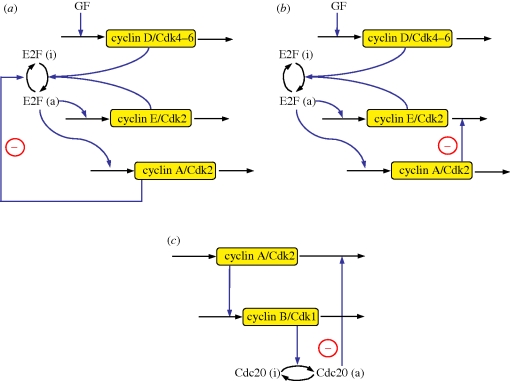
The 5-variable skeleton model contains all the negative feedback loops present in the more detailed, 39-variable model [7]. However, instead of the four oscillatory circuits observed in the detailed model, the skeleton model contains only three such circuits (figure 6). Oscillators A and B involve Cdk2 but not Cdk1; this situation can lead to endoreplication. Oscillator C involves both Cdk2 and Cdk1, and can thus be considered as a mitotic oscillator. In the scheme of figure 1, there is the possibility of a fourth oscillator based on the Cdk1 induction of its own inactivation. Indeed, cyclin B/Cdk1 can activate the protein Cdc20, which enhances the degradation of cyclin B/Cdk1. This negative feedback loop will, however, not lead to sustained oscillations in the 5-variable model because in this model the regulatory loop is too short and does not allow for sufficient delay between the activation of Cdc20 by cyclin B/Cdk1 and the degradation of cyclin B/Cdk1 by Cdc20. In contrast, in the 39-variable model, this negative feedback loop can create sustained oscillations because the delay is longer, as we took explicitly into account in this model the reversible formation of a complex between the Cdk and its corresponding cyclin as well as the existence of an active, dephosphorylated form and an inactive, phosphorylated form of Cdk1 [7]. This fourth oscillatory circuit in the detailed model is similar to the mitotic oscillator driving embryonic cell cycles [19].
Figure 6.
Multiple oscillatory circuits are present in the skeleton, 5-variable model for the Cdk network. All these circuits are based on a negative feedback loop and can generate sustained oscillations of the cyclin/Cdk complexes involved in the circuit. Oscillators A (a) and B (b) involve the transcription factor E2F, cyclin D/Cdk4–6, cyclin E/Cdk2 and cyclin A/Cdk2, but not the cyclin B/Cdk1 complex and the protein Cdc20. Thus, they can produce sustained oscillations of Cdk2, which is responsible for DNA replication, without oscillation of Cdk1, which is responsible for the G2/M transition. In these conditions, cells go through multiple rounds of DNA replication without passing through mitosis. This phenomenon corresponds to endoreplication. Oscillator C (c) involves cyclin A/Cdk2 and cyclin B/Cdk1, and can therefore be viewed as a mitotic oscillator.
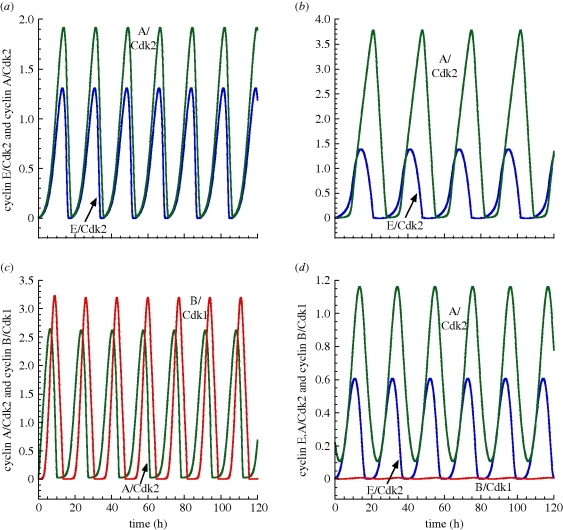
The oscillations generated by the three oscillatory circuits A, B and C of figure 6 are shown in figure 7a–c, respectively. While oscillators A and B correspond to endoreplication, for oscillator C the existence, in each cycle, of one peak of cyclin A/Cdk2 followed by one peak of cyclin B/Cdk1 defines the repetitive passage through DNA replication and mitosis, which corresponds to the ‘classical’ mitotic cell cycle.
Figure 7.
Oscillations produced by the multiple oscillatory circuits present in the skeleton model for the Cdk network. (a) Oscillations of cyclin E/Cdk2 and cyclin A/Cdk2 produced by oscillator A (figure 6a). In these conditions, vsd = 0.5 µM h−1, Vdd = 1 µM h−1, E2Ftot = 2 µM, V1e2f = 2.8 h−1, V2e2f = 2.2 h−1, K1e2f = K2e2f = 0.005 µM, vse = 0.6 h−1, Vde = 1 h−1, vsa = 0.5 h−1, Vda = 0.7 h−1. (b) Oscillations of cyclin E/Cdk2 and cyclin A/Cdk2 produced by oscillator B (figure 6b). In these conditions, vsd = 0.8 µM h−1, Vdd = 1 µM h−1, V1e2f = 4 h−1, V2e2f = 2 h−1, E2Ftot = 2 µM, vse = 0.2 h−1, Vde = 0.2 h−1, Kde = 0.01 µM, vsa = 0.5 h−1, Vda = 0.7 h−1, K1e2f = K2e2f = 0.1 µM. (c) Oscillations of cyclin A/Cdk2 and cyclin B/Cdk1 produced by oscillator C (figure 6c). Here, vsa = 0.5 h−1, vsb = 0.6 h−1, Vda = 0.7 h−1, Vdb = 0.8 h−1, V1cdc20 = 0.6 h−1, V2cdc20 = 1 µM h−1. (d) Oscillations of cyclin E/Cdk2, cyclin A/Cdk2 and cyclin B/Cdk1 for the full 5-variable model in conditions allowing for endoreplication. Some parameter values have to be modified in table 2 to obtain endoreplication behaviour: Vda = 52.5 h−1 instead of 0.245 h−1, vsb = 0.0035 h−1 instead of 0.21 h−1 and Vdb = 1.75 h−1 instead of 0.28 h−1. In all cases, other parameter values are as in table 2.
To reveal the existence of the three oscillators of figure 6 and to obtain their corresponding time series shown in figure 7a–c, we decomposed the Cdk network of figure 1 so as to isolate each negative feedback circuit capable of generating sustained oscillations. In physiological conditions, however, all these oscillatory circuits are tightly coupled in the Cdk network. It is therefore important to determine whether endoreplication may occur when all the oscillators are present, as is the case in the full model of figure 1. As shown in figure 7d, sustained oscillations of cyclin E/Cdk2 and cyclin A/Cdk2 may indeed occur, for appropriate parameter values, in the full skeleton model without significant oscillation of cyclin B/Cdk1.
5. Complex oscillations: birhythmicity, quasi-periodic behaviour and chaos
The presence of multiple sources of oscillations can generate complex oscillatory behaviour in regulatory networks [20,21]. We recently observed such complex patterns of oscillatory dynamics in the detailed model for the Cdk network [22]. We show here that the interplay between multiple oscillatory mechanisms in the skeleton model can also be the source of complex oscillatory behaviour in the form of birhythmicity, quasi-periodic oscillations or chaos.
In the bifurcation diagram of figure 8d where the amplitude of cyclin B/Cdk1 is plotted as a function of GF, we observe that for intermediate values of GF, there is a range in which two stable oscillatory regimes of distinct amplitudes coexist. These stable oscillations are separated by an unstable periodic solution. The two stable oscillations (figure 8a,b) can be reached from closely related initial conditions corresponding to a point in the vicinity of the unstable oscillatory regime. The two limit cycle trajectories corresponding to the stable oscillations are shown in figure 8c as projections onto the phase plane formed by cyclin B/Cdk1 and cyclin A/Cdk2. The period of the small stable limit cycle is close to 24.1 h, while that of the large-amplitude limit cycle is close to 25.1 h.
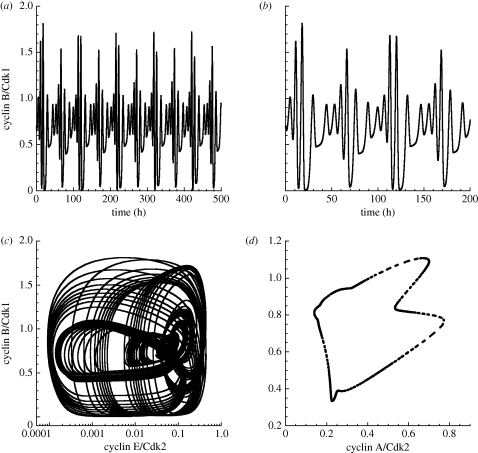
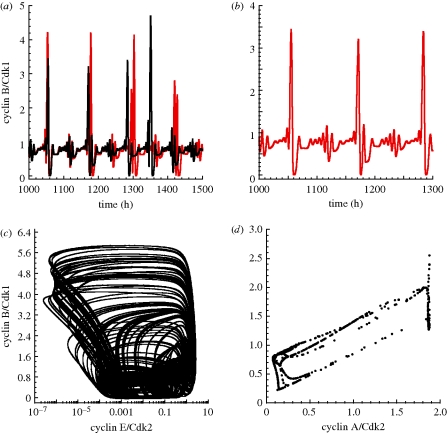
The skeleton model for the Cdk network can also exhibit quasi-periodic oscillations, as shown in figure 9 where cyclin B/Cdk1 is plotted as a function of time in figure 9a. Part of this time series is enlarged in figure 9b, while the phase plane projection of the corresponding trajectory is shown in figure 9c. To establish the quasi-periodic nature of these complex oscillations, we obtained a Poincaré section, which takes the characteristic form of a closed curve (figure 9d).
Figure 9.
Quasi-periodic oscillations in the skeleton model for the Cdk network. (a) Time evolution of cyclin B/Cdk1. (b) Enlargement of a portion of the time series shown in (a). (c) Phase plane trajectory. (d) Poincaré section showing the levels of cyclin B/Cdk1 and cyclin A/Cdk2 corresponding to the successive passages of cyclin E/Cdk2 through a maximum. Parameter values are: GF = 0.01 µM, vsd = 0.01 µM h−1, Vdd = 0.7 µM h−1, V1e2f = 3.1 h−1, V2e2f = 2 h−1, vse = 0.6 h−1, Vde = 1 h−1, vsa = 0.5 h−1, Vda = 0.7 h−1, Kda = 0.25 µM, vsb = 1.06 h−1, Vdb = 0.8 h−1, Kdb = 0.25 µM, V1cdc20 = 1.185 h−1, V2cdc20 = 1 µM h−1, K1cdc20 = K2cdc20 = 0.01 µM, Cdc20tot = 2 µM. Other parameter values are listed in table 2.
Deterministic chaos can also be observed in the skeleton model for the Cdk network (figure 10). The time series for cyclin B/Cdk1 starting from two slightly different initial conditions in figure 10a show that the trajectories eventually diverge in time; such a sensitivity to initial conditions is characteristic of chaotic behaviour. An enlargement of the oscillatory time course of cyclin B/Cdk1 is shown in figure 10b. In phase space, the system evolves towards a strange attractor (figure 10c). The associated Poincaré section is represented in figure 10d.
Figure 10.
Chaos in the skeleton model for the Cdk network. (a) Time evolution of cyclin B/Cdk1 for two closely related initial values of cyclin A/Cdk2: 0.0099 µM (black curve) and 0.01 µM (red curve). The initial values of the other variables are equal to 0.01 µM. The sensitivity to initial conditions is indicative of chaotic behaviour. (b) Enlargement of a portion of the time series shown in (a). (c) Phase plane trajectory showing the evolution to a strange attractor. (d) Poincaré section established as in figure 9d. The rate constant for activation of E2F, V1e2f, is equal to 2.6 h−1. Other parameter values are as in figure 9.
Finally, the skeleton model for the mammalian cell cycle can also display complex periodic oscillations (results not shown). In such a case, the phase space trajectory takes the form of a folded limit cycle, and the Poincaré section reduces to a limited set of distinct points corresponding to the number of peaks per period.
6. Discussion
In this study, we proposed a skeleton 5-variable model for the dynamics of the Cdk network that controls the mammalian cell cycle. This model incorporates the core regulations considered in a much more detailed model for the Cdk network, which counts 39 variables [7]. Much as this detailed model, the skeleton model is built around the four cyclin/Cdk complexes that control progression along the successive phases of the mammalian cell cycle (figure 1). The main goal of this study was to compare the dynamic behaviour of the skeleton model with that of the 39-variable model for the Cdk network.
In both models, the Cdk network responds in the same way as a function of the presence of the growth factor: in the absence of the growth factor, the network tends to a stable steady state corresponding to a quiescent phase, while in the presence of sufficient amounts of the growth factor, it displays sustained oscillations that correspond to the sequential activation of the various cyclin/Cdk complexes, thereby allowing the correct progression along successive cell cycle phases. These sustained oscillations correspond to the evolution to a limit cycle. One noticeable difference is that oscillations in the skeleton model are less abrupt than in the detailed model, because the former lacks bistable transitions associated with the positive feedback loops that are present in the more detailed system.
Both models for the Cdk network contain several negative feedback circuits that can generate on their own sustained oscillations (figures 6 and 7). Two of these oscillators involve the kinase Cdk2, which is responsible for DNA replication, without the intervention of the kinase Cdk1, which is responsible for entry into mitosis, and therefore correspond to endoreplication. The interaction between these multiple oscillators can produce complex periodic behaviour, quasi-periodic oscillations (figure 9) and deterministic chaos (figure 10) both in the skeleton version and in the detailed model [22]. The coexistence between two stable modes of oscillations (birhythmicity) occurs in the skeleton model (figure 8), but has not been observed so far in the detailed model for the mammalian cell cycle.
From the above results, we conclude that the skeleton, 5-variable model proposed in this study provides a good qualitative approximation of the 39-variable model previously proposed for the mammalian cell cycle [7]. To obtain the reduced version, as explained in §2, we had to pay a price by making a number of simplifying assumptions and by relinquishing a variety of biochemical details such as the control of the Cdks through phosphorylation–dephosphorylation and the associated positive feedback loops leading to bistability, the role of pRB as a brake on cell cycle progression, the role of Cdh1 and Skp2 in cyclin degradation and the effect of the protein p21/p27 as Cdk inhibitor. The skeleton model thus represents a stripped-down version of the Cdk network, but it nevertheless retains its regulatory backbone. Most features of the network dynamic behaviour observed in the detailed version are still displayed by the skeleton model. Both modelling approaches are useful and complementary. Indeed, the detailed model for the Cdk network provides a more comprehensive picture of the dynamics of the mammalian cell cycle. Being much more refined, it allows us to address more precise questions about the roles of the various molecular actors in the network. On the other hand, because the skeleton model contains five instead of 39 variables, and 24 instead of 164 parameters, it might be used more readily, e.g. for the study of synchronization or desynchronization in cell populations. The reduced version has also the merit of bringing to light the minimum regulatory structure capable of displaying the rich repertoire of dynamic behaviour seen in the detailed model for the Cdk network driving the mammalian cell cycle. As in the detailed model, the oscillations are based on the sequential activation of cyclin D/Cdk4–6, cyclin E/Cdk2, cyclin A/Cdk2 and cyclin B/Cdk1 and on the property that, once activated, each of these complexes inactivates the preceding cyclin/Cdk complex in the network.
The skeleton model is particularly well suited to study complex modes of oscillatory behaviour and the conditions in which they occur, since they generally arise in small domains in parameter space. It is much easier to explore the possibilities of complex oscillatory dynamics in the skeleton model which has much fewer parameters. Birhythmicity has accordingly been found in the skeleton model but not yet in the detailed model. The occurrence of chaos and birhythmicity was previously reported in a relatively simple model for the cell cycle [23], which was, however, not related as closely as the skeleton model to the dynamics of the Cdk network driving the mammalian cell cycle.
Acknowledgements
This work was supported by grant no 3.4607.99 from the Fonds de la Recherche Scientifique Médicale (F.R.S.M., Belgium), by the Belgian Federal Science Policy Office (IAP P6/25 ‘BioMaGNet’: ‘Bioinformatics and Modelling—From Genomes to Networks’) and by the European Union through the Network of Excellence BioSim, Contract no. LSHB-CT-2004-005137.
Footnotes
One contribution of 16 to a Theme Issue ‘Advancing systems medicine and therapeutics through biosimulation’.
References
- 1.Morgan D. O. 1995. Principles of Cdk regulation. Nature 374, 131–134 10.1038/374131a0 (doi:10.1038/374131a0) [DOI] [PubMed] [Google Scholar]
- 2.Morgan D. O. 2006. The cell cycle: principles of control. Oxford, UK: Oxford University Press [Google Scholar]
- 3.Qu Z., Weiss J. N., MacLellan W. R. 2003. Regulation of the mammalian cell cycle: a model of the G1-to-S transition. Am. J. Physiol. Cell Physiol. 284, 349–364 [DOI] [PubMed] [Google Scholar]
- 4.Swat M., Kel A., Herzel H. 2004. Bifurcation analysis of the regulatory modules of the mammalian G1/S transition. Bioinformatics 20, 1506–1511 10.1093/bioinformatics/bth110 (doi:10.1093/bioinformatics/bth110) [DOI] [PubMed] [Google Scholar]
- 5.Novak B., Tyson J. J. 2004. A model for restriction point control of the mammalian cell cycle. J. Theor. Biol. 230, 563–579 10.1016/j.jtbi.2004.04.039 (doi:10.1016/j.jtbi.2004.04.039) [DOI] [PubMed] [Google Scholar]
- 6.Aguda B. D. 1999. A quantitative analysis of the kinetics of the G2 DNA damage checkpoint system. Proc. Natl Acad. Sci. USA 96, 11 352–11 357 10.1073/pnas.96.20.11352 (doi:10.1073/pnas.96.20.11352) [DOI] [PMC free article] [PubMed] [Google Scholar]
- 7.Gérard C., Goldbeter A. 2009. Temporal self-organization of the cyclin/Cdk network driving the mammalian cell cycle. Proc. Natl Acad. Sci. USA 106, 21 643–21 648 10.1073/pnas.0903827106 (doi:10.1073/pnas.0903827106) [DOI] [PMC free article] [PubMed] [Google Scholar]
- 8.Pardee A. B. 1974. A restriction point for control of normal animal cell proliferation. Proc. Natl Acad. Sci. USA 71, 1286–1290 10.1073/pnas.71.4.1286 (doi:10.1073/pnas.71.4.1286) [DOI] [PMC free article] [PubMed] [Google Scholar]
- 9.Zetterberg A., Larsson O., Wiman K. G. 1995. What is the restriction point? Curr. Opin. Cell Biol. 7, 835–842 10.1016/0955-0674(95)80067-0 (doi:10.1016/0955-0674(95)80067-0) [DOI] [PubMed] [Google Scholar]
- 10.Pomerening J. R., Sontag E. D., Ferrel J. E., Jr 2003. Building a cell cycle oscillator: hysteresis and bistability in the activation of Cdc2. Nat. Cell Biol. 5, 346–351 10.1038/ncb954 (doi:10.1038/ncb954) [DOI] [PubMed] [Google Scholar]
- 11.Sha W., Moore J., Chen K., Lassaletta A. D., Yi C. S., Tyson J. J., Sible J. C. 2003. Hysteresis drives cell-cycle transitions in Xenopus laevis egg extracts. Proc. Natl Acad. Sci. USA 100, 975–980 10.1073/pnas.0235349100 (doi:10.1073/pnas.0235349100) [DOI] [PMC free article] [PubMed] [Google Scholar]
- 12.Matsushime H., Quelle D. E., Shurtleff S. A., Shibuya M., Sherr C. J., Kato J. Y. 1994. D-type cyclin-dependent kinase activity in mammalian cells. Mol. Cell. Biol. 14, 2066–2076 [DOI] [PMC free article] [PubMed] [Google Scholar]
- 13.Sherr C. J., Roberts J. M. 1999. CDK inhibitors: positive and negative regulators of G1-phase progression. Genes Dev. 13, 1501–1512 10.1101/gad.13.12.1501 (doi:10.1101/gad.13.12.1501) [DOI] [PubMed] [Google Scholar]
- 14.Pomerening J. R., Kim S. Y., Ferrel J. E., Jr 2005. Systems-level dissection of the cell-cycle oscillator: bypassing positive feedback produces damped oscillations. Cell 122, 565–578 10.1016/j.cell.2005.06.016 (doi:10.1016/j.cell.2005.06.016) [DOI] [PubMed] [Google Scholar]
- 15.Edgar B. A., Orr-Weaver T. L. 2001. Endoreplication cell cycles: more for less. Cell 105, 297–306 10.1016/S0092-8674(01)00334-8 (doi:10.1016/S0092-8674(01)00334-8) [DOI] [PubMed] [Google Scholar]
- 16.Parisi T., Beck A. R., Rougier N., McNeil T., Lucian L., Werb Z., Amati B. 2003. Cyclins E1 and E2 are required for endoreplication in placental trophoblast giant cells. EMBO J. 22, 4794–4803 10.1093/emboj/cdg482 (doi:10.1093/emboj/cdg482) [DOI] [PMC free article] [PubMed] [Google Scholar]
- 17.Novak B., Tyson J. J. 1997. Modeling the control of DNA replication in fission yeast. Proc. Natl Acad. Sci. USA 94, 9147–9152 10.1073/pnas.94.17.9147 (doi:10.1073/pnas.94.17.9147) [DOI] [PMC free article] [PubMed] [Google Scholar]
- 18.Csikasz-Nagy A., Battogtokh D., Chen K. C., Novak B., Tyson J. J. 2006. Analysis of a generic model of eukaryotic cell-cycle regulation. Biophys. J. 90, 4361–4379 10.1529/biophysj.106.081240 (doi:10.1529/biophysj.106.081240) [DOI] [PMC free article] [PubMed] [Google Scholar]
- 19.Goldbeter A. 1991. A minimal cascade model for the mitotic oscillator involving cyclin and cdc2 kinase. Proc. Natl Acad. Sci. USA 88, 9107–9111 10.1073/pnas.88.20.9107 (doi:10.1073/pnas.88.20.9107) [DOI] [PMC free article] [PubMed] [Google Scholar]
- 20.Goldbeter A. 1996. Biochemical oscillations and cellular rhythms. The molecular bases of periodic and chaotic behaviour. Cambridge, UK: Cambridge University Press [Google Scholar]
- 21.Leloup J. C., Goldbeter A. 1999. Chaos and birhythmicity in a model for circadian oscillations of the PER and TIM proteins in Drosophila. J. Theor. Biol. 198, 445–459 10.1006/jtbi.1999.0924 (doi:10.1006/jtbi.1999.0924) [DOI] [PubMed] [Google Scholar]
- 22.Gérard C., Goldbeter A. In press From simple to complex patterns of oscillatory behavior for the mammalian cell cycle containing multiple oscillatory circuits. Chaos. [DOI] [PubMed] [Google Scholar]
- 23.Romond P.-C., Rustici M., Gonze D., Goldbeter A. 1999. Alternating oscillations and chaos in a model of two coupled biochemical oscillators driving successive phases of the cell cycle. Ann. N. Y. Acad. Sci. 879, 180–193 10.1111/j.1749-6632.1999.tb10419.x (doi:10.1111/j.1749-6632.1999.tb10419.x) [DOI] [PubMed] [Google Scholar]


