Abstract
The past two decades have witnessed developments of new imaging techniques that provide three-dimensional images about the interior of the human body in a manner never before available. Ultrasound (US) imaging is an important cost-effective technique used routinely in the management of a number of diseases. However, two-dimensional viewing of three-dimensional anatomy, using conventional two-dimensional US, limits our ability to quantify and visualize the anatomy and guide therapy, because multiple two-dimensional images must be integrated mentally. This practice is inefficient, and may lead to variability and incorrect diagnoses. Investigators and companies have addressed these limitations by developing three-dimensional US techniques. Thus, in this paper, we review the various techniques that are in current use in three-dimensional US imaging systems, with a particular emphasis placed on the geometric accuracy of the generation of three-dimensional images. The principles involved in three-dimensional US imaging are then illustrated with a diagnostic and an interventional application: (i) three-dimensional carotid US imaging for quantification and monitoring of carotid atherosclerosis and (ii) three-dimensional US-guided prostate biopsy.
Keywords: three-dimensional ultrasound scanning, radiographic imaging, computed tomography
1. Introduction
Two-dimensional radiography has been the basis for imaging human anatomy since the discovery of X-rays. However, two-dimensional X-ray imaging does not provide complete information of an organ or pathology necessary for diagnosis or planning treatment. Computed tomography (CT), developed in the early 1970s, revolutionized diagnostic radiology by providing physicians with three-dimensional images of anatomical structures, reconstructed from a set of contiguous tomographic two-dimensional images. The development of three-dimensional magnetic resonance imaging (MRI), positron emission tomography (PET), and multi-slice and cone beam CT imaging has stimulated the field of three-dimensional image analysis and visualization, leading to the development of a wide variety of applications in diagnostic and interventional medicine.
Along with the development of three-dimensional imaging in CT, PET and MRI, ultrasound (US) imaging has also been extended to three dimensions [1]. Although the majority of US-based diagnostic procedures are performed using two-dimensional imaging, the role of three-dimensional US imaging has been growing and has been shown to be increasingly important in diagnosis, minimally invasive image-guided interventions and intra-operative use of imaging [2–4]. Researchers and commercial companies are incorporating three-dimensional visualizations into US instrumentation as well as integrating three-dimensional US imaging into biopsy and therapy procedures [5–9].
2. Benefits of three-dimensional ultrasound imaging
Although two-dimensional US imaging systems are highly flexible, allowing users to manipulate the hand-held US transducers freely over the body in order to view organs and pathology, they suffer from the following disadvantages, which three-dimensional US imaging instrumentation attempt to overcome:
— Two-dimensional US imaging requires that users mentally integrate many two-dimensional images to form an impression of the anatomy and pathology in three dimensions. This leads to longer procedures and may result in variability in diagnosis and guidance during interventional procedures.
— Two-dimensional US imaging transducers are held and controlled manually; thus, it is difficult to relocate the two-dimensional US image at the exact location and orientation in the body when imaging a patient. This makes monitoring the progression and regression of pathology in response to therapy suboptimal, as accurate monitoring requires a physician to reposition the transducer to view the same image of the pathology.
— Conventional two-dimensional US imaging does not permit viewing of planes parallel to the skin. Diagnostic and interventional procedures sometimes require an arbitrary selection of the image plane for optimal viewing of the pathology.
— The use of two-dimensional US imaging for measurements of organ or lesion volume is variable and at times inaccurate. Diagnostic procedures, therapy/surgery planning and therapy monitoring often require accurate volume delineation and measurements.
The first three-dimensional US images were demonstrated in the 1970s and the first commercial system was made available in 1989 by Kretz. Over the past two decades, many researchers and commercial companies have developed efficient three-dimensional US imaging systems and used them in a wide variety of applications [10–16]. However, progress in the development of three-dimensional US systems and their routine use has been slowed because, unlike three-dimensional MRI and CT imaging, US is an interactive modality used with a mobile imaging system. Therefore, clinically useful three-dimensional US systems require significant computational speed for acquiring, reconstructing and viewing of three-dimensional US information in real time or near real time on inexpensive systems. Recent advances in low-cost computer technology and efficient visualization techniques have now made three-dimensional US imaging a viable technology that is used in a wide range of applications. Most of the major US system manufacturers now provide transducers that can be used to generate three-dimensional US images and three-dimensional US viewing software.
Over the past decade, numerous articles have been published detailing technical advances of three-dimensional US scanning techniques and methods used to visualize three-dimensional images. Some techniques were experimental and did not result in clinically useful systems, while others have been optimized and have resulted in clinically useful systems that are now used routinely. Thus, in this paper, we review briefly the various techniques that are in current use in three-dimensional US imaging systems, with a particular emphasis placed on the geometric accuracy of the generation of three-dimensional images. The principles involved in three-dimensional US imaging are then illustrated with a diagnostic and an interventional application.
3. Three-dimensional ultrasound scanning techniques
A wide variety of approaches have been used to produce three-dimensional US images. These include the use of linear arrays (i.e. one-dimensional array) in mechanical and free-hand scanning, and the use of two-dimensional arrays. Use of linear arrays to produce three-dimensional US images requires methods to determine the position and orientation of the two-dimensional images within the three-dimensional image volume, while two-dimensional arrays require a three-dimensional scan-converter to build the three-dimensional image from the sequence of transmit/receive acoustic signals. In both cases, the production of a three-dimensional US image without any distortions requires that three factors be optimized:
— The scanning technique must be either rapid (i.e. real time or near real time) or gated to avoid image artefacts owing to involuntary, respiratory or cardiac motion.
— The locations and orientations of the acquired two-dimensional US images must be accurately known to avoid geometric distortions in the generation of the two-dimensional US image. Any geometric errors will lead to errors of measurement and therapy guidance.
— The scanning apparatus must be simple and convenient to use; therefore, the scanning must be easily added to the examination or interventional procedure.
Although various approaches have been developed to produce three-dimensional US images, current systems make use of one of the following three-dimensional US imaging approaches: mechanical scanning, free-hand scanning with position sensing, free-hand scanning without position sensing and two-dimensional array scanning for dynamic three-dimensional US (or four-dimensional US).
3.1. Mechanical three-dimensional ultrasound scanning systems
Three-dimensional US systems based on mechanical scanning mechanisms make use of motorized mechanisms to translate, tilt or rotate a conventional two-dimensional US transducer (i.e. with a linear transducer array), while a computer rapidly acquires a sequential series of two-dimensional US images. Because the scanning geometry is predefined and precisely controlled by a motor/encoder, the relative positions and orientations of the acquired two-dimensional US images are known accurately.
The acquired two-dimensional US images and their predefined relative locations and orientations are then used to reconstruct the three-dimensional US images in real time (i.e. as the two-dimensional images are acquired) using novel computational algorithms. These types of systems allow the user to adjust the angular or spatial interval between the acquired two-dimensional images so that the spatial interval between the images can be optimized to minimize the scanning time while adequately sampling the volume [17].
Mechanical scanning mechanisms to translate or rotate conventional US transducers have been developed and used in a variety of clinical applications. These include integrated three-dimensional US transducers that house the scanning mechanism within the transducer housing, and external mechanical fixtures that hold the housing of conventional transducers, which generate two-dimensional US images.
Most major US manufacturers now offer integrated three-dimensional US transducers that are based on a mechanically swept probe or ‘wobbler’. In these systems, the linear US transducer is wobbled or swept back and forth inside the housing, while two-dimensional US images are generated and used to reconstruct the three-dimensional US image. These systems are typically larger than conventional two-dimensional US transducers but are easier to use than three-dimensional US systems using external fixtures with conventional two-dimensional US transducers. These types of integrated three-dimensional US transducers require a special US machine that can control them and reconstruct the acquired two-dimensional images into a three-dimensional image. While external mechanical three-dimensional scanning fixtures (discussed below) are generally bulkier than integrated transducers, they can be adapted to hold any conventional US transducer, obviating the need to purchase a special three-dimensional US machine. In addition, three-dimensional US scanning using external fixtures can take advantage of improvements in the US machine (e.g. image compounding, contrast agent imaging) and flow information (e.g. Doppler imaging) without any changes in the scanning mechanism.
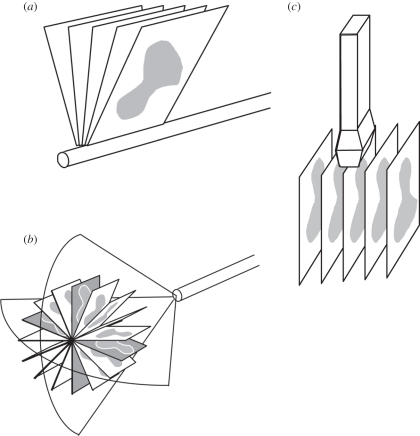
Three-dimensional mechanical scanning offers the following advantages: short imaging times, ranging from about 3 to 0.2 volumes s−1; high-quality three-dimensional images including B-mode and Doppler; and real-time three-dimensional reconstruction times allowing viewing of the three-dimensional image as it is being acquired. However, three-dimensional mechanical scanners can be bulky and their weight sometimes makes them inconvenient to use. Figure 1 shows three basic geometrical types of mechanical scanners that are being used: linear scanners, tilt scanners and rotational scanners.
Figure 1.
Schematic diagram of three-dimensional ultrasound (US) mechanical scanning methods. (a) Side-firing transrectal US transducer being mechanically rotated. The acquired images have equal angular spacing. The same approach is used in a mechanically wobbled transducer. (b) A rotational scanning mechanism, typically used in three-dimensional US-guided prostate biopsy. The acquired images have equal angular spacing. (c) Linear mechanical scanning mechanism. The acquired images have equal spacing.
3.1.1. Wobbling or tilt three-dimensional mechanical ultrasound scanners
This approach uses a motorized drive mechanism to tilt or wobble a conventional linear US transducer about an axis parallel to the face of the transducer. The two-dimensional US images produced by the transducer are arranged like a fan with an adjustable angular spacing between the images. The housing of the probe remains fixed on the skin of the patient while the US transducer is angulated or wobbled in both the integrated three-dimensional US transducer and the external fixture approach. The time to acquire a three-dimensional US image depends on the two-dimensional US image update rate and the number of two-dimensional images used to generate the three-dimensional image. The two-dimensional US image update rate depends on the US machine settings (e.g. depth setting and number of focal zones), and the number of images is controlled by the chosen angular separation between the acquired images needed to yield a desired image quality. Typically, these parameters can be adjusted to optimize scanning time, image quality and the size of the volume to be imaged [18–23]. The most common integrated three-dimensional probes require special three-dimensional US systems or upgrades and are used for abdominal and obstetrical imaging [10,24–27].
The predefined geometry of the acquired two-dimensional US images allows for three-dimensional image reconstruction while the two-dimensional images are acquired; however, the resolution in the three-dimensional US image will not be isotropic. The resolution will degrade as the distance from the axis of rotation is increased owing to US beam spread in the lateral and elevational directions of the acquired two-dimensional US images. Because the geometry of the acquired two-dimensional images is fan-like, the distance between the acquired US images increases with increasing depth. The increase in spatial distance with depth results in a decrease in the spatial sampling and spatial resolution of the reconstructed three-dimensional image in the elevational direction of the acquired two-dimensional US images, resulting in degradation of resolution [28].
3.1.2. Linear mechanical three-dimensional scanners
Linear scanners use a motorized drive mechanism to translate the transducer across the skin of the patient. The transducer can be fixed to be perpendicular to the surface of the skin or at an angle for acquiring Doppler images. Two-dimensional images are acquired at a regular but adjustable spatial interval so that they are parallel and uniformly spaced (figure 1b). The temporal sampling interval can be adjusted to match the two-dimensional US image frame rate for the US machine and the translation speed can be adjusted to match the required spatial sampling interval, which should be at least half of the elevational resolution of the transducer [17].
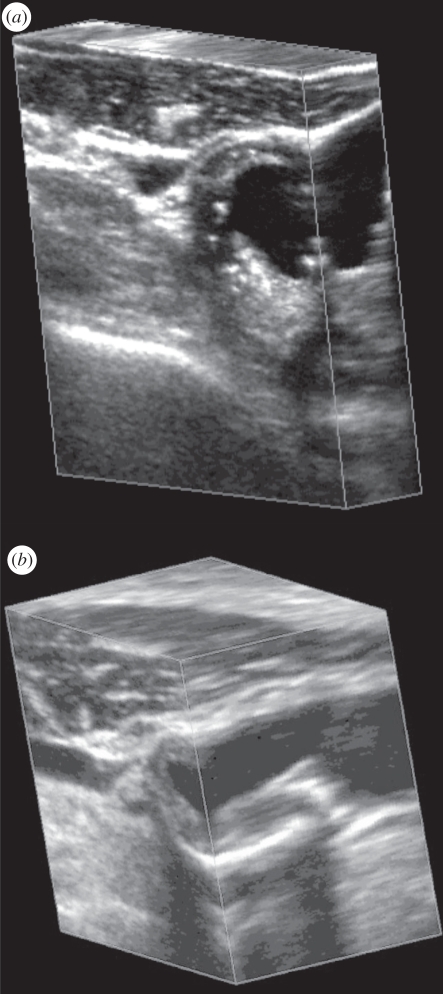
The predefined and regular geometry of the acquired two-dimensional US images allows a three-dimensional image to be reconstructed while the set of two-dimensional US images is acquired. Because the three-dimensional US image is produced from a series of parallel conventional two-dimensional US images, its resolution will not be isotropic. In the direction parallel to the acquired two-dimensional US images, the resolution of the restructured three-dimensional US image will be the same as in the original two-dimensional US images. However, the resolution of the reconstructed three-dimensional image will be equal (if spatial sampling is appropriate) to the elevational resolution of the transducer in the direction perpendicular to the acquired two-dimensional US images (i.e. the scanning direction). Since the resolution of the three-dimensional US image will be poorest in the three-dimensional scanning direction, a transducer with good elevational resolution should be used for optimal results [29]. This effect can be observed in figure 2, where the face on the left of the three-dimensional US image corresponds to the acquired two-dimensional images, and the perpendicular face to these corresponds to the elevational direction of the acquired two-dimensional US images and is in the scanning direction.
Figure 2.
Two examples of three-dimensional US images of the carotid arteries obtained with the mechanical linear three-dimensional scanning approach. The three-dimensional US images are displayed using the cube-view approach and have been sliced to reveal the details of the atherosclerotic plaque in the carotid arteries in transverse and longitudinal views.
Linear scanning has been successfully implemented in many vascular B-mode and Doppler imaging applications, particularly for carotid arteries (see §5 below) [18,30–38] and tumour vascularization [33,39–41]. Figure 2 shows two examples of linearly scanned three-dimensional US images of the carotid arteries made with an external fixture.
3.1.3. Endocavity rotational three-dimensional scanners
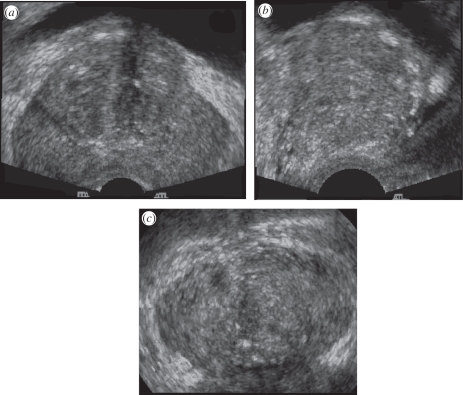
This scanning approach uses an external fixture or internal mechanism to rotate an endocavity probe about its long axis (e.g. a transrectal ultrasound (TRUS) probe; see figure 1a for an external fixture). For endocavity probes using an end-firing transducer, the set of acquired two-dimensional images will be arranged like a fan (figure 1c), intersecting in the centre of the three-dimensional US image (see resulting image in figure 3). For endocavity probes using a side-firing linear transducer (as used in prostate brachytherapy), the acquired images will also be arranged like a fan, but intersect at the axis of rotation of the transducer (figure 1a). For three-dimensional TRUS imaging of the prostate, a side-firing probe is typically rotated from 80° to 110° and an end-firing probe is typically rotated by 180° [23,42,43]. Figure 3 shows that endocavity scanning with end-firing probes has been successfully used to image the prostate [18,33,42] and guide three-dimensional US biopsy and therapy [6,9,44–47].
Figure 3.
A three-dimensional US image of the prostate acquired using an endocavity rotational three-dimensional scanning approach (rotation of a transrectal US transducer). The transducer was rotated around its long axis, while three-dimensional US images were acquired and reconstructed. The three-dimensional US image using an end-firing transducer is displayed using the cube-view approach and has been sliced to reveal: (a) a transverse view, (b) a sagittal view and (c) a coronal view, not possible using conventional two-dimensional US techniques.
A motorized and a manual mechanism with encoders to record the rotation angle have been used to rotate an end-firing endocavity transducer array by (at least) 180° about a fixed axis in the axial direction of the two-dimensional US image and that bisects the transducer array. In this approach, the resolution of the three-dimensional image will not be isotropic. Because the spatial sampling is highest near the axis of the transducer and poorest away from the axis of the transducer, the resolution of the three-dimensional US image will degrade as the distance from the rotational axis of the transducer is increased. Similarly, the axial and elevational resolution will decrease as the distance from the transducer is increased. The combination of these effects will cause the three-dimensional US image resolution to vary—highest near the transducer and the rotational axis, and lowest away from the transducer and rotational axis.
Three-dimensional rotational scanning with an end-firing transducer is most sensitive to the motion of the transducer and the patient. Because the acquired two-dimensional images intersect along the rotational axis of the transducer, any motion during the scan will cause a mismatch in the acquired planes, resulting in the production of artefacts in the centre of the three-dimensional US image. These artefacts will also occur if the axis of rotation is not accurately known; however, proper calibrations can remove this source of potential error. Although hand-held three-dimensional rotational scanning of the prostate and uterus can produce excellent three-dimensional images (figure 3), for optimal results in long procedures, such as prostate brachytherapy and biopsy [23,42,48], the transducer and its assembly should be mounted onto a fixture, such as a stabilizer in prostate brachytherapy.
3.2. Free-hand scanning with position sensing
Since mechanical three-dimensional US scanning mechanisms tend to be bulkier than conventional two-dimensional US transducers, researchers have developed approaches that do not require mechanical scanning devices. To convert a conventional two-dimensional US transducer into one that is capable of three-dimensional US imaging, the position and orientation of the transducer must be tracked. This can be accomplished by mounting a sensor on the transducer to allow measurement of the transducer's position and orientation as the transducer is moved over the body. The two-dimensional images and their relative location and orientation are then used to reconstruct the three-dimensional image [49]. As the locations and orientations of the acquired two-dimensional images are not predefined, an operator must move the transducer over the anatomy at an appropriate speed to ensure that the spatial sampling is proper and to ensure that the set of two-dimensional images does not have any significant gaps. Over the past two decades, several approaches have been developed for free-hand scanning: tracked three-dimensional US with articulated arms, free-hand three-dimensional US with acoustic sensing, free-hand three-dimensional US with magnetic field sensing and image-based sensing (speckle decorrelation). The method used most commonly is the magnetic field-sensing approach with several companies providing the sensing technology: Ascension—Bird sensor [3]; Polhemus—Fastrak sensor [50]; and Northern Digital—Aurora sensor [4].
3.2.1. Free-hand three-dimensional scanning with magnetic field sensors
The magnetic field sensors approach for free-hand three-dimensional US imaging has successfully been used in many diagnostic applications, including echocardiography, obstetrics and vascular imaging [3,4,50–60]. This approach makes use of a conventional US transducer generating two-dimensional US images. To allow tracking of the transducer as it is moved over the body, a time-varying three-dimensional magnetic field transmitter is placed near the patient, and a small receiver containing three orthogonal coils (with 6 d.f.) is mounted on the probe and used to sense the strength of the magnetic field in three orthogonal directions. By measuring the strength of the three components of the local magnetic field, the position and orientation of the transducer are calculated as each two-dimensional image is acquired and used in the three-dimensional reconstruction algorithm.
The main advantages of the magnetic field sensor approach are that they are small and unobtrusive devices which allow the transducer to be tracked without the need for mechanical devices and without the need to keep a clear line of sight. However, electromagnetic interference can compromise the accuracy of the tracking. In addition, geometric distortions in the three-dimensional US image can occur if ferrous (or highly conductive) metals are located nearby. Thus, metal hospital beds in procedure or surgical rooms can cause significant distortions. Modern magnetic field sensors make use of two approaches: an alternating magnetic field (Fastrak from Polhemus and the Aurora from Northern Digital) [4,50] and a pulsed magnetic field (Bird from Ascension) [3]. Although the use of both approaches can produce excellent three-dimensional reconstructions, the alternating magnetic field approach has been shown to be more sensitive to metallic objects owing to generation of eddy currents, and the pulsed magnetic field approach has been shown to be more sensitive to ferromagnetic objects. Errors owing to the hospital metallic beds have been minimized with the placement of the magnetic transmitter between the bed and the patient. In addition to these potential sources of error, the position of the US image relative to the sensor must be calibrated accurately and precisely to avoid distortions in the reconstructed three-dimensional geometry. Calibration of this aspect of the free-hand three-dimensional scanning approach has been the subject of numerous publications [60–68].
3.2.2. Free-hand three-dimensional ultrasound scanning without position sensing
Mechanical or magnetic field-tracked three-dimensional US imaging can produce spatially accurate three-dimensional images. If spatial accuracy is not required, three-dimensional US images can be produced easily without position sensing. This approach assumes that the transducer is moved over the body in a predefined and regular scanning geometry. As the user moves the transducer, either in a linear manner or by tilting it, a set of two-dimensional US images is acquired and reconstructed to form a three-dimensional image using the assumed scanning geometry. As no position or orientation information is recorded during the motion of the transducer, the operator must move the transducer at a constant linear or angular velocity so that each of the two-dimensional images is obtained at regular intervals [30]. Because this approach does not guarantee that the three-dimensional US image is geometrically accurate, it must not be used for measurements.
3.3. Three- and four-dimensional ultrasound scanning using two-dimensional arrays
Three-dimensional US images are produced by mechanical and free-hand scanning techniques using conventional US transducers to generate a three-dimensional US image as the transducer is moved to sweep out the anatomy of interest. This approach limits the speed of volume acquisition to about 2 or 3 volumes s−1. To overcome the requirement to move the conventional transducer and to increase the speed of volume acquisition, transducers with two-dimensional phased arrays generating three-dimensional images in real time have been developed. In this approach, a two-dimensional phased array allows the transducer to remain stationary, while an electronic approach is used to control the transmission and receive a broadly diverging beam of US away from the array, sweeping out a volume shaped like a truncated pyramid [69–75]. The returned echoes detected by the two-dimensional array are processed to display a set of multiple planes in real time. This approach allows the acquisition of a set of three-dimensional images to occur in real time, generating time-dependent three-dimensional images, which is known as four-dimensional US imaging. Using various three-dimensional US image-rendering techniques, users can interactively control and manipulate these planes to explore the entire volume.
The main challenge in the development of the three-dimensional US scanning systems based on two-dimensional arrays is handling of the many wires that are required to be connected to the elements in the array. If every element were connected to a wire, then the connecting cable would be too large and heavy to handle. Thus, these systems make use of multiplexing of the wires to the elements, requiring fewer wires. In addition, the number of elements that are active on transmit and receive modes can be potentially large. Thus, significant parallel processing of the signals is required to allow real-time three-dimensional imaging, as well as design of efficient sparse arrays, requiring fewer transducer array elements. Multiple companies and research laboratories are developing various approaches to the fabrication of two-dimensional arrays as well as complete real-time three-dimensional US systems. Philips is currently selling real-time three-dimensional US systems with two-dimensional arrays of approximately 50 × 50.
The two-dimensional array approach for the generation of real-time three-dimensional US images is successfully being used in echocardiology, which requires dynamic three-dimensional imaging of the heart and its valves [76–79]. Since the technology for developing a transducer based on a two-dimensional phased array is very difficult, few companies provide this technology.
4. Three-dimensional ultrasound visualization
The availability of three-dimensional images from CT and MRI systems has stimulated the development of many algorithms to help physicians and researchers visualize and manipulate three-dimensional medical images interactively. Because US images suffer from shadowing, poor tissue–tissue contrast and image speckle, the display of a three-dimensional US image plays a dominant role in the ability of a physician to obtain the required information efficiently. Although many three-dimensional US display techniques have been developed and used, two of the most frequently used techniques are multi-planar reformatting (MPR) and volume rendering (VR).
4.1. Multi-planar reformatting
The MPR technique is the most commonly used three-dimensional US viewing approach. In this technique, two-dimensional US planes are extracted from the three-dimensional US images and displayed to the user with three-dimensional cues. Users interact with a user interface utility by moving the planes to view the desired anatomy.
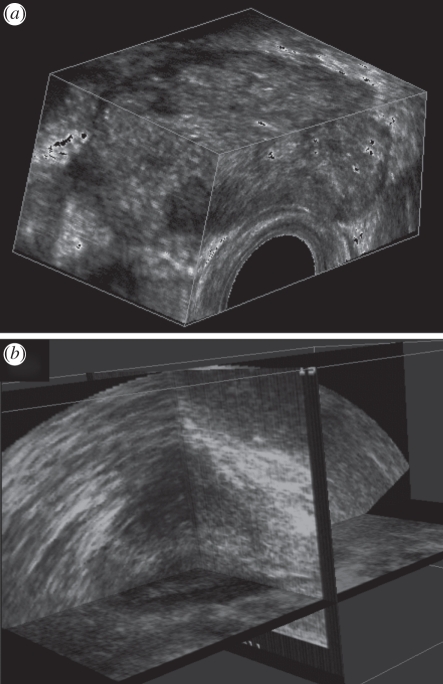
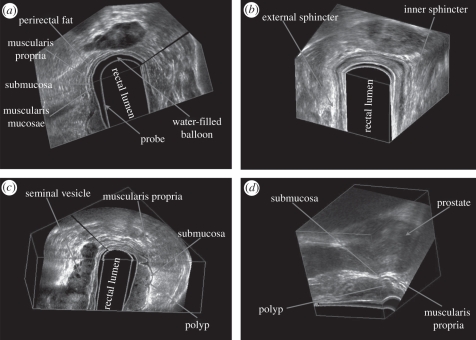
Three MPR approaches are commonly used to display three-dimensional US images. Figure 4b illustrates the crossed planes approach, in which single or multiple planes are presented in a view that shows their correct relative orientations. These planes typically intersect with each other and can be moved in a parallel or oblique manner to any other plane to reveal the desired views. A second approach displays the three-dimensional US image using the cube-view approach illustrated in figures 4a and 5. In this approach, an extracted set of two-dimensional US images are texture-mapped onto the faces of a polyhedron representing the volume being viewed. Users can select any face of the polyhedron and move it (parallel or obliquely) to any other plane, while the appropriate two-dimensional US image is extracted in real time and texture-mapped on the new face. The appearance of a ‘solid’ polyhedron provides users with three-dimensional image-based cues, which relates the manipulated plane to the other planes [11,80–82]. In a third approach, three orthogonal planes are displayed together with three-dimensional cues, such as lines on each extracted plane to designate its intersection with the other planes. These lines can be moved in order to extract and display the desired planes [83,84].
Figure 4.
The three-dimensional US of the prostate displayed using (a) the cube-view and (b) the crossed planes approaches. The three-dimensional US images were acquired using a side-firing transducer using the mechanical rotation approach.
Figure 5.
Three-dimensional US rectal images obtained by the mechanical rotational mechanism, which rotated a side-firing transrectal ultrasound (TRUS) transducer around its long axis by 180°. The three-dimensional US images are viewed using the multi-planar formatting approach. (a) Clear delineation of the rectal wall. (b) Three-dimensional view of the sphincter muscles. (c) Three-dimensional view of a rectal polyp—stage T1, with the polyp invading the submucosa. (d) Three-dimensional view of a rectal polyp—stage 2, with the polyp invading the muscularis propria, but not beyond.
4.2. Volume rendering techniques
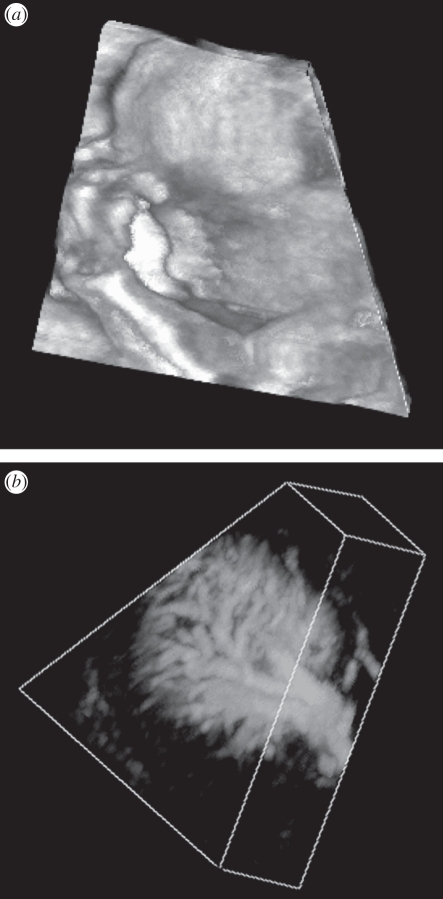
VR techniques are frequently used to view anatomy using three-dimensional CT and MR images. Typically, three-dimensional US images do not produce the tissue–tissue contrast allowing easy segmentation needed for VR rendering. However, US imaging does produce excellent contrast between tissue and fluids (i.e. blood and amniotic fluid). Thus, the VR approach is used extensively to view three-dimensional US foetal images [77,78,85] and four-dimensional US cardiac images [26,79,86]. VR software uses ray-casting techniques to project a two-dimensional array of lines (rays) through a three-dimensional image [87–92]. Many techniques have been used to determine the volume elements (voxels) intersecting each ray, which are weighted, summed and coloured in a number of ways to produce the desired effect. Three of the following VR techniques are commonly used to view three- and four-dimensional US images: maximum intensity projection, translucency rendering and surface enhancement.
Because the VR technique projects three-dimensional information onto a two-dimensional plane, many VR techniques are not well suited for viewing the details of soft tissues in B-mode three-dimensional US images. Instead, VR techniques are best suited for viewing anatomical surfaces that are distinguishable in B-mode US images, including limbs and the foetal face, which are surrounded by amniotic fluid [83,84], tissue–blood interfaces such as endo-cardiac surfaces and inner vascular surfaces (figure 6), and structures where B-mode clutter has been removed from power or colour Doppler three-dimensional images [30].
Figure 6.
Two three-dimensional US images that have been volume rendered. (a) Three-dimensional US image of a foetal face. (b) Three-dimensional US image of the vasculature in a kidney obtained using free-hand three-dimensional Doppler scanning.
5. Three-dimensional carotid ultrasound imaging
5.1. Motivation
The measurement of intima–media thickness (IMT) from B-mode two-dimensional US images is a widely used US phenotype of atherosclerosis and has been regarded as a surrogate measurement of atherosclerosis as it correlates with vascular outcomes [93–95]. Although many studies have validated the measurement of IMT, it is clear that many distinct biological pathways and mechanisms may be reflected by the measurement. For example, IMT may represent hypertensive medial hypertrophy [96,97], compensatory intimal thickening owing to mechanical forces of blood flow [98,99] or the initial ‘fatty streak’ stage of atherosclerosis that involves accumulation of macrophage foam cells in the artery wall [100].
To overcome the limitations of two-dimensional US-based IMT measurements, investigators have developed three-dimensional US-based systems for imaging the carotid vessels. With the generation of a complete three-dimensional image of the carotids and plaque burden in the vessels, progression and regression of atherosclerosis may be monitored with greater sensitivity. The development of three-dimensional carotid US imaging has allowed the development of two more sensitive biomarkers of carotid atherosclerosis based on three-dimensional US imaging. Over the past decade, total plaque volume (TPV) and vessel wall volume (VWV) [35,36,101–105] have emerged as useful US phenotypes of carotid atherosclerosis that measure plaque burden in three dimensions. Previous work demonstrated that TPV can be used to measure changes in plaque burden [35,36,101,106,107] and evaluate the effects of statin therapy [37,108]. More recently, VWV has been shown to provide a more reproducible measure of atherosclerosis burden changes in the carotid arteries. The VWV technique quantifies vessel wall thickness and plaque within carotid arteries, and can be implemented more easily in a semi-automated algorithm, resulting in shorter quantification times and with greater reliability.
Unlike the measurement of three-dimensional US TPV, which requires observers to distinguish plaque–lumen and plaque–outer vessel wall boundaries, the measurement of three-dimensional US VWV requires an observer to manually outline the lumen–intima/plaque and media–adventitia boundaries—similar to the measurement of IMT. These boundaries are more straightforward to interpret than plaque–lumen and wall boundaries in three-dimensional US images. In addition, VWV boundary measurements are more regular, which simplifies the development of semi-automated segmentation algorithms. In this section, we review the method used to acquire three-dimensional carotid US images and discuss its use in the measurement of TPV and VWV.
5.2. Three-dimensional carotid ultrasound scanning technique
As imaging of the carotid arteries requires scanning at least a 4 cm length, two-dimensional phased array systems optimized for cardiac imaging cannot be used effectively. Thus, investigators have used mechanical scanning mechanisms with external fixtures and free-hand scanning systems with magnetic field sensors to scan the carotid arteries.
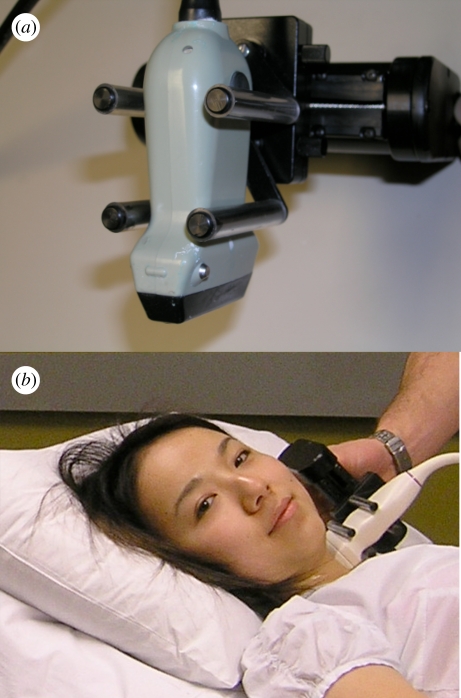
We have developed and used a mechanical scanning mechanism with an external fixture as shown in figure 7 [36]. A motorized mechanism is used to translate the transducer linearly along the neck of the patient, while transverse two-dimensional images of the carotid arteries are acquired at regular spatial intervals as the transducer is moved over the carotid arteries. The length of the scan is adjustable and is typically 4–6 cm. The scan time and resolution in the scan direction can be adjusted to minimize the scan time and optimize the resolution. Typically, we acquire two-dimensional US images at 30 fps and at every 0.2 mm interval. Thus, a 4 cm scan length will require 200 two-dimensional US images, which can be collected in 6.7 s without cardiac gating.
Figure 7.
(a) Photograph of a mechanical linear scanning mechanism used to acquire three-dimensional carotid US images. The transducer is translated along the arteries, while conventional two-dimensional US images are acquired by a computer and reconstructed into a three-dimensional image in real time. (b) Photograph of the system being used to scan the carotid arteries.
5.3. Display of three-dimensional ultrasound carotid images
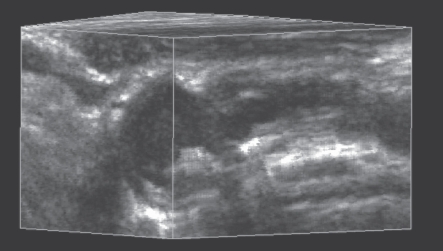
The most commonly used method to display three-dimensional US images of the carotid arteries is the cube-view approach. This approach is best suited for segmentation of the desired anatomy to quantify TPV and VWV. The user can view transverse images of the carotid arteries with optimal resolution yet be able to view the vessel and plaque in three dimensions to obtain three-dimensional anatomical context [109–111]. An example of this approach is shown in figure 8.
Figure 8.
An example of a three-dimensional carotid US image of a patient with carotid atherosclerosis.
5.4. Use of three-dimensional ultrasound to quantify carotid atherosclerosis
5.4.1. Total plaque volume
Quantification of carotid atherosclerosis burden using the TPV requires the operator to ‘slice’ the three-dimensional carotid US image transverse to the vessel axis, starting from one end of the plaque using an inter-slice distance (ISD) of 1.0 mm. The plaque is then contoured in each cross-sectional image and displaced in the three-dimensional image. The area enclosed by each contour is calculated automatically, and the sequential areas are summed and multiplied by the ISD in order to calculate the plaque volume. A summation of all the plaque volumes in the three-dimensional image provides a measure of the TPV. After measuring the TPV, the three-dimensional US image can be viewed in multiple orientations in order to verify that each plaque volume is outlined by the set of contours and that no plaque has been missed.
5.4.2. Vessel wall volume
Analysis of carotid atherosclerosis from MR images is performed using the VWV technique. This technique also uses three-dimensional US images of the carotid arteries and proceeds in a similar way to the measurement of TPV. Each three-dimensional US carotid image is ‘sliced’ transverse to the vessel axis, starting from one end of the three-dimensional US image using an ISD of 1.0 mm. However, unlike the TPV technique, in this approach, the lumen (blood–intima boundary) and the vessel wall (media–adventitia boundary) are segmented in each slice. The area inside the lumen boundary is subtracted from the area inside the vessel wall boundary to give the vessel wall area. Sequential areas are summed and multiplied by the ISD to give the VWV (figure 9).
Figure 9.
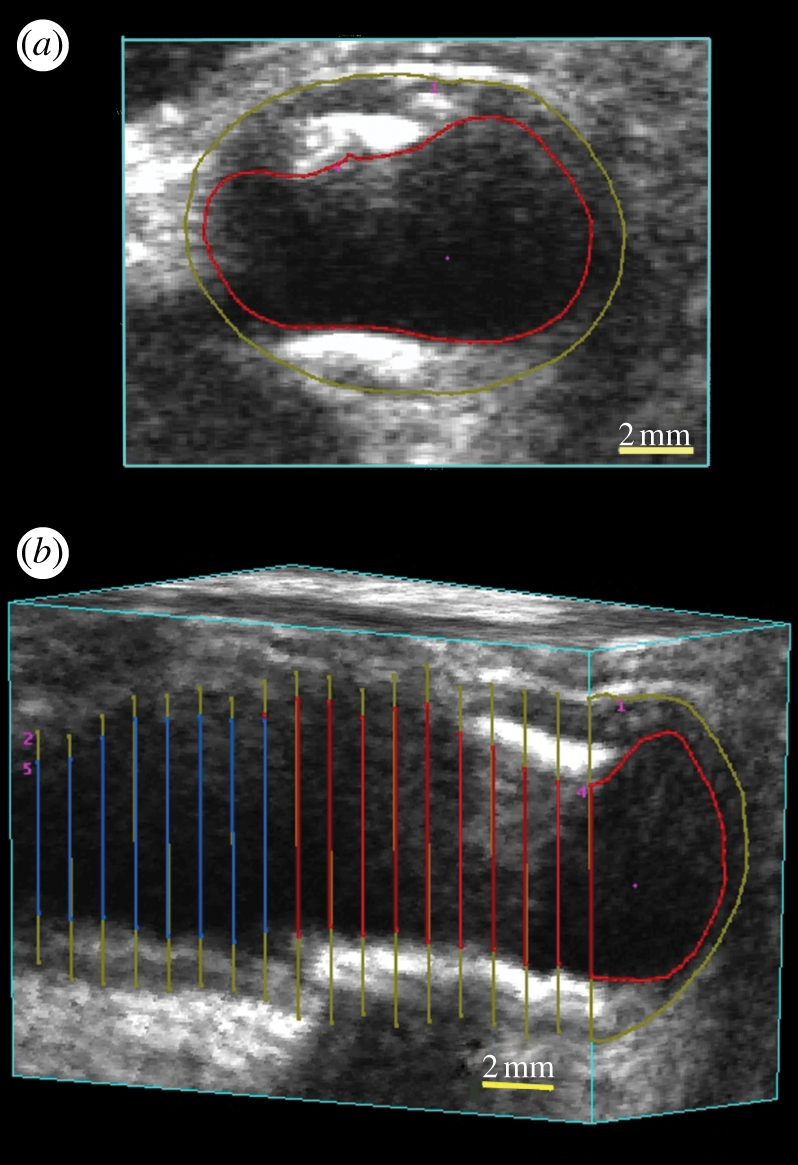
(a) Three-dimensional views of VWV measurements. The three-dimensional image is ‘sliced’ to obtain a transverse view. Using a mouse-driven cross-haired cursor, the plaque is outlined in successive image ‘slices’ until all the plaques have been traversed. (b) The vessel can be sliced to reveal a longitudinal view with the outlines of the plaques. After outlining all the plaques, the total volume can be calculated and a mesh fitted to provide a view of the plaque surface together with the boundary of the vessel.
6. Three-dimensional ultrasound-guided prostate biopsy
6.1. Motivation
Prostate cancer is curable if diagnosed at an early stage, and even at later stages treatment can be effective [112]. Digital rectal examinations and prostate-specific antigen (PSA) blood tests are the most common prostate cancer screening methods in men who have no symptoms of the disease. However, a PSA test does not provide sufficient information to differentiate between benign prostate conditions and cancer. Thus, a definitive diagnosis requires histological assessment of tissue cores drawn from the prostate during a biopsy procedure in which a physician uses a two-dimensional TRUS probe to guide the needle into the prostate. Since early stage cancer is not usually visible in US images, biopsy samples are obtained from predetermined regions of the prostate with a high probability of harbouring cancer rather than targeting the lesions directly. Regions with higher probability of cancer are typically in the peripheral zone, and areas close to the prostate capsule.
While TRUS-guided prostate biopsy using conventional two-dimensional US imaging is a common urological procedure, it has a false-negative rate as high as 34 per cent, requiring repeat biopsies to locate the cancer site. Depending on the pathological results, the urologist must either avoid a previously targeted volume or aim for these sites directly during a repeat biopsy. A limitation to the current procedure is the use of two-dimensional TRUS for guiding a biopsy needle into the prostate. As two-dimensional US images do not provide sufficient information about the three-dimensional location of the biopsy sample, it is difficult for physicians to plan a repeat biopsy procedure.
With more than 1 million prostate biopsies performed each year in North America, there is a need to use a three-dimensional US-based navigation system that uses widely available and inexpensive US imaging technology, and provides a reproducible record of the three-dimensional locations of the biopsy targets throughout the procedure. The availability of a three-dimensional US image during the biopsy procedure would allow: improved planning of the distribution of the biopsy cores; recording and display of the three-dimensional locations of the biopsy; and use of prior locations of the cores to plan a rebiopsy if needed. In addition, the availability of a three-dimensional US image provides the opportunity of registering it to a previously acquired image from another modality (e.g. MRI) to provide additional information for targeting suspicious regions identified by the other modality.
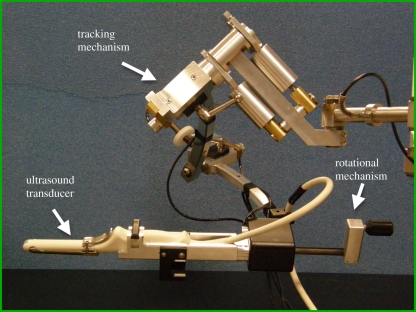
We have developed a mechanical three-dimensional biopsy system that overcomes the current limitations of the two-dimensional biopsy procedure while maintaining the procedural workflow and minimizing costs and physician retraining [23]. This mechanical system has 4 d.f. and has an adaptable cradle that supports commercially available TRUS transducers. It also allows the acquisition of three-dimensional US images and real-time tracking and recording of the three-dimensional position and orientation of the biopsy needle relative to the three-dimensional US image as the physician manipulates the US transducer.
6.2. Mechanical tracking system
Our three-dimensional US-guided prostate biopsy system consists of a PC computer, a conventional US system with an end-firing transducer and a mechanical guidance system built in our laboratory. The software of the system allows acquisition of two-dimensional US images from the transducer, reconstructing these images into a three-dimensional US image based on the rotational scanning approach, and real-time tracking and recording of the three-dimensional position and orientation of the transducer as it is manipulated by the physician. The details of the mechanical system have been described elsewhere and are only summarized here [23]. The system uses: (i) passive mechanical components for guiding, tracking and stabilizing the position of a commercially available end-firing TRUS transducer, (ii) software components for acquiring, storing and three-dimensional reconstructing (in real time) of a series of two-dimensional US images into a three-dimensional US image, and (iii) software that displays a model of the three-dimensional scene to guide and record the biopsy core locations in three dimensions [113].
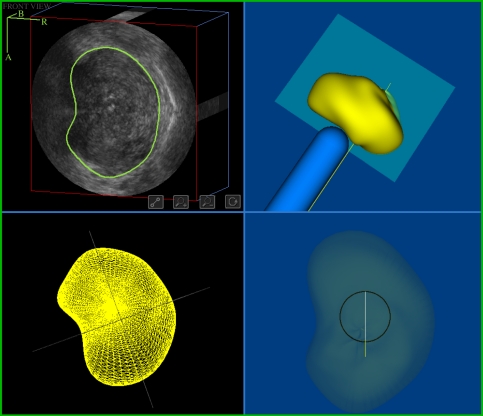
The mechanical assembly consists of a passive 4 d.f. tracking device and an adaptable cradle to accommodate any conventional end-firing US transducer (figure 10). The transducer is rotated around its long axis to produce a three-dimensional US image, which is displayed in a cube-view mode (figure 11).
Figure 10.
Photograph of the three-dimensional US-guided prostate biopsy tracking system. The system is mounted at the base to a stabilizer while the linkage allows the conventional end-firing TRUS transducer to be manually manipulated about a fixed point in space, to which the centre of the probe tip is aligned. To produce a three-dimensional US image, the transducer is rotated about its long axis for 180°.
Figure 11.
The display for viewing the three-dimensional US image of the prostate and to perform the segmentation of the prostate. The user can verify that the prostate has been segmented accurately and perform any required edits to the boundary.
6.3. Biopsy workflow
The physician begins the procedure by inserting the TRUS probe into the patient's rectum and aligns the prostate to the centre of the two-dimensional TRUS image. The physician then acquires a three-dimensional US image of the prostate by rotating the transducer 180° about its long axis and the boundary of the prostate is determined using a semi-automated segmentation algorithm [114–117]. This segmentation algorithm is initialized by the physician, who selects four or more points around the boundary of a two-dimensional prostate cross section. The algorithm then performs a stepwise rotational two-dimensional segmentation by fitting a dynamic deformable contour to each image slice and the result is then propagated to each succeeding image slice.
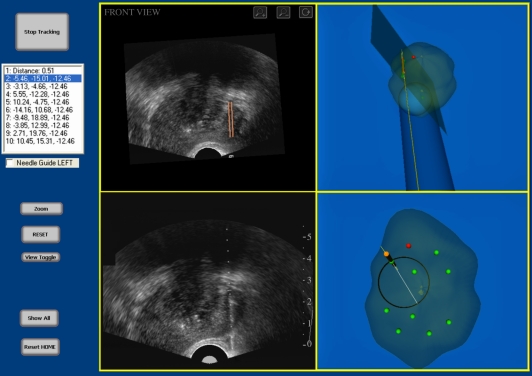
After the model has been reconstructed, the physician can then manipulate the three-dimensional image on the computer screen and select locations to biopsy. After all of the targets have been selected, the system then displays the three-dimensional biopsy needle guidance interface, which facilitates the systematic targeting of each biopsy location previously selected (figure 12). As the physician manually manoeuvres the TRUS probe, the three-dimensional location and orientation of the TRUS probe and needle trajectory is tracked in real time throughout the procedure and displayed relative to the model of the prostate. Figure 12 illustrates the biopsy interface, which is composed of four windows: the live two-dimensional TRUS video stream; the three-dimensional TRUS image; and two three-dimensional model views. The two-dimensional TRUS window displays the real-time two-dimensional TRUS image from the US machine. The three-dimensional TRUS window contains a two-dimensional slice of the three-dimensional static model in real time to reflect the expected orientation and position of the TRUS probe. This correspondence allows the physician to compare the three-dimensional image with the real-time two-dimensional image to determine whether the prostate has moved or deformed to a prohibitive extent. Finally, the two three-dimensional model windows show: (i) orthogonal views (sagittal and coronal) of the three-dimensional prostate model, (ii) the real-time position of the two-dimensional TRUS image plane, and (iii) the expected trajectory of the biopsy needle, which is illustrated by the line intersecting the circle. The targeting circle on the screen illustrates all accessible needle trajectories by rotating the US probe about its longitudinal axis.
Figure 12.
The three-dimensional US-guided prostate biopsy system interface is composed of four windows: (top left) the three-dimensional TRUS image sliced to match the real-time TRUS probe orientation; (bottom left) the live two-dimensional TRUS video stream; and (right side) the three-dimensional location of the biopsy core within the three-dimensional prostate model. The targeting ring in the bottom right window shows all the possible needle paths that intersect the preplanned target by rotating the TRUS about its long axis.
7. Discussion and conclusions
Three-dimensional US has already demonstrated clear advantages in obstetrics, cardiology and image guidance of interventional procedures. Current three-dimensional US technology is sufficiently advanced to allow real-time three-dimensional imaging using two-dimensional array transducers and near real-time three-dimensional imaging with mechanically scanned linear transducers. The current focus of investigators is the establishment of the utility of three-dimensional US in additional clinical applications, and improved image analysis techniques allowing quantitative measurements in an efficient manner. Improved software tools for image viewing and analysis are promising to make three-dimensional US a routine tool on US machines. The following are some possible improvements in three-dimensional US imaging, which may accelerate its use in routine clinical procedures.
7.1. Improved visualization tools
Although three-dimensional US systems make use of interactive visualization tools, they are often complicated and difficult to use by physicians during busy clinical procedures. For three-dimensional US to become widely accepted for interventional guidance applications, intuitive tools are required to manipulate the three-dimensional US image and display the result with the appropriate background and using the appropriate rendering method. Currently, segmentation and VR of three-dimensional US images requires multiple parameters to be optimized and manipulated. Techniques are needed that provide immediate optimal selection of parameters for VR, without significant user intervention.
7.2. Segmentation using three-dimensional ultrasound images
Although automated segmentation algorithms have been developed for use with three-dimensional US images, they are not yet sufficiently robust to be used in routine clinical procedures. Semi-automated segmentation approaches typically require the user to identify the organ or pathology to be segmented (e.g. plaque, tumour, prostate), and a computer algorithm then performs the segmentation automatically. While this approach is easier than manual segmentation, it still requires user interaction. Thus, improvements in segmentation of organs and pathology using robust, accurate and reproducible algorithms would be highly welcomed.
7.3. Three-dimensional ultrasound-guided interventional procedures
Many investigators have demonstrated that providing three-dimensional US information during interventional procedures, such as biopsy, therapy and surgery, improves the physician's ability to perform the procedure. For example, the three-dimensional US-guided prostate biopsy approach improves the physician's ability to accurately guide the biopsy needle to selected targets, and record the biopsy location in three dimensions. Using the three-dimensional TRUS image, the physician will be able to observe the patient's prostate in views currently not possible in two-dimensional procedures. However, significant work and testing is still required to allow physicians to integrate three-dimensional US imaging efficiently into the interventional procedure. Some required improvements are better three-dimensional visualization tools allowing the integration of three-dimensional US with images from other modalities, registration tools for multi-modality registration, efficient and robust three-dimensional US-based segmentation tools, and three-dimensional visualization tools to help the physician guide tools within the body.
Acknowledgements
The authors gratefully acknowledge the financial support of the Canadian Institutes of Health Research, the Ontario Institute for Cancer Research, the Ontario Research Fund, the National Science and Engineering Research Council and the Canada Research Chair programme.
References
- 1.Elliott S. T. 2008. Volume ultrasound: the next big thing? Br. J. Radiol. 81, 8–9 10.1259/bjr/13475432 (doi:10.1259/bjr/13475432) [DOI] [PubMed] [Google Scholar]
- 2.Downey D. B., Fenster A., Williams J. C. 2000. Clinical utility of three-dimensional US. Radiographics 20, 559–571 [DOI] [PubMed] [Google Scholar]
- 3.Boctor E. M., Choti M. A., Burdette E. C., Webster R. J., III 2008. Three-dimensional ultrasound-guided robotic needle placement: an experimental evaluation. Int. J. Med. Robot. 4, 180–191 [DOI] [PMC free article] [PubMed] [Google Scholar]
- 4.Hummel J., Figl M., Bax M., Bergmann H., Birkfellner W. 2008. 2D/3D registration of endoscopic ultrasound to CT volume data. Phys. Med. Biol. 53, 4303–4316 10.1088/0031-9155/53/16/006 (doi:10.1088/0031-9155/53/16/006) [DOI] [PubMed] [Google Scholar]
- 5.Carson P. L., Fenster A. 2009. Anniversary paper: evolution of ultrasound physics and the role of medical physicists and the AAPM and its journal in that evolution. Med. Phys. 36, 411–428 10.1118/1.2992048 (doi:10.1118/1.2992048) [DOI] [PubMed] [Google Scholar]
- 6.Wei Z., Wan G., Gardi L., Mills G., Downey D., Fenster A. 2004. Robot-assisted 3D-TRUS guided prostate brachytherapy: system integration and validation. Med. Phys. 31, 539–548 10.1118/1.1645680 (doi:10.1118/1.1645680) [DOI] [PubMed] [Google Scholar]
- 7.Smith W. L., Surry K., Mills G., Downey D., Fenster A. 2001. Three-dimensional ultrasound-guided core needle breast biopsy. Ultrasound Med. Biol. 27, 1025–1034 10.1016/S0301-5629(01)00396-9 (doi:10.1016/S0301-5629(01)00396-9) [DOI] [PubMed] [Google Scholar]
- 8.Chin J. L., Downey D. B., Onik G., Fenster A. 1996. Three-dimensional prostate ultrasound and its application to cryosurgery. Tech. Urol. 2, 187–193 [PubMed] [Google Scholar]
- 9.Chin J. L., Downey D. B., Mulligan M., Fenster A. 1998. Three-dimensional transrectal ultrasound guided cryoablation for localized prostate cancer in nonsurgical candidates: a feasibility study and report of early results. J. Urol. 159, 910–914 10.1016/S0022-5347(01)63769-8 (doi:10.1016/S0022-5347(01)63769-8) [DOI] [PubMed] [Google Scholar]
- 10.Peralta C. F., Cavoretto P., Csapo B., Falcon O., Nicolaides K. H. 2006. Lung and heart volumes by three-dimensional ultrasound in normal fetuses at 12–32 weeks' gestation. Ultrasound Obstet. Gynecol. 27, 128–133 10.1002/uog.2670 (doi:10.1002/uog.2670) [DOI] [PubMed] [Google Scholar]
- 11.Fenster A., Downey D. B. 1996. 3-dimensional ultrasound imaging: a review. IEEE Eng. Med. Biol. 15, 41–51 10.1109/51.544511 (doi:10.1109/51.544511) [DOI] [Google Scholar]
- 12.Greenleaf J. F., Belohlavek M., Gerber T. C., Foley D. A., Seward J. B. 1993. Multidimensional visualization in echocardiography: an introduction. Mayo Clin. Proc. 68, 213–220 [DOI] [PubMed] [Google Scholar]
- 13.King D. L., Gopal A. S., Sapin P. M., Schroder K. M., Demaria A. N. 1993. Three-dimensional echocardiography. Am. J. Card. Imaging 7, 209–220 [PubMed] [Google Scholar]
- 14.Nelson T. R., Pretorius D. H. 1992. Three-dimensional ultrasound of fetal surface features. Ultrasound Obstet. Gynecol. 2, 166–174 10.1046/j.1469-0705.1992.02030166.x (doi:10.1046/j.1469-0705.1992.02030166.x) [DOI] [PubMed] [Google Scholar]
- 15.Rankin R. N., Fenster A., Downey D. B., Munk P. L., Levin M. F., Vellet A. D. 1993. Three-dimensional sonographic reconstruction: techniques and diagnostic applications. Am. J. Roentgenol. 161, 695–702 [DOI] [PubMed] [Google Scholar]
- 16.Sklansky M. 2003. New dimensions and directions in fetal cardiology. Curr. Opin. Pediatr. 15, 463–471 10.1097/00008480-200310000-00003 (doi:10.1097/00008480-200310000-00003) [DOI] [PubMed] [Google Scholar]
- 17.Smith W. L., Fenster A. 2000. Optimum scan spacing for three-dimensional ultrasound by Speckle statistics. Ultrasound Med. Biol. 26, 551–562 10.1016/S0301-5629(99)00162-3 (doi:10.1016/S0301-5629(99)00162-3) [DOI] [PubMed] [Google Scholar]
- 18.Fenster A., Tong S., Sherebrin S., Downey D. B., Rankin R. N. 1995. Three-dimensional ultrasound imaging. SPIE Phys. Med. Imag. 2432, 176–184 [Google Scholar]
- 19.Delabays A., Pandian N. G., Cao Q. L., Sugeng L., Marx G., Ludomirski A., Schwartz S. L. 1995. Transthoracic real-time three-dimensional echocardiography using a fan-like scanning approach for data acquisition: methods, strengths, problems, and initial clinical experience. Echocardiography 12, 49–59 10.1111/j.1540-8175.1995.tb00521.x (doi:10.1111/j.1540-8175.1995.tb00521.x) [DOI] [PubMed] [Google Scholar]
- 20.Downey D. B., Nicolle D. A., Fenster A. 1995. Three-dimensional orbital ultrasonography. Can. J. Ophthalmol. 30, 395–398 [PubMed] [Google Scholar]
- 21.Downey D. B., Nicolle D. A., Fenster A. 1995. Three-dimensional ultrasound of the eye. Admin. Radiol. J. 14, 46–50 [Google Scholar]
- 22.Gilja O. H., Thune N., Matre K., Hausken T., Odegaard S., Berstad A. 1994. In vitro evaluation of three-dimensional ultrasonography in volume estimation of abdominal organs. Ultrasound Med. Biol. 20, 157–165 10.1016/0301-5629(94)90080-9 (doi:10.1016/0301-5629(94)90080-9) [DOI] [PubMed] [Google Scholar]
- 23.Bax J., Cool D., Gardi L., Knight K., Smith D., Montreuil J., Sherebrin S., Romagnoli C., Fenster A. 2008. Mechanically assisted 3D ultrasound guided prostate biopsy system. Med. Phys. 35, 5397–5410 10.1118/1.3002415 (doi:10.1118/1.3002415) [DOI] [PubMed] [Google Scholar]
- 24.Benacerraf B. R., et al. 2005. Three- and 4-dimensional ultrasound in obstetrics and gynecology. Proceedings of the American Institute of Ultrasound in Medicine Consensus Conference. J. Ultrasound Med. 24, 1587–1597 [DOI] [PubMed] [Google Scholar]
- 25.Dolkart L., Harter M., Snyder M. 2005. Four-dimensional ultrasonographic guidance for invasive obstetric procedures. J. Ultrasound Med. 24, 1261–1266 [DOI] [PubMed] [Google Scholar]
- 26.Goncalves L. F., Lee W., Espinoza J., Romero R. 2005. Three- and 4-dimensional ultrasound in obstetric practice: does it help? J. Ultrasound Med. 24, 1599–1624 [DOI] [PMC free article] [PubMed] [Google Scholar]
- 27.Kurjak A., Miskovic B., Andonotopo W., Stanojevic M., Azumendi G., Vrcic H. 2007. How useful is 3D and 4D ultrasound in perinatal medicine? J. Perinat. Med. 35, 10–27 10.1515/JPM.2007.002 (doi:10.1515/JPM.2007.002) [DOI] [PubMed] [Google Scholar]
- 28.Blake C. C., Elliot T. L., Slomka P. J., Downey D. B., Fenster A. 2000. Variability and accuracy of measurements of prostate brachytherapy seed position in vitro using three-dimensional ultrasound: an intra- and inter-observer study. Med. Phys. 27, 2788–2795 10.1118/1.1326448 (doi:10.1118/1.1326448) [DOI] [PubMed] [Google Scholar]
- 29.Fenster A., Downey D. B., Cardinal H. N. 2001. Topical review: three-dimensional ultrasound imaging. Phys. Med. Biol. 46, R67–R99 10.1088/0031-9155/46/5/201 (doi:10.1088/0031-9155/46/5/201) [DOI] [PubMed] [Google Scholar]
- 30.Downey D. B., Fenster A. 1995. Vascular imaging with a three-dimensional power Doppler system. AJR Am. J. Roentgenol. 165, 665–668 [DOI] [PubMed] [Google Scholar]
- 31.Picot P. A., Rickey D. W., Mitchell R., Rankin R. N., Fenster A. 1993. Three-dimensional colour Doppler imaging. Ultrasound Med. Biol. 19, 95–104 10.1016/0301-5629(93)90001-5 (doi:10.1016/0301-5629(93)90001-5) [DOI] [PubMed] [Google Scholar]
- 32.Pretorius D. H., Nelson T. R., Jaffe J. S. 1992. 3-dimensional sonographic analysis based on color flow Doppler and gray scale image data: a preliminary report. J. Ultrasound Med. 11, 225–232 [DOI] [PubMed] [Google Scholar]
- 33.Downey D. B., Fenster A. 1995. Three-dimensional power Doppler detection of prostate cancer [letter]. AJR Am. J. Roentgenol. 165, 741. [DOI] [PubMed] [Google Scholar]
- 34.Landry A., Fenster A. 2002. Theoretical and experimental quantification of carotid plaque volume measurements made by 3D ultrasound using test phantoms. Med. Phys. 29, 2319–2327 10.1118/1.1510130 (doi:10.1118/1.1510130) [DOI] [PubMed] [Google Scholar]
- 35.Landry A., Spence J. D., Fenster A. 2004. Measurement of carotid plaque volume by 3-dimensional ultrasound. Stroke 35, 864–869 10.1161/01.STR.0000121161.61324.ab (doi:10.1161/01.STR.0000121161.61324.ab) [DOI] [PubMed] [Google Scholar]
- 36.Landry A., Spence J. D., Fenster A. 2005. Quantification of carotid plaque volume measurements using 3D ultrasound imaging. Ultrasound Med. Biol. 31, 751–762 10.1016/j.ultrasmedbio.2005.02.011 (doi:10.1016/j.ultrasmedbio.2005.02.011) [DOI] [PubMed] [Google Scholar]
- 37.Ainsworth C. D., Blake C. C., Tamayo A., Beletsky V., Fenster A., Spence J. D. 2005. 3D ultrasound measurement of change in carotid plaque volume: a tool for rapid evaluation of new therapies. Stroke 35, 1904–1909 10.1161/01.STR.0000178543.19433.20 (doi:10.1161/01.STR.0000178543.19433.20) [DOI] [PubMed] [Google Scholar]
- 38.Krasinski A., Chiu B., Spence J. D., Fenster A., Parraga G. 2009. Three-dimensional ultrasound quantification of intensive statin treatment of carotid atherosclerosis. Ultrasound Med. Biol. 35, 1763–1772 10.1016/j.ultrasmedbio.2009.05.017 (doi:10.1016/j.ultrasmedbio.2009.05.017) [DOI] [PubMed] [Google Scholar]
- 39.Bamber J. C., Eckersley R. J., Hubregtse P., Bush N. L., Bell D. S., Crawford D. C. 1992. Data processing for 3-D ultrasound visualization of tumour anatomy and blood flow. SPIE 1808, 651–663 10.1117/12.131117 (doi:10.1117/12.131117) [DOI] [Google Scholar]
- 40.Carson P. L., Li X., Pallister J., Moskalik A., Rubin J. M., Fowlkes J. B. 1993. Approximate quantification of detected fractional blood volume and perfusion from 3-D color flow and Doppler power signal imaging. In Proc. 1993 Ultrasonics Symposium, pp. 1023–1026 Piscataway, NJ: IEEE [Google Scholar]
- 41.King D. L., King D. L. J., Shao M. Y. 1991. Evaluation of in vitro measurement accuracy of a three-dimensional ultrasound scanner. J. Ultrasound Med. 10, 77–82 [DOI] [PubMed] [Google Scholar]
- 42.Tong S., Downey D. B., Cardinal H. N., Fenster A. 1996. A three-dimensional ultrasound prostate imaging system. Ultrasound Med. Biol. 22, 735–746 10.1016/0301-5629(96)00079-8 (doi:10.1016/0301-5629(96)00079-8) [DOI] [PubMed] [Google Scholar]
- 43.Tong S., Cardinal H. N., McLoughlin R. F., Downey D. B., Fenster A. 1998. Intra- and inter-observer variability and reliability of prostate volume measurement via two-dimensional and three-dimensional ultrasound imaging. Ultrasound Med. Biol. 24, 673–681 10.1016/S0301-5629(98)00039-8 (doi:10.1016/S0301-5629(98)00039-8) [DOI] [PubMed] [Google Scholar]
- 44.Downey D. B., Chin J. L., Fenster A. 1995. Three-dimensional US-guided cryosurgery. Radiology 197, 5397480708 [Google Scholar]
- 45.Chin J. L., Downey D. B., Elliot T. L., Tong S., McLean C. A., Fortier M., Fenster A. 1999. Three dimensional transrectal ultrasound imaging of the prostate: clinical validation. Can. J. Urol. 6, 720–726 [PubMed] [Google Scholar]
- 46.Onik G. M., Downey D. B., Fenster A. 1996. Three-dimensional sonographically monitored cryosurgery in a prostate phantom. J. Ultrasound Med. 15, 267–270 [DOI] [PubMed] [Google Scholar]
- 47.Wei Z., Gardi L., Downey D. B., Fenster A. 2005. Oblique needle segmentation and tracking for 3D TRUS guided prostate brachytherapy. Med. Phys. 32, 2928–2941 10.1118/1.2011108 (doi:10.1118/1.2011108) [DOI] [PubMed] [Google Scholar]
- 48.Cool D., Sherebrin S., Izawa J., Chin J., Fenster A. 2008. Design and evaluation of a 3D transrectal ultrasound prostate biopsy system. Med. Phys. 35, 4695–4707 10.1118/1.2977542 (doi:10.1118/1.2977542) [DOI] [PubMed] [Google Scholar]
- 49.Pagoulatos N., Haynor D. R., Kim Y. 2001. A fast calibration method for 3-D tracking of ultrasound images using a spatial localizer. Ultrasound Med. Biol. 27, 1219–1229 10.1016/S0301-5629(01)00431-8 (doi:10.1016/S0301-5629(01)00431-8) [DOI] [PubMed] [Google Scholar]
- 50.Treece G., Prager R., Gee A., Berman L. 2001. 3D ultrasound measurement of large organ volume. Med. Image Anal. 5, 41–54 10.1016/S1361-8415(00)00034-7 (doi:10.1016/S1361-8415(00)00034-7) [DOI] [PubMed] [Google Scholar]
- 51.Detmer P. R., Bashein G., Hodges T., Beach K. W., Filer E. P., Burns D. H., Strandness D. E., Jr 1994. 3D ultrasonic image feature localization based on magnetic scanhead tracking: in vitro calibration and validation. Ultrasound Med. Biol. 20, 923–936 10.1016/0301-5629(94)90052-3 (doi:10.1016/0301-5629(94)90052-3) [DOI] [PubMed] [Google Scholar]
- 52.Hodges T. C., Detmer P. R., Burns D. H., Beach K. W., Strandness D. E. J. 1994. Ultrasonic three-dimensional reconstruction: in vitro and in vivo volume and area measurement. Ultrasound Med. Biol. 20, 719–729 10.1016/0301-5629(94)90029-9 (doi:10.1016/0301-5629(94)90029-9) [DOI] [PubMed] [Google Scholar]
- 53.Hughes S. W., D'Arcy T. J., Maxwell D. J., Chiu W., Milner A., Saunders J. E., Sheppard R. J. 1996. Volume estimation from multiplanar 2D ultrasound images using a remote electromagnetic position and orientation sensor. Ultrasound Med. Biol. 22, 561–572 10.1016/0301-5629(96)00022-1 (doi:10.1016/0301-5629(96)00022-1) [DOI] [PubMed] [Google Scholar]
- 54.Leotta D. F., Detmer P. R., Martin R. W. 1997. Performance of a miniature magnetic position sensor for three-dimensional ultrasound imaging. Ultrasound Med. Biol. 23, 597–609 10.1016/S0301-5629(97)00043-4 (doi:10.1016/S0301-5629(97)00043-4) [DOI] [PubMed] [Google Scholar]
- 55.Gilja O. H., Detmer P. R., Jong J. M., Leotta D. F., Li X. N., Beach K. W., Martin R., Strandness D. E. 1997. Intragastric distribution and gastric emptying assessed by three-dimensional ultrasonography. Gastroenterology 113, 38–49 10.1016/S0016-5085(97)70078-7 (doi:10.1016/S0016-5085(97)70078-7) [DOI] [PubMed] [Google Scholar]
- 56.Nelson T. R., Pretorius D. H. 1995. Visualization of the fetal thoracic skeleton with three-dimensional sonography: a preliminary report. AJR Am. J. Roentgenol. 164, 1485–1488 [DOI] [PubMed] [Google Scholar]
- 57.Pretorius D. H., Nelson T. R. 1994. Prenatal visualization of cranial sutures and fontanelles with three-dimensional ultrasonography. J. Ultrasound Med. 13, 871–876 [DOI] [PubMed] [Google Scholar]
- 58.Raab F. H., Blood E. B., Steiner T. O., Jones H. R. 1979. Magnetic position and orientation tracking system. IEEE Trans. Aerospace Electron. Syst. AES-15, 709–717 10.1109/TAES.1979.308860 (doi:10.1109/TAES.1979.308860) [DOI] [Google Scholar]
- 59.Riccabona M., Nelson T. R., Pretorius D. H., Davidson T. E. 1995. Distance and volume measurement using three-dimensional ultrasonography. J. Ultrasound Med. 14, 881–886 [DOI] [PubMed] [Google Scholar]
- 60.Hsu P. W., Prager R. W., Gee A. H., Treece G. M. 2008. Real-time freehand 3D ultrasound calibration. Ultrasound Med. Biol. 34, 239–251 10.1016/j.ultrasmedbio.2007.07.020 (doi:10.1016/j.ultrasmedbio.2007.07.020) [DOI] [PubMed] [Google Scholar]
- 61.Mercier L., Lango T., Lindseth F., Collins D. L. 2005. A review of calibration techniques for freehand 3-D ultrasound systems. Ultrasound Med. Biol. 31, 449–471 10.1016/j.ultrasmedbio.2004.11.015 (doi:10.1016/j.ultrasmedbio.2004.11.015) [DOI] [PubMed] [Google Scholar]
- 62.Lindseth F., Tangen G. A., Lango T., Bang J. 2003. Probe calibration for freehand 3-D ultrasound. Ultrasound Med. Biol. 29, 1607–1623 10.1016/S0301-5629(03)01012-3 (doi:10.1016/S0301-5629(03)01012-3) [DOI] [PubMed] [Google Scholar]
- 63.Rousseau F., Hellier P., Barillot C. 2005. Confhusius: a robust and fully automatic calibration method for 3D freehand ultrasound. Med. Image Anal. 9, 25–38 10.1016/j.media.2004.06.021 (doi:10.1016/j.media.2004.06.021) [DOI] [PubMed] [Google Scholar]
- 64.Leotta D. F. 2004. An efficient calibration method for freehand 3-D ultrasound imaging systems. Ultrasound Med. Biol. 30, 999–1008 10.1016/j.ultrasmedbio.2004.05.007 (doi:10.1016/j.ultrasmedbio.2004.05.007) [DOI] [PubMed] [Google Scholar]
- 65.Gooding M. J., Kennedy S. H., Noble J. A. 2005. Temporal calibration of freehand three-dimensional ultrasound using image alignment. Ultrasound Med. Biol. 31, 919–927 10.1016/j.ultrasmedbio.2005.04.007 (doi:10.1016/j.ultrasmedbio.2005.04.007) [DOI] [PubMed] [Google Scholar]
- 66.Dandekar S., Li Y., Molloy J., Hossack J. 2005. A phantom with reduced complexity for spatial 3-D ultrasound calibration. Ultrasound Med. Biol. 31, 1083–1093 10.1016/j.ultrasmedbio.2005.04.008 (doi:10.1016/j.ultrasmedbio.2005.04.008) [DOI] [PubMed] [Google Scholar]
- 67.Poon T. C., Rohling R. N. 2005. Comparison of calibration methods for spatial tracking of a 3-D ultrasound probe. Ultrasound Med. Biol. 31, 1095–1108 10.1016/j.ultrasmedbio.2005.04.003 (doi:10.1016/j.ultrasmedbio.2005.04.003) [DOI] [PubMed] [Google Scholar]
- 68.Gee A. H., Houghton N. E., Treece G. M., Prager R. W. 2005. A mechanical instrument for 3D ultrasound probe calibration. Ultrasound Med. Biol. 31, 505–518 10.1016/j.ultrasmedbio.2004.12.022 (doi:10.1016/j.ultrasmedbio.2004.12.022) [DOI] [PubMed] [Google Scholar]
- 69.Shattuck D. P., Weinshenker M. D., Smith S. W., von Ramm O. T. 1984. Explososcan: a parallel processing technique for high speed ultrasound imaging with linear phased arrays. J. Acoust. Soc. Am. 75, 1273–1282 10.1121/1.390734 (doi:10.1121/1.390734) [DOI] [PubMed] [Google Scholar]
- 70.Smith S. W., Pavy H. G., Jr, von Ramm O. T. 1991. High-speed ultrasound volumetric imaging system. I. Transducer design and beam steering. IEEE Trans. Ultrason. Ferroelec. Freq. Contr. 38, 100–108 10.1109/58.68466 (doi:10.1109/58.68466) [DOI] [PubMed] [Google Scholar]
- 71.Smith S. W., Trahey G. E., von Ramm O. T. 1992. Two-dimensional arrays for medical ultrasound. Ultrason. Imaging 14, 213–233 10.1016/0161-7346(92)90064-3 (doi:10.1016/0161-7346(92)90064-3) [DOI] [PubMed] [Google Scholar]
- 72.Turnbull D. H., Foster F. S. 1991. Beam steering with pulsed two-dimensional transducer arrays. IEEE Trans. Ultrason. Ferroelec. Freq. Contr. 38, 320–333 10.1109/58.84270 (doi:10.1109/58.84270) [DOI] [PubMed] [Google Scholar]
- 73.von Ramm O. T., Smith S. W. 1990. Real time volumetric ultrasound imaging system. SPIE 1231, 15–22 10.1117/12.18779 (doi:10.1117/12.18779) [DOI] [PubMed] [Google Scholar]
- 74.von Ramm O. T., Smith S. W., Pavy H. G., Jr 1991. High-speed ultrasound volumetric imaging system. II. Parallel processing and image display. IEEE Trans. Ultrason. Ferroelec. Freq. Contr. 38, 109–115 10.1109/58.68467 (doi:10.1109/58.68467) [DOI] [PubMed] [Google Scholar]
- 75.Oralkan O., Ergun A. S., Cheng C. H., Johnson J. A., Karaman M., Lee T. H., Khuri-Yakub B. T. 2003. Volumetric acoustic imaging using 2-D CMUT arrays. IEEE Trans. Ultrason. Ferroelectr. Freq. Contr. 50, 1581–1594 10.1109/TUFFC.2003.1251142 (doi:10.1109/TUFFC.2003.1251142) [DOI] [PubMed] [Google Scholar]
- 76.Prakasa K. R., et al. 2006. Feasibility and variability of three dimensional echocardiography in arrhythmogenic right ventricular dysplasia/cardiomyopathy. Am. J. Cardiol. 97, 703–709 10.1016/j.amjcard.2005.11.020 (doi:10.1016/j.amjcard.2005.11.020) [DOI] [PubMed] [Google Scholar]
- 77.Xie M. X., Wang X. F., Cheng T. O., Lu Q., Yuan L., Liu X. 2005. Real-time 3-dimensional echocardiography: a review of the development of the technology and its clinical application. Prog. Cardiovasc. Dis. 48, 209–225 10.1016/j.pcad.2005.07.002 (doi:10.1016/j.pcad.2005.07.002) [DOI] [PubMed] [Google Scholar]
- 78.Sklansky M. 2004. Advances in fetal cardiac imaging. Pediatr. Cardiol. 25, 306–321 10.1007/s00246-003-0594-0 (doi:10.1007/s00246-003-0594-0) [DOI] [PubMed] [Google Scholar]
- 79.Devore G. R. 2005. Three-dimensional and four-dimensional fetal echocardiography: a new frontier. Curr. Opin. Pediatr. 17, 592–604 10.1097/01.mop.0000172815.41519.a4 (doi:10.1097/01.mop.0000172815.41519.a4) [DOI] [PubMed] [Google Scholar]
- 80.Nelson T. R., Downey D. B., Pretorius D. H., Fenster A. 1999. Three-dimensional ultrasound. Philadelphia, PA: Lippincott-Raven [Google Scholar]
- 81.Fenster A., Downey D. 2001. Three-dimensional ultrasound imaging. Proc. SPIE 4549, 1–10 10.1117/12.440246 (doi:10.1117/12.440246) [DOI] [Google Scholar]
- 82.Fenster A., Downey D. B. 2000. Three-dimensional ultrasound imaging. In Handbook of medical imaging. Physics and psychophysics, vol. 1 (eds Bautel J., Kundel H., Van Metter R.), pp. 735–746 Bellingham, WA: SPIE Press [Google Scholar]
- 83.Nelson T. R., Pretorius D. H., Sklansky M., Hagen-Ansert S. 1996. Three-dimensional echocardiographic evaluation of fetal heart anatomy and function: acquisition, analysis, and display. J. Ultrasound Med. 15, 1–9 quiz 11–12 [PubMed] [Google Scholar]
- 84.Pretorius D. H., Nelson T. R. 1995. Fetal face visualization using three-dimensional ultrasonography. J. Ultrasound Med. 14, 349–356 [DOI] [PubMed] [Google Scholar]
- 85.Lee W. 2003. 3D fetal ultrasonography. Clin. Obstet. Gynecol. 46, 850–867 10.1097/00003081-200312000-00017 (doi:10.1097/00003081-200312000-00017) [DOI] [PubMed] [Google Scholar]
- 86.Deng J., Rodeck C. H. 2006. Current applications of fetal cardiac imaging technology. Curr. Opin. Obstet. Gynecol. 18, 177–184 10.1097/01.gco.0000192987.99847.a4 (doi:10.1097/01.gco.0000192987.99847.a4) [DOI] [PubMed] [Google Scholar]
- 87.Levoy M. 1990. Volume rendering, a hybrid ray tracer for rendering polygon and volume data. IEEE Comput. Graphics Appl. 10, 33–40 10.1109/38.50671 (doi:10.1109/38.50671) [DOI] [Google Scholar]
- 88.Mroz L., Konig A., Groller E. 1992. Maximum intensity projection at warp speed. Comput. Graph. 24, 343–352 10.1016/S0097-8493(00)00030-3 (doi:10.1016/S0097-8493(00)00030-3) [DOI] [Google Scholar]
- 89.Fruhauf T. 1996. Raycasting vector fields. In Proc. Visualization '96, San Francisco, CA, 27 October–1 November 1996, pp. 115–120 Piscataway, NJ: IEEE [Google Scholar]
- 90.Kniss J., Kindlmann G., Hansen C. 2002. Multidimensional transfer functions for interactive volume rendering. IEEE Trans. Visual. Comput. Graph. 8, 270–285 10.1109/TVCG.2002.1021579 (doi:10.1109/TVCG.2002.1021579) [DOI] [Google Scholar]
- 91.Sun Y., Parker D. L. 1999. Performance analysis of maximum intensity projection algorithm for display of MRA images. IEEE Trans. Med. Imag. 18, 1154–1169 10.1109/42.819325 (doi:10.1109/42.819325) [DOI] [PubMed] [Google Scholar]
- 92.Mroz L., Hauser H., Gröller E. 2000. Interactive high-quality maximum intensity projection. Comput. Graph. Forum 19, 341–350 10.1111/1467-8659.00426 (doi:10.1111/1467-8659.00426) [DOI] [Google Scholar]
- 93.Barnett P. A., Spence J. D., Manuck S. B., Jennings J. R. 1997. Psychological stress and the progression of carotid artery disease. J. Hypertens. 15, 49–55 10.1097/00004872-199715010-00004 (doi:10.1097/00004872-199715010-00004) [DOI] [PubMed] [Google Scholar]
- 94.Baldassarre D., Amato M., Bondioli A., Sirtori C. R., Tremoli E. 2000. Carotid artery intima-media thickness measured by ultrasonography in normal clinical practice correlates well with atherosclerosis risk factors. Stroke 31, 2426–2430 [DOI] [PubMed] [Google Scholar]
- 95.Baldassarre D., et al. 2007. Measurement of carotid artery intima-media thickness in dyslipidemic patients increases the power of traditional risk factors to predict cardiovascular events. Atherosclerosis 191, 403–408 10.1016/j.atherosclerosis.2006.04.008 (doi:10.1016/j.atherosclerosis.2006.04.008) [DOI] [PubMed] [Google Scholar]
- 96.Owens G. K. 1989. Control of hypertrophic versus hyperplastic growth of vascular smooth muscle cells. Am. J. Physiol. 257, H1755–H1765 [DOI] [PubMed] [Google Scholar]
- 97.Spence J. D. 2002. Ultrasound measurement of carotid plaque as a surrogate outcome for coronary artery disease. Am. J. Cardiol. 89, 10B–15B (discussion 15B–16B) 10.1016/S0002-9149(01)02327-X (doi:10.1016/S0002-9149(01)02327-X) [DOI] [PubMed] [Google Scholar]
- 98.Stary H. C., et al. 1992. A definition of the intima of human arteries and of its atherosclerosis-prone regions. A report from the Committee on Vascular Lesions of the Council on Arteriosclerosis, American Heart Association. Arterioscler. Thromb. 12, 120–134 [DOI] [PubMed] [Google Scholar]
- 99.Hennerici M., Baezner H., Daffertshofer M. 2004. Ultrasound and arterial wall disease. Cerebrovasc. Dis. 17(Suppl. 1), 19–33 10.1159/000074792 (doi:10.1159/000074792) [DOI] [PubMed] [Google Scholar]
- 100.Stary H. C., et al. 1994. A definition of initial, fatty streak, and intermediate lesions of atherosclerosis. A report from the Committee on Vascular Lesions of the Council on Arteriosclerosis, American Heart Association. Arterioscler. Thromb. 14, 840–856 [DOI] [PubMed] [Google Scholar]
- 101.Landry A., Fenster A. 2002. Theoretical and experimental quantification of carotid plaque volume measurements made by 3D ultrasound using test phantoms. Med. Phys. 10, 2319–2327 10.1118/1.1510130 (doi:10.1118/1.1510130) [DOI] [PubMed] [Google Scholar]
- 102.Delcker A., Diener H. C. 1994. Quantification of atherosclerotic plaques in carotid arteries by three-dimensional ultrasound. Br. J. Radiol. 67, 672–678 10.1259/0007-1285-67-799-672 (doi:10.1259/0007-1285-67-799-672) [DOI] [PubMed] [Google Scholar]
- 103.Delcker A., Diener H. C. 1994. 3D ultrasound measurement of atherosclerotic plaque volume in carotid arteries. Bildgebung 61, 116–121 [PubMed] [Google Scholar]
- 104.Delcker A., Tegeler C. 1998. Influence of ECG-triggered data acquisition on reliability for carotid plaque volume measurements with a magnetic sensor three-dimensional ultrasound system. Ultrasound Med. Biol. 24, 601–605 10.1016/S0301-5629(98)00012-X (doi:10.1016/S0301-5629(98)00012-X) [DOI] [PubMed] [Google Scholar]
- 105.Palombo C., Kozakova M., Morizzo C., Andreuccetti F., Tondini A., Palchetti P., Mirra G., Parenti G., Pandian N. G. 1998. Ultrafast three-dimensional ultrasound: application to carotid artery imaging. Stroke 29, 1631–1637 [DOI] [PubMed] [Google Scholar]
- 106.Delcker A., Diener H. C., Wilhelm H. 1995. Influence of vascular risk factors for atherosclerotic carotid artery plaque progression. Stroke 26, 2016–2022 [DOI] [PubMed] [Google Scholar]
- 107.Schminke U., Motsch L., Griewing B., Gaull M., Kessler C. 2000. Three-dimensional power-mode ultrasound for quantification of the progression of carotid artery atherosclerosis. J. Neurol. 247, 106–111 10.1007/PL00007790 (doi:10.1007/PL00007790) [DOI] [PubMed] [Google Scholar]
- 108.Zhao X. Q., Yuan C., Hatsukami T. S., Frechette E. H., Kang X.-J., Maravilla K. R., Brown B. G. 2001. Effects of prolonged intensive lipid-lowering therapy on the characteristics of carotid atherosclerotic plaques in vivo by MRI: a case–control study. Arterioscler. Thromb. Vasc. Biol. 21, 1623–1629 10.1161/hq1001.098463 (doi:10.1161/hq1001.098463) [DOI] [PubMed] [Google Scholar]
- 109.Fenster A., Downey D. B., Cardinal H. N. 2001. Three-dimensional ultrasound imaging. Phys. Med. Biol. 46, R67–R99 10.1088/0031-9155/46/5/201 (doi:10.1088/0031-9155/46/5/201) [DOI] [PubMed] [Google Scholar]
- 110.Fenster A., Downey D. 2000. Three-dimensional ultrasound imaging. In Handbook of medical imaging. Physics and psychophysics, vol. 1 (eds Beutel J., Kundel H., Van Metter R.), pp. 433–509 Bellingham, WA: SPIE Press [Google Scholar]
- 111.Fenster A., Downey D. B. 2000. Three-dimensional ultrasound imaging. Annu. Rev. Biomed. Eng. 2, 457–475 10.1146/annurev.bioeng.2.1.457 (doi:10.1146/annurev.bioeng.2.1.457) [DOI] [PubMed] [Google Scholar]
- 112.Nelson W. G., De Marzo A. M., Isaacs W. B. 2003. Prostate cancer. N. Engl. J. Med. 349, 366–381 10.1056/NEJMra021562 (doi:10.1056/NEJMra021562) [DOI] [PubMed] [Google Scholar]
- 113.Ding M., Fenster A. 2004. Projection-based needle segmentation in 3D ultrasound images. Comput. Aided Surg. 9, 193–201 [DOI] [PubMed] [Google Scholar]
- 114.Ladak H. M., Wang Y., Downey D. B., Fenster A. 2003. Testing and optimization of a semiautomatic prostate boundary segmentation algorithm using virtual operators. Med. Phys. 30, 1637–1647 10.1118/1.1584043 (doi:10.1118/1.1584043) [DOI] [PubMed] [Google Scholar]
- 115.Wang Y., Cardinal H. N., Downey D. B., Fenster A. 2003. Semiautomatic three-dimensional segmentation of the prostate using two-dimensional ultrasound images. Med. Phys. 30, 887–897 10.1118/1.1568975 (doi:10.1118/1.1568975) [DOI] [PubMed] [Google Scholar]
- 116.Ding M., Chiu B., Gyacskov I., Yuan X., Drangova M., Downey D. B., Fenster A. 2007. Fast prostate segmentation in 3D TRUS images based on continuity constraint using an autoregressive model. Med. Phys. 34, 4109–4125 10.1118/1.2777005 (doi:10.1118/1.2777005) [DOI] [PubMed] [Google Scholar]
- 117.Hu N., Downey D. B., Fenster A., Ladak H. M. 2003. Prostate boundary segmentation from 3D ultrasound images. Med. Phys. 30, 1648–1659 10.1118/1.1586267 (doi:10.1118/1.1586267) [DOI] [PubMed] [Google Scholar]


