Abstract
Anchorage-dependent cells such as smooth muscle cells (SMCs) rely on the transmission of actomyosin-generated traction forces to adhere and migrate on the extracellular matrix. The cellular traction forces exerted by SMCs on substrate can be measured from the deformation of substrate with embedded fluorescent markers. With the synchronous use of phase-contrast and fluorescent microscopy, the deformation of polyacrylamide (PAM) gel substrate can be quantitatively determined using particle image velocimetry. This displacement map is then input as boundary conditions for the stress analysis on PAM gel by the finite-element method. In addition to optical microscopy, atomic force microscopy was also used to characterize the PAM substrate using the contact mode, from which the elasticity of PAM can be quantified using Hertzian theory. This provides baseline information for the stress analysis of PAM gel deformation. The material model introduced for the computational part is the Mooney–Rivlin constitutive law because of its long proven usefulness in predicting polymers' mechanical behaviour. Numerical results showed that adhesive stresses are high around the cell edges, which is in accordance with the general phenomena of cellular focal adhesion. Further calculations on the total traction forces indicate a slightly contact-dominated regime for a broad range of Mooney–Rivlin stiffnesses.
Keywords: cellular traction force microscopy, particle image velocimetry, cellular adhesion, contact pressure
1. Introduction
Most cells undergo complex mechanical interactions with the environment and neighbouring cells through the formation of focal adhesions and other adhesive structures [1–8]. These mechanical interactions provide physical mechanisms for various basic cellular activities, such as adhesion, migration, communication, proliferation and differentiation. Such activities collectively drive embryogenesis, tissue morphogenesis, tumour metastasis, wound healing, etc. [9]. Although cellular adhesion is commonly recognized, only a few mechanical factors thus far have been elucidated in a quantitative manner owing to practical difficulties in both theories and experiments to characterize the interfacial interactions. Among various interactions, surface traction has been shown to be important in cellular functions [10–12]. Such traction is essentially bidirectional, reciprocal and dynamic across the interface between the cell and the extracellular matrix (ECM). Most cells can modulate the traction force dynamically according to the extracellular signals to maintain cell homeostasis and to initiate many cellular activities. More specifically, the modulation is carried out by biochemical molecules through actomyosin interactions and conformational changes in the cytoskeletal architecture. For example, the changes in the traction force can activate the integrin-dependent molecules, such as RhoGTPase, talin 1 and focal adhesion kinase, which then trigger a cascade of signalling pathways and alter gene expressions [13–17]. One renowned mechanotransduction theory, called ‘tensegrity’, indicates that the changes in the cytoskeletal three-dimensional architecture caused by mechanical signals could be transmitted to the nucleus via a direct mechanical link from the ECM to the nuclear chromatin [18]. These studies purposefully signal the necessity for a direct and rigorous measurement of surface traction at the cell–substrate interface for characterizing the chemo-mechanical feedback controls in cellular functions.
The microscopy approach in reconstructing traction forces was pioneered by Harris and co-workers [19,20], who first applied the deformable silicone substrata to probe traction forces qualitatively by the wrinkling assay. The complex relation between force and deformation (wrinkle) and the low resolution of the wrinkling assay made the quantitative measurement difficult. A more direct characterization of non-wrinkling silicone with embedded particles as indicators of deformation was later developed by Lee et al. [11]. However, the viscosity of the substrata used in Lee's study led to irreversible deformation and poor conditions for cell adhesion. Dembo & Wang further developed traction force microscopy by using the substrata prepared from polyacrylamide (PAM) gel with embedded fluorescent beads [21,22]. PAM gel has advantages over other materials because of its tunable mechanical compliance through changes in the reaction conditions for acryl amide polymerization. Furthermore, cell adhesion on PAM gel is not significant without the conjugation of adhesive ligands. Hence, PAM gel is ideal for studying mechanotransduction through the quantitative determination of tractions on the PAM gel surface induced by cells. The calculation of the cellular traction force (CTF) via the displacements of fluorescent beads is an inverse problem which can be ill-posed and requires some regularization (constraint with Lagrange multiplier) [4]. Here, the inverse problem means the following. Assuming the beads' displacement is obtained from the Fredholm integral of force with Green's function as a kernel, i.e. u(r) = ∫ dr′ G(r − r′)F(r′), the task is to search for the force F(r′) which yields the minimum difference between the calculated and measured displacements with presumed mechanical properties. Such a numerical process is an essential optimization problem, and, therefore, constraints on the force F(r′) are needed to avoid unrealistic solutions as well as numerical divergence. This inverse problem can be solved by the forward model formulated previously by Sabass et al. [23] and Pelham & Wang [24,25]. More recently, Dembo and co-workers [21,22] employed the Boussinesq solution to approximately determine the two-dimensional Green compliance tensor G(r − r′) for cases when the thickness of the substratum is much larger than the maximum marker displacement (approx. 1 µm/70 µm). However, the determination of the Green tensor is complicated and the displacement of the beads is heavily dependent on the image resolution. More challenges lie in finding the force distribution. Generally, some smoothing operations should be included when calculating the Fredholm integral because force F(r′) is highly sensitive to small changes in displacement u(r) and one-to-one mapping may not exist between them. A remedy proposed by Butler et al. [26] using Fourier transform traction cytometry (FTTC) is more efficient than directly applying the Boussinesq solution to find G(r − r′). The key difference is that FTTC works out the Fredholm integral in the Fourier space instead of the real space; it thus requires no smoothing operation and hence less complex computation. It should be noted that FTTC is formulated either (i) bound constrained (a mixed boundary value problem in which the displacements under the cell are specified using the measurement, and zero tractions outside the cell boundary) or (ii) unconstrained (specifying all displacements using the measurement; no tractions specified) to determine the CTF.
In general, approaches based upon the Boussinesq solution and the Fredholm integral restrict the substratum material to be linear elastic. They also require some specific mappings of the displacement field on the substratum surface. These devices are set up for mathematical convenience to determine G(r − r′) and avoid ill-posed issues. A more robust approach for such mapping is digital image correlation (DIC), originally developed by Yang et al. [27] and Chu et al. [28] and a more modern version by Brock et al. [29] and Berfield et al. [30]. In this technique, a statistical correlation function among different parts of a digital image pair is employed to measure the movement of objects in the images. DIC was extensively used in many bioimaging studies for probing cell mobility and cytoskeleton dynamics [26,30–33]. Another interesting issue is that the Boussinesq solution assumes the substratum to be an infinite half-space. Such an assumption can be accurately achieved only if the displacement field by the traction force is small when compared with the substratum's lateral dimensions and thickness. For a medium with low elastic modulus such as PAM gel, a small deformation is hard to guarantee, and, if its thickness exceeds 100 µm, the substratum can be easily deformed by its own weight. One practical way to circumvent this limitation is to analyse the three-dimensional gel by finite-element (FE) analysis [26,30–33]. The measured displacement field from experiments is directly applied as boundary conditions without using any specific mapping, as seen in other methods.
In this study, rat aorta smooth muscle cells (SMCs) are chosen as the model for probing the CTF on a PAM gel substratum. The study was carried out in two steps. First, atomic force microscopy (AFM) was used to characterize the stiffness of the PAM film. Second, the deformation images of the PAM substratum induced by cell traction were probed by fluorescence microcopy. The deformation was measured by the relative position of displaced fluorescent latex beads via particle image velocimetry (PIV). The measured data (displacement) were then input as boundary conditions for the subsequent finite simulation. In the simulation, a nonlinear (Mooney–Rivlin) material model was employed and the optimal range of PAM mechanical properties was investigated as well.
2. Material and experiments
2.1. Preparation of activated glass coverslips
PAM gel was immobilized on the surface of activated coverslips in order to prevent the gel from floating off during the CTF microscopy assay. The surface activation procedure used herein was developed by Alpin & Hughes [34]. Glass coverslips (Φ31.4 mm, 0.17 mm thickness; Willco) were first sterilized by briefly passing them through the inner flame of a Bunsen burner. Then 0.1 N NaOH was smeared on the coverslip surface and dried under a nitrogen stream. Then 3-aminopropyltrimethoxysilane (Sigma, Saint Louis, MO, USA) was loaded evenly on the coverslips and incubated for 5 min. The coverslips were washed with distilled water thoroughly and then covered by 0.5 per cent glutaraldehyde in phosphate-buffered saline (PBS; Sigma) for 30 min. After this, the coverslips were again washed extensively with distilled water and stored at 4°C for up to 48 h for later use. The resulting aldehyde groups ( ) on the surface of the coverslips will form strong covalent bonds with the PAM gel (
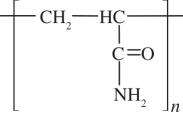 ).
).
2.2. Preparation of polyacrylamide sheets
The PAM sheet was prepared by dissolving 8% v/v acrylamide (40% w/v; Sigma) and 0.1% v/v N,N′-methylene bis-acrylamide (BIS; 2% w/v, Sigma) in distilled water. The solution was degassed for 30 min with nitrogen in order to optimize the polymerization. Then ultrasonicated 0.2 µm fluorescent latex beads (fluorescein isothiocyanate labelled; Invitrogen) at 1/1000 volume concentration were added to the solution. Another 1/2000 of N,N,N′,N′-tetramethylethylenediamine (Sigma) and 1/200 of ammonium persulphate (10% w/v; Sigma) in volume concentration were also added as initiators and catalysts to trigger free radical polymerization of the acrylamide. To prepare a thin sheet of PAM, a small amount of mixture was dropped onto the activated coverslips and immediately overlaid with a piece of inert plastic sheet. The coverslips were then placed upside down to allow the fluorescent latex beads to precipitate onto the surface of the hydrogel sheet. This polymerization process has to be at least 30 min to allow the beads to settle [12,34–36].
The thickness of the PAM sheet was estimated from the initial volume of the polymer solution applied onto the coverslip and the area of the gel. The actual thickness of the swollen gel was measured by a microscope with focus ranges from the glass surface up to the gel surface. The thickness of the gel under the swollen condition is estimated to be 70 µm on average.
2.3. Conjugation of collagen to the polyacrylamide surface
PAM is highly hydrophilic and chemically inert. Therefore, a photoactivatable heterobifunctional reagent, sulphosuccinimidyl-6(4′-azido-2′-nitrophenylamino) hexanoate (Sigma), also known as sulpho-SANPAH, was used as the molecular bridge to link the cell ECM proteins (1 mg ml–1 type I collagen) to the PAM gel [34]. Sulpho-SANPAH comprises phenylazide groups at one end, which react non-specifically with PAM under UV irradiation, and sulphosuccinimidyl groups at the other end, which can react with primary amines in the ECM proteins [35].
2.4. Cell culture
Rat aorta SMCs (A7r5 rat fibroblast; ATCC) were cultured in high glucose Dulbecco's modified Eagle medium (DMEM) supplemented with 10 per cent foetal bovine serum (FBS), 5 mg ml–1 penicillin and 5 mg ml–1 streptomycin (Invitrogen Inc.). Cells were maintained at 37°C under a humidified atmosphere with 95 per cent air and 5 per cent carbon dioxide. The culture medium was changed every 2 days, and cells were cultured at least once a week. Before every experiment, cells were detached from the culture flask by adding 5.3 mM trypsin-ethylenediaminetetraacetic acid (EDTA) solution in 1× PBS. The cell suspension was transferred to a 15 ml Falcon tube and then centrifuged at 1500 r.p.m. for 5 min. After centrifugation, the trypsin was removed and the remaining cell pellets were re-suspended in the DMEM medium supplemented with 10 per cent FBS. The cells were then plated onto the PAM gel surface at a density of around 13 cells mm–2 for traction force microscopy. All experiments conducted in this study used cells before 10 passages. After 24 h of seeding, healthy cells found at a distance of at least 200 µm away from the edges of the PAM substratum were chosen for CTF measurement. This was to avoid the edge effect and minimize cell–cell interactions.
2.5. Live cell traction force microscopy
Live cell microscopy was performed on an inverted light microscope (Olympus IX71) using a LUCPlanFLN 40×/0.60 Ph2 objective (Olympus) on a motorized stage (BioPoint 2, Ludl Electronic Products). The PAM substratum on the modified coverslip seeded with cells was mounted onto a microscope perfusion chamber where the desirable environmental parameters were controlled. Throughout the experiment, the temperature of the chamber was maintained at 37°C using a Tempcontrol 37-2 Digital and Heating Unit (Leica). Five per cent carbon dioxide and the humidity of the microscope stage were controlled by a humidifier system (CTI-Controller 3700, Leica). Photographs were taken of the cells with phase-contrast optics to visualize the cells' shape and location, and with fluorescein illuminating at 490 nm to excite the fluorescent beads with emission at 515 nm. In order to assess the displacement of beads under the null-force condition, culture medium was removed and trypsin was added to detach the cells from the PAM gel surface. Once the trypsinization was completed, both phase-contrast and fluorescent images were taken again at the proximal location to obtain the beads' positions for the assumption that the gel would return to its initial state without cells. The set of images taken after the removal of cells were called the ‘null-force’ images.
2.6. Image processing the displacement field on the substratum surface
A PIV program coded in Matlab (MatPIV) was used to quantify the displacement of microbeads induced by the CTF. PIV calculates the average movement of many nearby particles inside a small window directly from a pair of digital images taken at two contiguous instants. The theories behind this numerical process will be discussed later.
2.7. Characterization of the elastic mechanical properties of the polyacrylamide substratum
The mechanical properties of PAM have to be measured before the traction force analyses. The measurement was carried out by AFM (Asylum Research, model MFP-3D) with water immersion capability for a flat, homogeneous PAM substratum with average thickness of 70 µm under swollen conditions [37,38]. A contact mode with a spring constant of 0.32 N m–1 was applied via the silicon nitride cantilevers (Sharpened Microlevers, Crest Technologies). Both the velocity of the cantilever and the indentation depth were carefully controlled during the test. In addition, the unloaded cantilevers were calibrated before the test to measure the thermally induced motion of gels under water immersion, which was automatically discounted from measurements in the indentation test.
3. Results
3.1. Estimate of the elasticity of the polyacrylamide substratum
Figure 1 shows the schematic details of the AFM indentation and the force–indentation relation, from which we can have the following indentation–deflection relation [37]:
 |
3.1 |
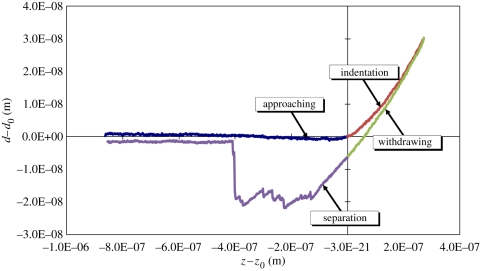
where k = 3ESiN I/L3 is the stiffness of the silicon nitride cantilever. This equation is used to determine the elasticity of the substratum (E) by fitting the indentation–deflection curves from the AFM measurement. An example of the AFM measurements on a flat, homogeneous PAM substratum under swollen conditions is shown in figure 2, where a full cycle of the loading and unloading process is demonstrated by the indentation–deflection (z − z0 versus d − d0) curve. For a small deflection of the cantilever, the relation between the applied force F and the indentation depth δ on an elastic medium is presumed to be the Hertzian contact via [37,39]
 |
3.2 |
where E is the elastic modulus and ν is the Poisson ratio of the substratum, and α is the half-cone angle of the cantilever tip.
Figure 1.
A schematic of AFM indentation and the indentation–deflection relation.
Figure 2.
Experimental measure of the AFM indentation curve for the PAM substratum using the contact mode.
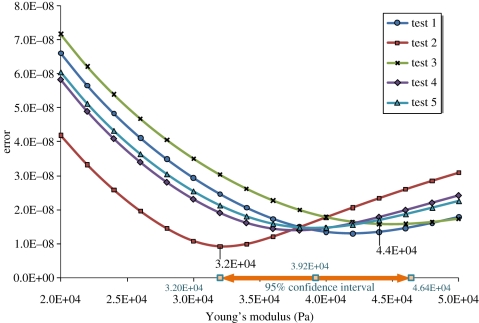
Owing to its high content of water, PAM is almost incompressible and thus its Poisson ratio is close to 0.5 [40]. The initial deflection and height of the cantilever, d0 and z0, can be located directly from the experimental curves. Therefore, the slope of any two points on the curve can be used to calculate the value of E from equation (3.1) [37,38,41–44]. However, the choice of points is too arbitrary. In order to yield an accurate estimate, an optimization approach was employed. By iteratively specifying different values of E in equation (3.1) to calculate z at every d from the measured data, the average difference (L2 norm) between zexperimental and zcalculated along the loading force curve can be minimized when an optimal elastic modulus is found. This approach ensures that every point along the experimental loading force curve was taken into account in the determination of the optimal E value. Figure 2 shows one example result of the AFM measurements. The adhesion between the tip and the PAM gel can also be seen in the third (withdrawing) and fourth (separation) quadrants. There was a total of five measurements taken at different locations on a PAM gel and the range of optimal E was found to be between 32 and 44 kPa. Figure 3 gives the optimal Young's moduli and their corresponding minimum errors (average of (zexperimental − zcalculated)2). With the t-test on the mean value of the optimal Young's moduli (39.2 kPa), we can determine the 95% confidence interval of the modulus, as shown in table 1. This interval confirms the range of the optimal modulus as marked on the abscissa in figure 3.
Figure 3.
Errors between the calculated and experimental measures of AFM indentation for the PAM substratum using the contact mode. The attainable minimum errors fall in the range between 32 and 44 kPa (figure 2 is the result of test 3). The confidence interval was calculated based on the two-tailed test in table 1.
Table 1.
Two-tailed t-test on the mean of the optimal Young's modulus estimated from AFM; optimal C10 and C01 estimated from FE analysis.
|
t-test on the mean of Young's modulus from AFM | |||||
|---|---|---|---|---|---|
| d.f. | sample mean | sample std. dev. | significant level | t0.05 | 95% CI |
| 5 | 3.92E + 04 | 4.60E + 03 | 0.0500 | 3.4954E + 00 | 4.6397E + 04 |
| 3.2003E + 04 | |||||
| t-test on the mean of C10 and C01 from FE analysis | |||||
| d.f. | sample mean | sample std. dev. | significant level | t0.05 | 95% CI |
| 5 | 3.50E + 03 | 1.77E + 02 | 0.0500 | 3.4954E + 00 | 3.7763E + 03 |
| 3.2237E + 03 | |||||
3.2. Hyperelasticity of the polyacrylamide substratum
To quantitatively assess the mechanical response of the PAM gel induced by cell traction, numerical analysis is needed to simulate the experiment. The ensuing goal is to examine the contact between the cells and the PAM substratum. Two basic mechanical properties, namely Young's modulus (E) and Poisson's ratio (ν), are still needed. As mentioned previously, Poisson's ratio shall be assumed to be 0.5 under the assumption of incompressibility for PAM [40]. A more realistic material model, the Mooney–Rivlin constitutive relation, is chosen for the simulation. The Mooney–Rivlin constitutive law has been used in numerous studies of rubber-like or synthetic and natural polymeric materials, e.g. gelatin pork skin, poly(l-lysine)/hyaluronic acid, carotid arteries, poly(dimethylsiloxane) [45–50]. The formulation of the Mooney–Rivlin law is based upon the theories of hyperelasticity. Hyperelasticity refers to materials that are able to recover completely from a finite deformation to their undeformed state. This material model assumes a special form of the strain energy function W as follows [45–50]:
| 3.3 |
where c10, c01 and κ are empirical material constants;  are reduced strain invariants, each defined as
| 3.4 |
by the three invariants Ii of the Cauchy–Green strain tensor: I1 = Cii,  and I3 = det (Cij). The Cauchy–Green strain tensor is calculated from the kinematic (strain–displacement) relation
| 3.5 |
where fik = ∂xi/∂Xk is the deformation gradient, and Xk, xi are components of the position vectors of a material point before and after deformation along the direction i and k, respectively. Overall, the strain energy W is a function of the Cauchy–Green strain. Its first derivative yields
 |
3.6 |
where Sij is the second Piola–Kirchhoff stress tensor, representing the force per unit area in the undeformed body. In contrast to the commonly used Cauchy stress (σkl), which measures the force per unit area in the deformed body, the two stress measures are algebraically related to each other by the deformation gradient as
| 3.7 |
where the superscript –1 and T represent the inverse and transpose of a tensor, respectively, and J = det (fik) is the Jacobian determinant. The Cauchy stress (σkl) has to satisfy the equilibrium equations ∂σkl/∂xl = 0 in all coordinate directions. Equations (3.5)–(3.7) together would allow us to express the equilibrium equations in terms of the deformation gradient and solve them numerically. Note that the transformation in equation (3.7) is considered to be valid as long as the material density is constant throughout the deformation.
3.3. Connections among different mechanical properties
We have noticed that the AFM data yield an optimal estimate of Young's modulus. It is thus necessary to discuss the connections among various material constants before the implementation of FE simulations. Assuming the incompressibility of PAM, Poisson's ratio is assigned to be 0.49 instead of 0.5 to avoid numerical singularity. Also, κ is assigned to be 0.7 × 10⁻³ to guarantee a marginal effect from the volumetric change  in the Mooney–Rivlin model. The connection between Young's modulus and c10, c01 comes from the uniaxial tension when the Cauchy–Green strain tensor reduces to one single component—the stretch ratio λ and then the following expression can be obtained [46,47,49]:
| 3.8 |
In other words, Young's modulus corresponds to the initial slope of the stress–strain curve for the Mooney–Rivlin materials under uniaxial tension. This argument leads to the following relation between the initial shear modulus μ and c10, c01:
| 3.9 |
Obviously, either equation (3.8) or (3.9) can be used to estimate c10, c01 based on the measured Young's modulus from the AFM measurements. In general, Young's modulus and c10, c01 are not necessarily related to each other. We can always conduct a stand-alone study on the hyperelastic properties of the chosen polymeric materials whenever needed [46,47,50].
3.4. Justification of the hyperelasticity of the polyacrylamide substratum
One prerequisite before the FE analyses are carried out is to have an estimate of the Mooney–Rivlin constants C10 and C01. This task was carried out by an FE simulation of the nano-indentation using a concentrated force applied to the central node of a representative volume, i.e. the PAM substratum. The calculated displacement in the z-direction at the central node is the indentation (z − z0). Comparing this FE-calculated indentation with data from the AFM tests at different levels of forces (k(d − d0)), the minimum errors between the simulations and the tests can be located around 3.25–3.75 kPa for equal values of C10 and C01, as shown in figure 4. Different C10 and C01 values tend to increase the errors slightly in our cases, although this may not be universally accurate for other PAMs. Note that the equal values of C10 and C01 simply imply an equivalent contribution to the strain energy by the principal and deviatoric strains ( ,
,  ).
).
Figure 4.
Errors between the simulation and AFM indentation for the PAM substratum using the contact mode. The attainable minimum errors fall in the range between 3.25 and 3.75 kPa for equal C10 and C01. These errors are relatively smaller than those in figure 3.
Let us further examine the values of C10 and C01. If the choice of Young's modulus from linear elasticity is 39.2 kPa, which is the mean value from AFM measures in figure 3, then from equation (3.9) the corresponding values of C10 = C01 ≈ 3.267 kPa can be calculated presuming that the initial slope of the stress–strain curve is 39.2 kPa. Such a rough estimate yields a value remarkably close to the lower bound from the results of FE analysis–AFM comparison in figure 4. In other words, the genuineness of the hyperelastic behaviour of PAM is further demonstrated.
Additionally, the t-test on 95% confidence intervals from figures 3 and 4 (cf. table 1) indicates that the range of Young's modulus (32.0–46.4 kPa) is much higher than that of C10 and C01 (3.22–3.79 kPa). In principle, as Young's modulus corresponds to the initial slope of the stress–strain curve in hyperelasticity, it also serves as an upper bound of material stiffness. Those values in table 1 robustly support this principle of hyperelastic PAM without using the hypothesis test.
3.5. Displacement field on the polyacrylamide surface under cellular traction force
The experimental design to investigate the traction of a single cell on the PAM surface is shown in figure 5, where the traction forces are transmitted from the cell to the gel surface via transmembrane molecules, such as integrins. The embedded fluorescent latex beads just beneath the gel surface were used as markers to track the gel deformation caused by the CTF. The measurement of the displacement field of the beads was obtained from a pair of images; one showed the original position of the beads without the cell on top and the other was in the presence of the cell. The quantitative numbers of the displacement field were obtained by the PIV, in which a cross-correlation function was introduced to derive the local motion of beads statistically [51]. Once the displacement field is determined, the mechanical stresses and strains can be analysed by a well-established numerical approach, such as the FE method.
Figure 5.
Schematic of cell ligand bond to a PAM substratum. (Online version in colour.)
The phase-contrast image of an SMC is shown in figure 6a. Prior to quantifying the beads' displacement field, it is important to overlay the pair of fluorescent images before and after trypsinization to correct the misalignment owing to the drift of the sample on the motorized stage and to minimize systematic errors [10,25,34,52]. It is also necessary to take several fluorescent images at different focal planes in the same region in order to prevent mismatching of the image pairs. This is because the two images from before and after trypsinization might not be taken at the same focal plane. Figure 6b shows the fluorescence images at the same location in figure 6a. Figure 6b shows the two overlaid images before and after trypsinization (force-loaded and null-force). Each dot represents one 0.2 µm fluorescent bead. Moreover, pseudo-colours were applied to the fluorescent beads which appear green when SMCs were present (force-loaded), and red when SMCs were absent (null-force). When two images were overlaid, beads with zero displacement before and after trypsinization are shown by yellow dots whereas a pair of nearby red and green dots indicate that the embedded bead was displaced by a distance. For the reader's reference, the cell boundary is also marked by the white dashed lines traced from figure 6a.
Figure 6.
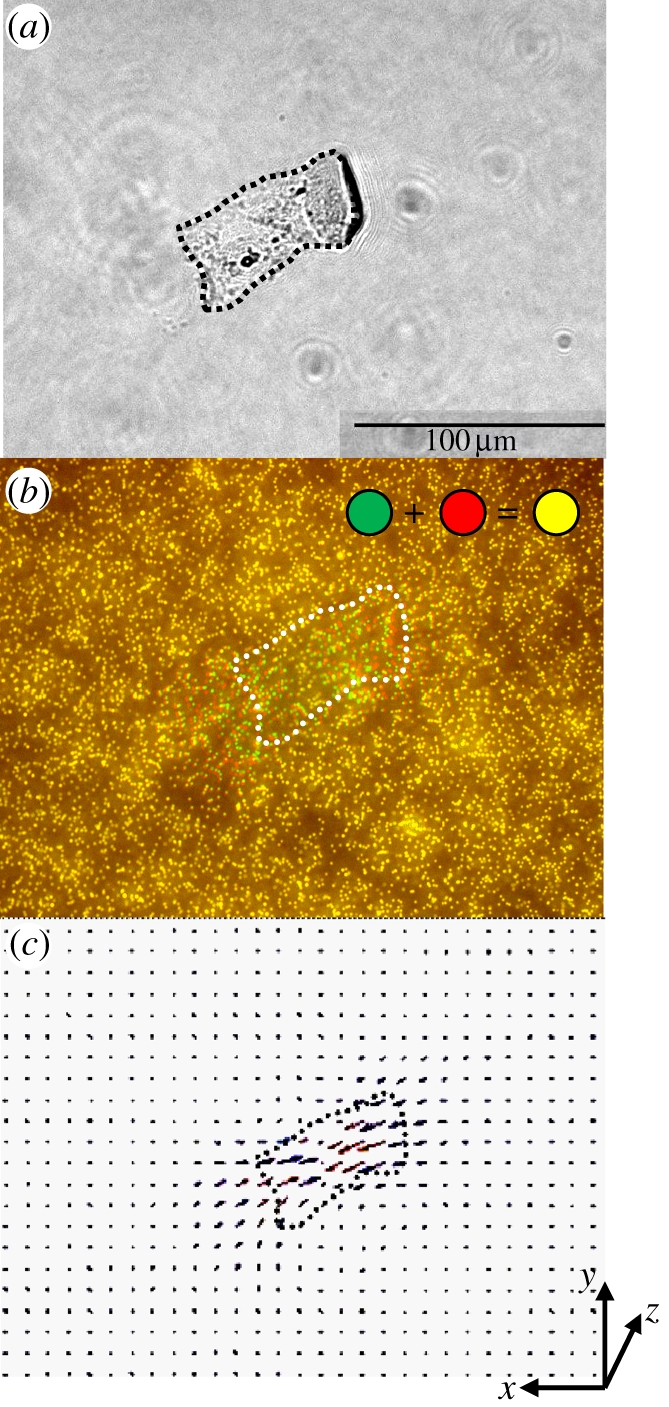
Tangential deformation of the PAM gel surface caused by cell traction force on the XY plane. (a) A phase-contrast image of rat aorta SMCs, cultured on the flexible PAM covered with collagen type I. (b) Overlaid fluorescent images of the 0.2 µm microbeads embedded underneath the surface of the PAM gel. The fluorescent image is taken at the same field of view as in (a). (c) Bead displacement (pixel) vector field computed from two fluorescent images taken before and after cell detachment. The missing vectors are interpolated and shown as red arrows.
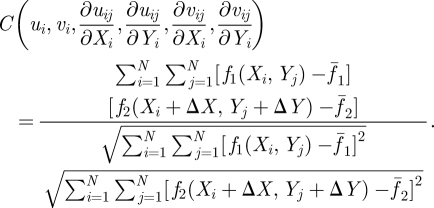
Figure 6b shows that more green and red dots appeared underneath the cell area and almost all yellow dots were found at a distance further away from the cell body. In other words, cell traction is a highly localized effect concentrating in the area occupied by cells. A careful examination reveals that more green and red dots tended to be around the cell peripheries rather than the interior of the cell body. This may be caused by cellular movement via mechanotransduction at the focal adhesions, typically initiated at the edges of cells [30,53,54]. Figure 6b contains over a few thousands of beads in the images, thus it is advisable to determine the bead displacement statistically on groups of beads rather than on individual ones. Therefore, PIV is implemented through the method of DIC to gauge the displacement of beads based on the following cross-correlation function:
 |
3.10 |
The relation between the pixels (Xi, Yj) and (Xi + ΔX, Yj + ΔY) in two images is
 |
3.11 |
where uij, vij are x- and y-displacement of the (i, j) pixel point; N is the pixel number (size) inside the interrogation window; f1(Xi, Yj) and f2(Xi, Yj) are the intensity of the image at the pixel point (i, j) in each image;  represent the average value of f1(Xi, Yj) and f2(Xi, Yj) in each window; ΔX, ΔY are the shift (or overlap) of the interrogation window between the two images.
The value of C is between 0 and 1; the higher the value of C, the closer the relation between the images at (Xi, Yj) and (Xi + ΔX, Yj + ΔY). Therefore, the objective is numerically to search a location in the second image that is most consistent with the one in the first image, i.e. finding the location with maximum C. Note that the search for maximum C is on all six variables (ui, vi, ∂uij/∂Xi, ∂uij/∂Yi, ∂vij/∂Xi, ∂vij/∂Yi). To expedite the computation, a common practice is to calculate the numerator terms in equation (3.10) by fast Fourier transform. Also, the iterative calculation should cover the whole image for at least one time [55]. A free program, MatPIV, distributed under the GNU general public license, was adopted for our study [56–59]. This program has functions to remove the vectors and interpolate missing vectors by the Kriging method [60–62]. Both vectors (spurious and missing) are due to the background noises or defocus of images. The image of the displacement field computed by PIV is shown in figure 6c by green arrows for the pair of fluorescence images in figure 6b. Figure 6c shows further processing of figure 6b with the removal and interpolation of data to establish a well-defined displacement field, which is ready for FE analyses as the input data.
3.6. Finite-element analysis of experimental results
The deformation and stress analysis of a PAM sheet is implemented by the FE software ANSYS11. Starting with the geometry of a PAM gel with dimensions 1638.91 × 1188.21 × 70.0 µm, the whole domain (PAM substratum) is discretized by isoparametric, 20-node brick element SOLID186 (figure 7). The boundary conditions are specified displacements from the PIV results, as shown in figure 6c, at corresponding nodes on the surface underneath the cell. The nodes on the bottom of the substratum are fixed because the PAM gel is immobilized on the coverslip. The specified displacement field on the xy plane is shown in figure 8, where both the contour and vector plots are presented in comparison with the PIV calculated bead displacement field shown in figure 6c. The vector plot is particularly illustrative for the xy displacements between the two fluorescent images before and after cells are detached from the PAM. In other words, we successfully demonstrated that the planar deformation of gel, which was obtained experimentally and analysed quantitatively by the PIV image processing of the microbeads' movement, can be directly used as the input (boundary conditions) for subsequent FE analyses.
Figure 7.
Coordinates and geometry of a PAM gel with dimensions 1638.91 × 1188.21 × 70.0 µm for FE analysis. The boundary conditions are specified displacements at corresponding nodes, generated from the PIV calculations on the movement of silica beads as shown in figure 6c. The bottom of the substrate is fixed because of its attachment to the coverslip. (Online version in colour.)
Figure 8.
Tangential (x–y) displacement field induced by SMCs from PIV calculations and specified for FE analysis. Both the contour and vector plots are presented for a comparison with figure 6c. Dotted lines are the boundary of the SMCs.
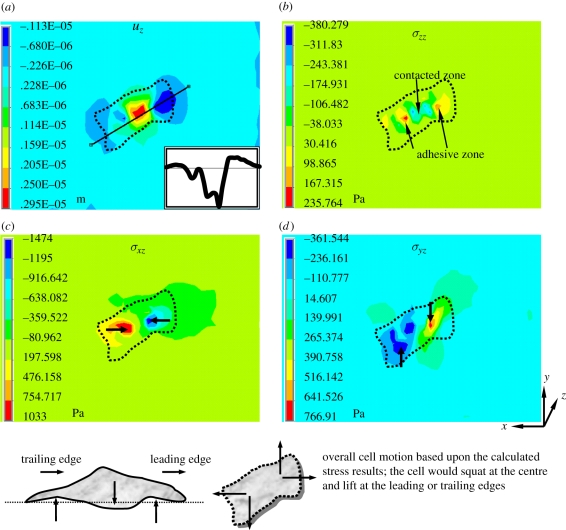
Figure 9a demonstrates one example result of the calculated vertical displacement uz with a selected line of deformation profiles (insets of figure 9a). The choice of Young's modulus is 39.2 kPa from figure 3 and corresponding values of C10 = C01 = 3.267 kPa are estimated from equation (3.9) as mentioned earlier. The FE calculation with the Mooney–Rivlin model predicts the PAM gel surface to be sagging at the centre and bulging around the edge within the area underneath the cell. This result is consistent with the phenomenon of focal adhesions, in which a high concentration of integrins appear around the edge of the cell as protrusions such as lamellipodia or hairlike filopodia to drive its motion. The cellular traction exerted by cells thus pulls the PAM surface upwards. Focal adhesions serve as the physical linkages between cells and the ECM to sense and transmit CTF in order to regulate the movement of the cell [63–65].
Figure 9.
Displacement and stress contours for linear elastic, E = 39.2 kPa, and nonlinear elastic, C10 = C01 = 3.267 kPa, models. Profile of vertical deformation beneath the cell across the selected line is indicated in the insets of (a).
We further check the numerical values of the displacement fields in figure 9a and compare them with the results from some other studies. In our results, the range of ux, uy is –1.13 ∼ 2.95 µm. Studies used as the references to evaluate our models are as follows: ux and uy: 0.20 ∼ 1.20 µm, uz: –0.64 ∼ 0.39 µm by Hur et al. [63]; ux and uy: 0.50 ∼ 3.00 µm by Bulter et al [26]; ux and uy: 0.20 ∼ 1.40 µm by Yang et al. [27].
The FE-calculated normal and shear stresses are shown in figure 9b–d. The directions of the shear stresses are indicated by the arrows shown in the figure. Both σxz and σxy help to indicate the direction of cellular motion. One noticeable result is from the normal stress σzz, which indicates the regions of contact and adhesion located at the cell's centre and periphery, respectively. When cross-examining the results of uz, we found that the cell would squat or crouch at its centre and pull up its leading and trailing edges in order to move. Note that, although the cell pressed down the substratum at its centre, the adhesion still existed in the contact region because of the omnipresence of integrins on the cell's bottom surface. The adhesion is overwhelmed by contact pressure and thus the resulting σzz is negative. This example case demonstrates that FE simulation can provide some insights into the experimental results of traction force microscopy.
4. Numerical verification
4.1. Consistency check on finite-element analysis
The available data from images are two-dimensional with displacements in the x- and y-directions only. But FE analysis did provide three-dimensional results, e.g. the vertical displacement (uz). Since uz is virtually unknown, we have to validate the calculations. One way to verify the calculations is to examine the contact region in order to make sure that the region with contact has high levels of stresses, while the non-contact zone has low levels of stresses. Consider two bodies in contact—the contact stress (both normal and shear) exists only within the contact region. Outside the region, the surfaces of both bodies are traction-free. Assuming a point x position outside the contact region Ω, then the traction-free condition at x can be generally expressed as
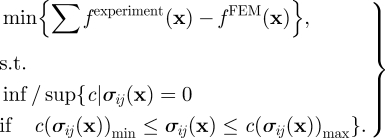
where n is the normal vector of the surface. For the case of the PAM substratum underneath the cells, the normal direction is in the z-direction, thus n = (0,0,−1). This leads to the condition that σzz = 0, σxz = 0 and σyz = 0 at points on the PAM surface outside the contact region. In the current FE analysis, there is no specified area of contact, and, therefore, whether the traction-free condition can be met outside the contact region is unknown. In order to identify the contact region, the following process was implemented: (i) converting the contrast microscopic image into black–white scale and filtering out noise; also creating an equal size black–white map as a template for FE nodal information. The pixel values of these two maps are denoted as fexperiment (xi) and fFEM (xi), respectively; (ii) picking up a threshold value c so that σi(xi) = 0 if c(σij (xi))min ≤ σij (xi) ≤ c(σij (xi))max; (iii) specifying fFEM (xi) = 0 if correspondingly σij(xi) = 0; and (iv) calculating the difference ∑xi fexperiment (x) − fFEM (x). These processes were iterated until the minimum of the difference was obtained for a selected value of c. In summary, the aforementioned process can be compactly expressed as
 |
4.1 |
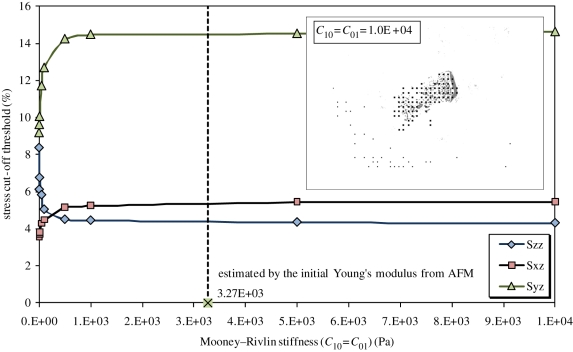
Figure 10 presents the results of detecting the contact region by comparing the FE results with the contrast microscopic image for different Mooney–Rivlin constants. It seems that the threshold value c converges to a constant for all three stress components when c10 or c01 is larger than 10 kPa, which covers the range of the optimal Young's modulus from AFM (32–44 kPa). The contact region identified by the FE map fits the contrast microscopic image reasonably well.
Figure 10.
Contact region detection by the cut-off threshold on FE nodal stress to make an FE map and then compared with the contrast microscopic image. (Online version in colour.)
5. Discussion on traction force
5.1. Traction force calculation finite-element analysis
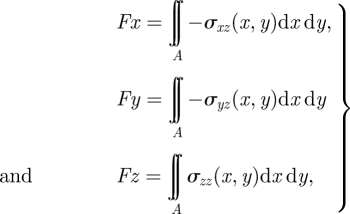
The shear stresses σxz, σyz and normal stresses σzz obtained from previous FE analysis can be used to calculate the traction forces on the PAM surface via the following the expressions:
 |
5.1 |
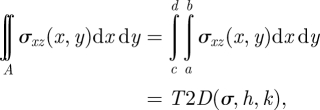
where the area of integration is contained within the area underneath the boundary of the cell. Since the values of stresses are at discrete nodes and the integration involves double integrals, numerical integration is necessary for the calculation. The simple trapezoidal rule is used for the calculation, as shown in the following example expressions [66]:
 |
5.2 |
where
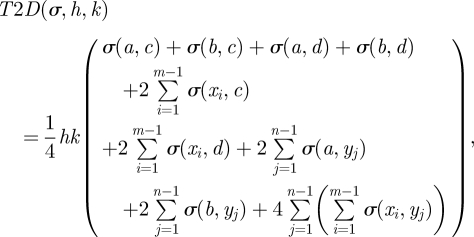 |
5.3 |
were h and k are intervals in the x- and y-directions, respectively;
| 5.4 |
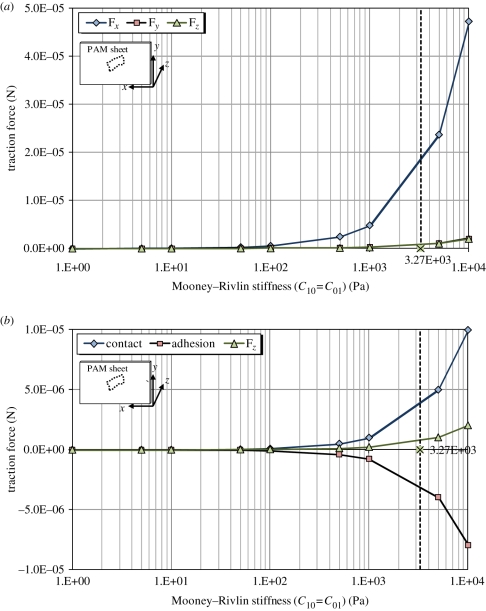
Uniformly discrete grid points were used for the calculation and these points are nodes from the FE analysis. Following this numerical integration, we can determine traction forces in all three directions for different material constants (c10, c01 for Mooney–Rivlin), as shown in figure 11. Negative c10, c01 values were not included although they are allowable for certain classes of polymers [47–50].
Figure 11.
Calculated traction forces on the PAM surface induced by the cell as a function of different material constants; (a) all three forces in the x-, y- and z-direction; (b) the breakdown of Fz into adhesion and contact pressure. The positive values of Fz indicate that the contact pressure slightly dominates over adhesion between the cell and the PAM sheet. (Online version in colour.)
5.2. Cell motion and traction force
The variation in traction forces in figure 11 reveals some interesting features. First, their magnitude increases as the PAM stiffens since a larger force is needed to attain the same level of surface deformation in a stiffer material. Second, the normal force Fz was found to be positive for positive c10, c01 owing to the slightly dominating contact pressure between the cell and the substratum. The Fz is around 1 µN from the estimated C10 = C01 = 3.267 kPa. Last, the larger tangential force Fx compared with Fy implies a strong tendency of the cell to move horizontally since Fx is the driving force to move cells along the x-direction. Generally, a cell tends to exhibit greatest traction forces around its leading edges owing to the adjusted orientation of cytoskeletons in response to focal adhesions [33,67,68]. Therefore, the higher shear stresses in figure 9 directly lead to higher Fx in figure 11.
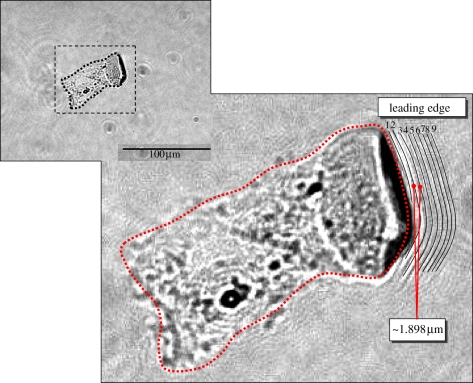
By sheer luck, we caught the image of a series of wavefronts just to the right of cell, which was evidently generated by the motion of the cell. Figure 12 provides some details of this observation. If the velocity of the medium surface wave is equal to the frequency multiplied by the wavelength and the camera shutter speed is around 1/60 to 1/15 seconds then we estimate that the wave velocity is about 9/(1/60 – 1/15)(1/s) × 0.1898 (µm) = 0.0285–0.1139 (µm s–1). Such a speed seems to be closer to the velocity generated by normal cells ((epithelial MCF-7) 0.003–0.1 µm s–1) [69] than that generated by cancer cells (0.002–0.444 µm s–1 (breast cancer cell), 0.0005–0.003 µm s–1 (melanoma cells)) [70,71].
Figure 12.
Ripples generated by the cell moving to its right. This may serve as an explanation for the larger horizontal force Fx in figure 11 from FE analysis. (Online version in colour.)
6. Conclusion
In conclusion, rat aorta SMCs are chosen for the study of CTF on a PAM substratum. The PAM substratum is prepared to a desired concentration with chemically mixed fluorescent microbeads and immobilized on chemically activated coverslips. The traction forces between the cells and the PAM are marked by the movement of embedded fluorescent microbeads just beneath the gel surface, which portrays the gel deformation caused by CTF. The measurement of the displacement field is obtained from a pair of images, one shows the original position of the beads without a cell on top and the other is in the presence of a cell. Then the displacement field is calculated by the PIV, where a cross-correlation function is introduced to derive the local motion of beads statistically. Once the displacement field is determined, the mechanical stresses and strains are analysed by the FE method using the calculated displacement as the boundary conditions. In the simulation part, a hyperelastic material model, Mooney–Rivlin, was used to investigate the PAM mechanical response under cellular traction. Numerical results implied that the cell tends to move horizontally by shear traction forces along the plane of the PAM substratum. When a cell is in incipient motion, it presses down its centre against the substratum and lifts up its protrusions at the leading and trailing edges. This is quantitatively verified by the total traction forces calculated from FE analyses and qualitatively observed by the microscopic photograph. The measured traction forces are of the order of 1–20 µN, corresponding to several micrometres of displacement by cellular traction from PIV. All numerical simulations in this study were carefully verified by cross-examining the contact region with the microscopic photographs to ensure their consistency, and the linear and nonlinear material properties with the nano-indentation test to provide baseline information. The combined experimental and numerical approaches in this study should provide some interesting insights into cell traction microscopy.
References
- 1.Balaban N. Q., et al. 2001. Force and focal adhesion assembly: a close relationship studied using elastic micropatterned substrates. Nat. Cell Biol. 3, 466–472. 10.1038/35074532 ( 10.1038/35074532) [DOI] [PubMed] [Google Scholar]
- 2.Gillespie P. G., Walker R. G. 2001. Molecular basis of mechanosensory transduction. Nature 413, 194–202. 10.1038/35093011 ( 10.1038/35093011) [DOI] [PubMed] [Google Scholar]
- 3.Wang H. B., Dembo M., Hanks S. K., Wang Y. L. 2001. Focal adhesion kinase is involved in mechanosensing during fibroblast migration. Proc. Natl Acad. Sci. USA 98, 11 295–11 300. 10.1073/pnas.201201198 ( 10.1073/pnas.201201198) [DOI] [PMC free article] [PubMed] [Google Scholar]
- 4.Schwarz U. S., Balaban N. Q., Riveline D., Bershadsky A., Geiger B., Safran S. A. 2002. Calculation of forces at focal adhesions from elastic substrate data: the effect of localized force and the need for regularization. Biophys. J. 83, 1380–1394. 10.1016/S0006-3495(02)73909-X ( 10.1016/S0006-3495(02)73909-X) [DOI] [PMC free article] [PubMed] [Google Scholar]
- 5.Engler A. J., Griffin M. A., Sen S., Bonnetnann C. G., Sweeney H. L., Discher D. E. 2004. Myotubes differentiate optimally on substrates with tissue-like stiffness: pathological implications for soft or stiff microenvironments. J. Cell Biol. 166, 877–887. 10.1083/jcb.200405004 ( 10.1083/jcb.200405004) [DOI] [PMC free article] [PubMed] [Google Scholar]
- 6.Polte T. R., Eichler G. S., Wang N., Ingber D. E. 2004. Extracellular matrix controls myosin light chain phosphorylation and cell contractility through modulation of cell shape and cytoskeletal prestress. Am. J. Physiol. Cell Physiol. 286, C518–C528. 10.1152/ajpcell.00280.2003 ( 10.1152/ajpcell.00280.2003) [DOI] [PubMed] [Google Scholar]
- 7.Gallant N. D., Michael K. E., Garcia A. J. 2005. Cell adhesion strengthening: contributions of adhesive area, integrin binding, and focal adhesion assembly. Mol. Biol. Cell 16, 4329–4340. 10.1091/mbc.E05-02-0170 ( 10.1091/mbc.E05-02-0170) [DOI] [PMC free article] [PubMed] [Google Scholar]
- 8.Chen C. S. 2008. Mechanotransduction: a field pulling together? J. Cell Sci. 121, 3285–3292. 10.1242/jcs.023507 ( 10.1242/jcs.023507) [DOI] [PubMed] [Google Scholar]
- 9.Martin P. 1997. Wound healing: aiming for perfect skin regeneration. Science 276, 75–81. 10.1126/science.276.5309.75 ( 10.1126/science.276.5309.75) [DOI] [PubMed] [Google Scholar]
- 10.Burton K., Taylor D. L. 1997. Traction forces of cytokinesis measured with optically modified elastic substrata. Nature 385, 450–454. 10.1038/385450a0 ( 10.1038/385450a0) [DOI] [PubMed] [Google Scholar]
- 11.Lee J., Leonard M., Oliver T., Ishihara A., Jacobson K. 1994. Traction forces generated by locomoting keratocytes. J. Cell Biol. 127, 1957–1964. 10.1083/jcb.127.6.1957 ( 10.1083/jcb.127.6.1957) [DOI] [PMC free article] [PubMed] [Google Scholar]
- 12.Munevar S., Wang Y. L., Dembo M. 2001. Traction force microscopy of migrating normal and H-ras transformed 3T3 fibroblasts. Biophys. J. 80, 1744–1757. 10.1016/S0006-3495(01)76145-0 ( 10.1016/S0006-3495(01)76145-0) [DOI] [PMC free article] [PubMed] [Google Scholar]
- 13.Chen Y. W., Dokholyan N. V. 2006. Insights into allosteric control of vinculin function from its large scale conformational dynamics. J. Biol. Chem. 281, 29 148–29 154. 10.1074/jbc.M605512200 ( 10.1074/jbc.M605512200) [DOI] [PubMed] [Google Scholar]
- 14.Defilippi P., Di Stefano P., Cabodi S. 2006. p130Cas: a versatile scaffold in signaling networks. Trends Cell Biol. 16, 257–263. 10.1016/j.tcb.2006.03.003 ( 10.1016/j.tcb.2006.03.003) [DOI] [PubMed] [Google Scholar]
- 15.Clark E. A., King W. G., Brugge J. S., Symons M., Hynes R. O. 1998. Integrin-mediated signals regulated by members of the Rho family of GTPases. J. Cell Biol. 142, 573–586. 10.1083/jcb.142.2.573 ( 10.1083/jcb.142.2.573) [DOI] [PMC free article] [PubMed] [Google Scholar]
- 16.Cox E. A., Sastry S. K., Huttenlocher A. 2001. Integrin-mediated adhesion regulates cell polarity and membrane protrusion through the Rho family of GTPases. Mol. Biol. Cell 12, 265–277. [DOI] [PMC free article] [PubMed] [Google Scholar]
- 17.Chaturvedi L. S., Marsh H. M., Basson M. D. 2007. Src and focal adhesion kinase mediate mechanical strain-induced proliferation and ERK1/2 phosphorylation in human H441 pulmonary epithelial cells. Am. J. Physiol. Cell Physiol. 292, C1701–C1713. 10.1152/ajpcell.00529.2006 ( 10.1152/ajpcell.00529.2006) [DOI] [PubMed] [Google Scholar]
- 18.Ingber D. E., Tensegrity I. I. 2003. How structural networks influence cellular information processing networks. J. Cell Sci. 116, 1397–1408. 10.1242/jcs.00360 ( 10.1242/jcs.00360) [DOI] [PubMed] [Google Scholar]
- 19.Harris A. K. 1984. Tissue-culture cells on deformable substrata: biomechanical implications. J. Biomech. Eng. 106, 19–24. 10.1115/1.3138449 ( 10.1115/1.3138449) [DOI] [PubMed] [Google Scholar]
- 20.Harris A. K., Wild P., Stopak D. 1980. Silicone-rubber substrata: new wrinkle in the study of cell locomotion. Science 208, 177–179. 10.1126/science.6987736 ( 10.1126/science.6987736) [DOI] [PubMed] [Google Scholar]
- 21.Dembo M., Oliver T., Ishihara A., Jacobson K. 1996. Imaging the traction stresses exerted by locomoting cells with the elastic substratum method. Biophys. J. 70, 2008–2022. 10.1016/S0006-3495(96)79767-9 ( 10.1016/S0006-3495(96)79767-9) [DOI] [PMC free article] [PubMed] [Google Scholar]
- 22.Dembo M., Wang Y. L. 1999. Stresses at the cell-to-substrate interface during locomotion of fibroblasts. Biophys. J. 76, 2307–2316. 10.1016/S0006-3495(99)77386-8 ( 10.1016/S0006-3495(99)77386-8) [DOI] [PMC free article] [PubMed] [Google Scholar]
- 23.Sabass B., Gardel M. L., Waterman C. M., Schwarz U. S. 2008. High resolution traction force microscopy based on experimental and computational advances. Biophys. J. 94, 207–220. 10.1529/biophysj.107.113670 ( 10.1529/biophysj.107.113670) [DOI] [PMC free article] [PubMed] [Google Scholar]
- 24.Pelham R. J., Wang Y. L. 1997. Cell locomotion and focal adhesions are regulated by substrate flexibility. Proc. Natl Acad. Sci. USA 94, 13 661–13 665. 10.1073/pnas.94.25.13661 ( 10.1073/pnas.94.25.13661) [DOI] [PMC free article] [PubMed] [Google Scholar]
- 25.Pelham R. J., Wang Y. L. 1999. High resolution detection of mechanical forces exerted by locomoting fibroblasts on the substrate. Mol. Biol. Cell 10, 935–945. [DOI] [PMC free article] [PubMed] [Google Scholar]
- 26.Butler J. P., Tolic-Norrelykke I. M., Fabry B., Fredberg J. J. 2002. Traction fields, moments, and strain energy that cells exert on their surroundings. Am. J. Physiol. Cell Physiol. 282, C595–C605. [DOI] [PubMed] [Google Scholar]
- 27.Yang Z. C., Lin J. S., Chen J. X., Wang J. H. C. 2006. Determining substrate displacement and cell traction fields: a new approach. J. Theor. Biol. 242, 607–616. 10.1016/j.jtbi.2006.05.005 ( 10.1016/j.jtbi.2006.05.005) [DOI] [PubMed] [Google Scholar]
- 28.Chu T. C., Ranson W. F., Sutton M. A. 1985. Applications of digital-image-correlation techniques to experimental mechanics. Exp. Mech. 25, 232–244. 10.1007/BF02325092 ( 10.1007/BF02325092) [DOI] [Google Scholar]
- 29.Brock A., Chang E., Ho C. C., LeDuc P., Jiang X. Y., Whitesides G. M., Ingber D. E. 2003. Geometric determinants of directional cell motility revealed using microcontact printing. Langmuir 19, 1611–1617. 10.1021/la026394k ( 10.1021/la026394k) [DOI] [PubMed] [Google Scholar]
- 30.Berfield T. A., Patel J. K., Shimmin R. G., Braun P. V., Lambros J., Sottos N. R. 2007. Micro- and nanoscale deformation measurement of surface and internal planes via digital image correlation. Exp. Mech. 47, 51–62. 10.1007/s11340-006-0531-2 ( 10.1007/s11340-006-0531-2) [DOI] [Google Scholar]
- 31.Ghosh K., Pan Z., Guan E., Ge S. R., Liu Y. J., Nakamura T., Ren X. D., Rafailovich M., Clark R. A. F. 2007. Cell adaptation to a physiologically relevant ECM mimic with different viscoelastic properties. Biomaterials 28, 671–679. 10.1016/j.biomaterials.2006.09.038 ( 10.1016/j.biomaterials.2006.09.038) [DOI] [PMC free article] [PubMed] [Google Scholar]
- 32.Wang J. H. C., Lin J. S. 2007. Cellular traction force and measurement methods. Biomech. Model. Mechanobiol. 6, 361–371. 10.1007/s10237-006-0068-4 ( 10.1007/s10237-006-0068-4) [DOI] [PubMed] [Google Scholar]
- 33.Wang N., Ostuni E., Whitesides G. M., Ingber D. E. 2002. Micropatterning tractional forces in living cells. Cell. Motil. Cytoskel. 52, 97–106. 10.1002/cm.10037 ( 10.1002/cm.10037) [DOI] [PubMed] [Google Scholar]
- 34.Alpin J. D., Hughes C. 1981. Protein-derivatised glass coverslips for the study of cell-to-substratum adhesions. Anal. Biochem. 113, 144. 10.1016/0003-2697(81)90057-9 ( 10.1016/0003-2697(81)90057-9) [DOI] [PubMed] [Google Scholar]
- 35.Wang Y. L., Pelham R. J. 1998. Preparation of a flexible, porous polyacrylamide substrate for mechanical studies of cultured cells. Methods Enzymol. 298, 489–496. 10.1016/S0076-6879(98)98041-7 ( 10.1016/S0076-6879(98)98041-7) [DOI] [PubMed] [Google Scholar]
- 36.Kandow C. E., Georges P. C., Janmey P. A., Beningo K. A. 2007. Polyacrylamidc hydrogels for cell mechanics: steps toward optimization and alternative uses. Methods Cell Biol. 83, 29–46. 10.1016/S0091-679X(07)83002-0 ( 10.1016/S0091-679X(07)83002-0) [DOI] [PubMed] [Google Scholar]
- 37.Beningo K. A., Lo C. M., Wang Y. L. 2002. Flexible polyacrylamide substrata for the analysis of mechanical interactions at cell-substratum adhesions. Methods Cell Biol. 69, 325–339. 10.1016/S0091-679X(02)69021-1 ( 10.1016/S0091-679X(02)69021-1) [DOI] [PubMed] [Google Scholar]
- 38.Mori N., Chang A. 2004. Introduction to MPIV: PIV toolbox in MATLAB version 0.96. See http://www.oceanwave.jp/softwares/mpiv_doc/index.html. [Google Scholar]
- 39.Jensen A., Sveen J. K., Grue J., Richon J. B., Gray C. 2001. Accelerations in water waves by extended particle image velocimetry. Exp. Fluids 30, 500–510. 10.1007/s003480000229 ( 10.1007/s003480000229) [DOI] [Google Scholar]
- 40.Sveen J. K., Cowen E. A. 2004. Quantitative imaging techniques and their application to wavy flow. In PIV and water waves (eds Grue J., Liu P. L.-F., Pedersen G. K.), ch. 1 Singapore: World Scientific. [Google Scholar]
- 41.Gui L., Merzkirch W. 1996. Generating arbitrarily sized interrogation windows for correlation-based analysis of particle image velocimetry recordings. Exp. Fluids 21, 465–468. 10.1007/BF00189049 ( 10.1007/BF00189049) [DOI] [Google Scholar]
- 42.Gui L., Merzkirch W. 2000. A comparative study of the MQD method and several correlation-based PIV evaluation algorithms. Exp. Fluids 28, 36–44. 10.1007/s003480050005 ( 10.1007/s003480050005) [DOI] [Google Scholar]
- 43.Krige D. G. 1951. A statistical approach to some mine valuations and allied problems at the Witwatersrand. Master's thesis, University of Witwatersrand, Johannesburg, South Africa. [Google Scholar]
- 44.Matheron G. 1963. Principles of geostatistics. Econ. Geol. 58, 1246–1266. 10.2113/gsecongeo.58.8.1246 ( 10.2113/gsecongeo.58.8.1246) [DOI] [Google Scholar]
- 45.Matheron G. 1973. The intrinsic random functions, and their applications. Adv. Appl. Prob. 5, 439–468. 10.2307/1425829 ( 10.2307/1425829) [DOI] [Google Scholar]
- 46.Domke J., Radmacher M. 1998. Measuring the elastic properties of thin polymer films with the atomic force microscope. Langmuir 14, 3320–3325. 10.1021/la9713006 ( 10.1021/la9713006) [DOI] [Google Scholar]
- 47.Engler A. J., Richert L., Wong J. Y., Picart C., Discher D. E. 2004. Surface probe measurements of the elasticity of sectioned tissue, thin gels and polyelectrolyte multilayer films: correlations between substrate stiffness and cell adhesion. Surf. Sci. 570, 142–154. 10.1016/j.susc.2004.06.179 ( 10.1016/j.susc.2004.06.179) [DOI] [Google Scholar]
- 48.Johnson K. L. 1985. Contact mechanics. Cambridge, UK: Cambridge University Press. [Google Scholar]
- 49.Damljanovic V., Lagerholm B. C., Jacobson K. 2005. Bulk and micropatterned conjugation of extracellular matrix proteins to characterized polyacrylamide substrates for cell mechanotransduction assays. Biotechniques 39, 847–851. 10.2144/000112026 ( 10.2144/000112026) [DOI] [PubMed] [Google Scholar]
- 50.Sun Y. J., Akhremitchev B., Walker G. C. 2004. Using the adhesive interaction between atomic force microscopy tips and polymer surfaces to measure the elastic modulus of compliant samples. Langmuir 20, 5837–5845. 10.1021/la036461q ( 10.1021/la036461q) [DOI] [PubMed] [Google Scholar]
- 51.Yeung T., et al. 2005. Effects of substrate stiffness on cell morphology, cytoskeletal structure, and adhesion. Cell. Motil. Cytoskel. 60, 24–34. 10.1002/cm.20041 ( 10.1002/cm.20041) [DOI] [PubMed] [Google Scholar]
- 52.A-Hassan E., Heinz W. F., Antonik M. D., D'Costa N. P., Nageswaran S., Schoenenberger C. A., Hoh J. H. 1998. Relative microelastic mapping of living cells by atomic force microscopy. Biophys. J. 74, 1564–1578. 10.1016/S0006-3495(98)77868-3 ( 10.1016/S0006-3495(98)77868-3) [DOI] [PMC free article] [PubMed] [Google Scholar]
- 53.Ludwig T., Kirmse R., Poole K., Schwarz U. S. 2008. Probing cellular microenvironments and tissue remodeling by atomic force microscopy. Pflug. Arch. Eur. J. Physiol. 456, 29–49. 10.1007/s00424-007-0398-9 ( 10.1007/s00424-007-0398-9) [DOI] [PubMed] [Google Scholar]
- 54.Pearson I., Pickering M. 2001. The determination of a highly elastic adhesive's material properties and their representation in finite element analysis. Finite Elem. Anal. Des. 37, 221–232. 10.1016/S0168-874X(00)00031-7 ( 10.1016/S0168-874X(00)00031-7) [DOI] [Google Scholar]
- 55.Yu Y. S., Zhao Y. P. 2009. Deformation of PDMS membrane and microcantilever by a water droplet: comparison between Mooney–Rivlin and linear elastic constitutive models. J. Colloid Interf. Sci. 332, 467–476. 10.1016/j.jcis.2008.12.054 ( 10.1016/j.jcis.2008.12.054) [DOI] [PubMed] [Google Scholar]
- 56.Sasso M., Palmieri G., Chiappini G., Amodio D. 2008. Characterization of hyperelastic rubber-like materials by biaxial and uniaxial stretching tests based on optical methods. Polym. Test. 27, 995–1004. 10.1016/j.polymertesting.2008.09.001 ( 10.1016/j.polymertesting.2008.09.001) [DOI] [Google Scholar]
- 57.Subhani P. M., Kumar R. K. 2009. A new stored energy function for rubber like materials for low strains. Mech. Adv. Mater. Struct. 16, 402–416. 10.1080/15376490902781167 ( 10.1080/15376490902781167) [DOI] [Google Scholar]
- 58.Kawamura T., Urayama K., Kohjiya S. 2003. Multiaxial deformations of end-linked poly(dimethylsiloxane) networks. 5. Revisit to Mooney–Rivlin approach to strain energy density function. J. Rheol. Soc. Jap. 31, 213–217. 10.1678/rheology.31.213 ( 10.1678/rheology.31.213) [DOI] [Google Scholar]
- 59.Dong Y. R., Lin J. T., Bhattacharyya D. 2005. Determination of critical material parameters for numerical simulation of acrylic sheet forming. J. Mater. Sci. 40, 399–410. 10.1007/s10853-005-6096-0 ( 10.1007/s10853-005-6096-0) [DOI] [Google Scholar]
- 60.Ingber D. E. 2006. Cellular mechanotransduction: putting all the pieces together again. FASEB J. 20, 811–827. 10.1096/fj.05-5424rev ( 10.1096/fj.05-5424rev) [DOI] [PubMed] [Google Scholar]
- 61.Ananthakrishnan R., Ehrlicher A. 2007. The forces behind cell movement. Int. J. Biol. Sci. 3, 303–317. 10.1142/9789812708892_0013 ( 10.1142/9789812708892_0013) [DOI] [PMC free article] [PubMed] [Google Scholar]
- 62.Guo W. H., Wang Y. L. 2007. Retrograde fluxes of focal adhesion proteins in response to cell migration and mechanical signals. Mol. Biol. Cell 18, ( 10.1091/mbc.E07-06-0582) [DOI] [PMC free article] [PubMed] [Google Scholar]
- 63.Hur S. S., Zhao Y., Li Y.-S., Botvinick E., Chien S. 2009. Live cells exert 3-dimensional traction forces on their substrata. Cell. Mol. Bioeng. 2, 425–436. 10.1007/s12195-009-0082-6 ( 10.1007/s12195-009-0082-6) [DOI] [PMC free article] [PubMed] [Google Scholar]
- 64.Xia N., Thodeti C. K., Hunt T. P., Xu Q., Ho M., Whitesides G. M., Westervelt R., Ingber D. E. 2008. Directional control of cell motility through focal adhesion positioning and spatial control of Rac activation. FASEB J. 22, 1649–1659. 10.1096/fj.07-090571 ( 10.1096/fj.07-090571) [DOI] [PubMed] [Google Scholar]
- 65.Tan J. L., Tien J., Pirone D. M., Gray D. S., Bhadriraju K., Chen C. S. 2003. Cells lying on a bed of microneedles: an approach to isolate mechanical force. Proc. Natl Acad. Sci. USA 100, 1484–1489. 10.1073/pnas.0235407100 ( 10.1073/pnas.0235407100) [DOI] [PMC free article] [PubMed] [Google Scholar]
- 66.Gerald C. F., Wheatley P. O. 1984. Applied numerical analysis, 3rd edn. Reading, MA: Addison-Wesley. [Google Scholar]
- 67.Li F., Li B., Wang Q. M., Wang J. H. C. 2008. Cell shape regulates collagen type I expression in human tendon fibroblasts. Cell. Motil. Cytoskel. 65, 332–341. 10.1002/cm.20263 ( 10.1002/cm.20263) [DOI] [PubMed] [Google Scholar]
- 68.Parker K. K., et al. 2002. Directional control of lamellipodia extension by constraining cell shape and orienting cell tractional forces. FASEB J. 16, 1195–1204. 10.1096/fj.02-0038com ( 10.1096/fj.02-0038com) [DOI] [PubMed] [Google Scholar]
- 69.Boguslavsky S., Grosheva I., Landau E., Shtutman M., Cohen M., Arnold K., Feinstein E., Geiger B., Bershadsky A. 2007. p120 catenin regulates lamellipodial dynamics and cell adhesion in cooperation with cortactin. Proc. Natl Acad. Sci. USA 104, 10 882–10 887. 10.1073/pnas.0702731104 ( 10.1073/pnas.0702731104) [DOI] [PMC free article] [PubMed] [Google Scholar]
- 70.Yuasa-Kawada J., Kinoshita-Kawada M., Rao Y., Wu J. Y. 2009. Deubiquitinating enzyme USP33/VDU1 is required for Slit signaling in inhibiting breast cancer cell migration. Proc. Natl Acad. Sci. USA 106, 14 530–14 535. 10.1073/pnas.0801262106 ( 10.1073/pnas.0801262106) [DOI] [PMC free article] [PubMed] [Google Scholar]
- 71.Zeltz C., et al. 2010. Lumican inhibits cell migration through α2β1 integrin. Exp. Cell Res. 316, 2922–2931. 10.1016/j.yexcr.2010.08.002 ( 10.1016/j.yexcr.2010.08.002) [DOI] [PubMed] [Google Scholar]


