Abstract
A novel nanocapillary electrophoretic electrochemical (Nano-CEEC) chip has been developed to demonstrate the possibility of zeptomole-level detection of neurotransmitters released from single living cells. The chip integrates three subunits to collect and concentrate scarce neurotransmitters released from single PC-12 cells, including a pair of targeting electrodes for single cells captured by controlling the surface charge density; a dual-asymmetry electrokinetic flow device for sample collection, pre-concentration and separation in a nanochannel; and an online electrochemical detector for zeptomole-level sample detection. This Nano-CEEC chip integrates a polydimethylsiloxane microchannel for cell sampling and biomolecule separation and a silicon dioxide nanochannel for sample pre-concentration and amperometric detection. The cell-capture voltage ranges from 0.1 to 1.5 V with a frequency of 1–10 kHz for PC-12 cells, and the single cell-capture efficiency is optimized by varying the duration of the applied field. All of the processes, from cell sampling to neurotransmitter detection, can be completed within 15 min. Catecholamines, including dopamine and norepinephrine (noradrenaline) released from coupled single cells, have been successfully detected using the Nano-CEEC chip. A detection limit of 30–75 zeptomoles was achieved, which is close to the levels released by a single neuron in vitro.
Keywords: nanocapillary electrophoretic electrochemical, single cells analysis, electrochemical detection
1. Introduction
Cells play significant roles in life activities, such as metabolism and signal transduction. Highly efficient and sensitive detection of the chemical components of single cells will help explain important physiological processes, such as cell differentiation and metabolism. This knowledge will also be beneficial to the fields of biochemistry, cell biology, neurobiology, medicine, pathology and clinical diagnosis, to name a few [1–3]. Because of the small size of cells (5–100 µm in diameter or nanolitre to femtolitre in volume), the extremely low concentrations of the released biochemicals (zeptomoles to femtomoles) and the rapid response (seconds to sub-milliseconds) of a single cell, a highly sensitive and selective measurement system with the capability of online sampling is necessary for single-cell analysis [4,5]. In recent years, single-cell analysis has gone deep into the subcellular domain to analyse cytoplasts, cellular membranes, vesicles and single molecules [6–8]. The development of single-cell analysis has become a focus in analytical chemistry [9,10]. Among the many measurement systems available, capillary electrophoresis (CE), combined with laser-induced fluorescence, mass spectrometry (MS) or electrochemical detection (ECD) methods, has garnered special attention for its applications in single-cell analysis [11–13] because of its capabilities in analysing biomolecules at minimal levels.
Pushing the detection limit of extracellular concentrations to the single-cell level is useful for studying the spatial and temporal information of cell content [14,15]. A unique nanoscale, optical fibre-based lactate sensor was developed by Zheng et al. [16] to monitor the extracellular lactate concentrations of cancer cells by immobilizing a nanotip with lactate dehydrogenases. The results demonstrated that the fabricated nanosensor had a high spatial resolution, low background interference and a dynamic range (0.06–1 mM) that could successfully detect extracellular lactate concentrations for single HeLa, MCF-7 and human foetal osteoblast cells. However, they required specific enzyme labelling and a lengthy process to calculate the fluorescence intensity between the inside and the outside of living cells.
Matrix-assisted laser desorption-ionization (MALDI) MS is a rapid and sensitive analytical approach that is well suited for obtaining the molecular weights of peptides and proteins from complex samples. MALDI-MS can profile the peptides and proteins from single cells and small tissue samples without the need for extensive sample preparation, except for cell isolation and matrix applications. Li et al. [17] demonstrated MALDI-MS analysis of single peptide-containing vesicles with diameters of 0.8–2.0 mm, corresponding to volumes of 300 al to 8 fl; this is more than one million-fold smaller than the larger neurons originally investigated using this technology. However, the molecular weights of the detected biomolecules were limited to 500–8000 Da.
Furthermore, Woods et al. [18] integrated a 770 nm (inner diameter) capillary coupled with electrochemical electrodes for sampling ultra-low concentrations of subcellular samples from intact single mammalian cells. The separation of cytoplasmic samples from rat phaeochromocytoma cells has been achieved from as little as 8 per cent of the total volume of a single cell. Dopamine (DA) has also been identified and quantified in PC-12 cells using this technique. The average cytoplasmic level of DA in rat phaeochromocytoma cells has been determined to be 400 zeptomoles.
To further improve the cellular biomolecule detection limit, not only is the use of nanoscale biosensors critical, but integrated systems with online sample preparation are important as well. The development of fully integrated lab-on-a-chip or micro-total-analysis-systems (micro-TAS) can solve the problems of conventional capillary-based techniques that lack ease of use for the high-throughput analysis of single cells owing to sophisticated cell-loading procedures [19,20]. As a result, it is critical that sample preparation steps, including cell lysis, molecular extraction and sample separation, are integrated with detection systems for the in situ detection of trace amounts of molecules [21–24].
Omiatek et al. [22] developed a platform to separate, lyse and electrochemically measure the contents of single vesicles using a hybrid capillary-microfluidic device. This device was employed to separate the contents of chemically lysed vesicles and subsequently detect them using end-column carbon-fibre amperometry with a detection limit of 0.5 µM (approx. 10 fmol). This device incorporates sheath-flow at the outlet of the capillary for the chemical lysis of vesicles and subsequent ECD. The effect of sheath-flow on analyte dispersion was characterized using confocal fluorescence microscopy and ECD. However, this sheath-flow system also needed to be aligned with the detector to increase sample concentration effects, and the detection limit was highly dependent on the diffusion radius, as related to the vesicle sizes after cell lysis.
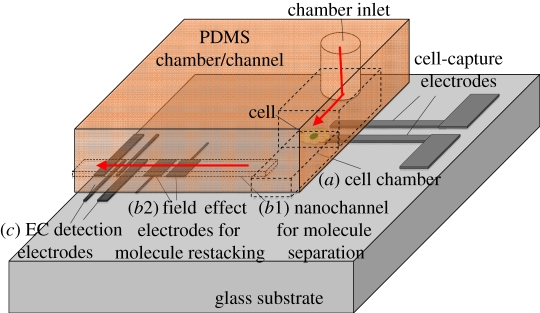
However, lysed cells lose their integrity, making the identification of their specific contents difficult [25]. A goal of modern biology is to understand the molecular mechanisms underlying cellular function; the ability to manipulate and analyse single living cells is crucial for this task. To achieve this goal, it is desirable to integrate online sampling devices to gather almost all of the molecules immediately after cell lysis. Furthermore, it is desirable to integrate pre-concentration mechanisms to accumulate all molecules during molecule transport and also nanodetection for a final, highly sensitive detection step. This work proposes a Nano-CEEC chip that integrates three crucial subunits to collect and concentrate scarce neurotransmitters released from single cells in vivo, including a pair of targeting electrodes for single-cell capture by controlling the surface charge density in a cell chamber (figure 1a), a dual-asymmetry electrokinetic flow (DAEKF) device for sample collection and pre-concentration, electrophoretic separation in a nanochannel (figure 1b) and electrochemical electrodes for the highly sensitive detection of the molecules of interest (figure 1c).
Figure 1.
Schematic of a Nano-CEEC chip designed for living single-cell analysis. Step 1: (a) cell loading, capturing and culturing in the cell chamber. Step 2: (b1,b2) DAEKF separation, including sample collection, nanoseparation and restacking in the nanochannel. Step 3: (c) amperometric detection by the EC detection electrodes.
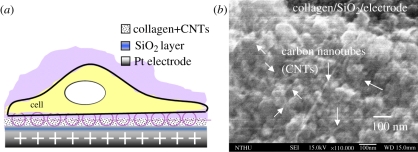
The cell microchamber provides a convenient environment for cell capture and incubation. Figure 2 shows the single-cell capture mechanism enabled by the potentiostatic control of the double-layer charge displacement [26] on the cell-capture electrodes in the cell chamber. The single-cell capture efficiency was optimized by setting the operating voltage at 1.0 V at a frequency of 10 kHz. At the same time, the nanochannel achieved a high pre-concentration efficiency for small biomolecules by using the DAEKF system presented in our previous work [27]. The DAEKF device was used to restack the sample in the nanochannel to prevent the dispersion of samples before ECD. Through the operation of this device, intracellular substances, such as catecholamines released from single PC-12 cells after being excited with an excess of nicotine, are efficiently collected by the electro-osmotic flow (EOF) in the nanochannel for highly efficient separation. The detection limit approaches approximately 72 zeptomoles of DA and 34 zeptomoles of norepinephrine (noradrenaline) (NE) (S/N ratio > 3), which is approximately the total amount released from two to three living cells after nicotine excitation.
Figure 2.
(a) Schematic of the cell-capture mechanism [26] and (b) scanning electron microscopy image of the silicon dioxide electrode surface.
2. Experimental methods
2.1. Chemicals and cell culture
All reagents used were of analytical grade, and the solutions were prepared using deionized water (DI). Before each experiment, all solutions were filtered with 0.22-µm syringe filters (Whatman, NJ, USA). Calcein AM, a cell-viability fluorescent dye, was purchased from Aldrich (LA, USA). Trypan blue (Sigma, MO, USA) was used for indicating viable cells. Nicotine ditartrate solution (Sigma Chemical) was prepared in 10 mM KCl and 3 mM NaCl as well as 10 mM 4-(2-hydroxyethyl)-piperazine-1-ethanesulphonic acid (HEPES) (Sigma) buffer was added to obtain the desired final concentrations. For fluorescence analysis of sample pre-concentration, rhodamine B powder (Aldrich) was prepared at a concentration of 1 nM using 10 mM HEPES as the running buffer, which was adjusted to a pH of 7.5 using 0.1 N NaOH.
Laboratory cultures of PC-12 cells were obtained from the Nanomedical Centre of the National Health Research Institutes (NHRI, Taiwan). The cells were grown in microchannel chambers with phenol red-free RPMI-1640 media (Gibco, Grand Island, NY, USA) supplemented with 10 per cent heat-inactivated equine serum, 5 per cent foetal bovine serum (HyClone Laboratories, Logan, UT, USA) and a 1 per cent penicillin streptomycin solution (Sigma Chemical). The medium was loaded into the cell microchannels using a syringe pump and was replaced every 12 h throughout the lifetimes of all cultures. The cell-loaded Nano-CEEC chip was incubated in a 7 per cent CO2, 100 per cent humidity atmosphere at 37°C in a homemade cell culture tank integrated with an Olympus IX71 epifluorescence microscope for the observation of cell growth. After 24 h of culture, the well-adhered PC-12 cells were stimulated to differentiate with neuron growth factor (NGF) (Sigma Chemical).
2.2. Chip design and fabrication
The L-type channel of the Nano-CEEC chip was created by binding a polydimethylsiloxane (PDMS) microchamber to an SiO2 nanochannel on a glass substrate. This chip was composed of two parts as follows: the upper microchamber (length: 0.5 cm; width: 50 µm; height: 100 µm), which was used to incubate single cells and separate the released neurotransmitters in the culture medium; and the lower nanochannel, which included a trapezoidal transitional reservoir and a straight separation channel (length: 3 cm; width: from 100 gradually down to 50 µm; height: 500 nm) as shown in figure 1. All of the electrodes in this Nano-CEEC chip were fabricated using standard photolithography and lift-off processes on thin metal films pre-deposited on glass substrates. Details of the fabrication of the electrode pair (2500 µm wide with a space of 250 µm) used for sample restacking via DAEKF focusing, and the three-electrode electrochemical sensor (working electrode: 100 µm; reference electrode: 50 µm; counter electrode: 500 µm in width) can be found in our previous work [27]. A pair of cell-capture electrodes was made of platinum (Pt) modified with collagen/single-wall carbon nanotubes (SWCNTs) to promote neural cell function and adhesion on electrode surface [28,29].
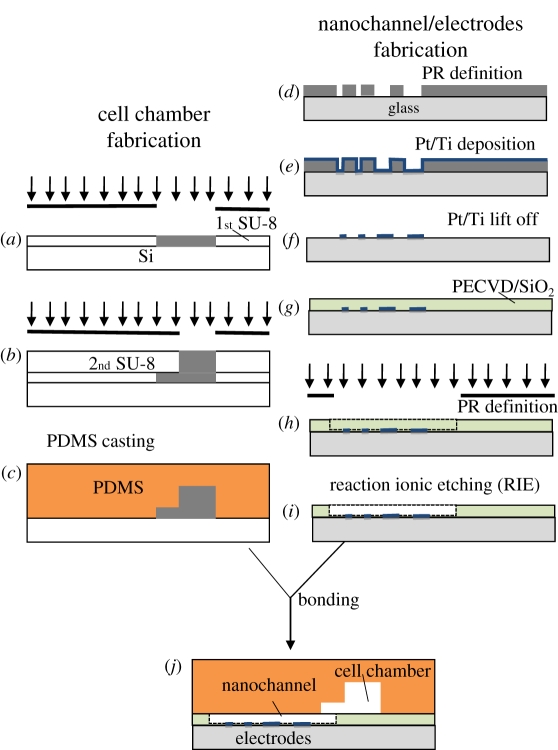
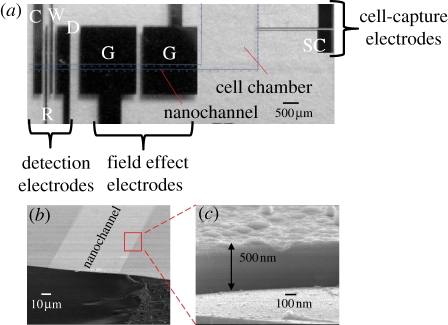
The fabrication process involved a PDMS casting process (a mixture of Sylgard 184 and its curing agent in a ratio of 10 : 1 was poured into the mould at 75°C for 1 h) which used double SU-8 2050 resist structures as the mould (figure 3a–c). The Pt electrodes were fabricated using evaporative deposition and lift-off patterning (figure 3d–f), followed by the plasma-enhanced chemical vapour deposition of silicon dioxide as a passivation layer for the Pt electrode; this also served as a base for the nanochannel fabrication (500 nm in depth) by reactive-ion etching (RIE) (figure 3e). The PDMS and SiO2/glass substrates were first dipped inside acetone in an ultrasonic bath for 5 min, and after rinsing with DI water, they were dipped in 10 per cent H2SO4 solution for 30 min for substrate cleaning. These two substrates were then exposed to oxygen plasma (75 W, 10 sccm oxygen flow rate, and 30, 300 s exposure for PDMS and SiO2/glass substrates, respectively) for replacement of methyl groups by oxygen atoms to reveal dangling bonds. Hydroxide groups were then formed on the surface of the substrates after venting the plasma chamber. The two substrates were then brought into contact with each other for the formation of Si-O-Si covalent bonds for substrate bonding. The different treatment times for the PDMS and SiO2/glass substrates can carry out different hydrophobicity properties to facilitate asymmetrical electro-osmotic flow (AEOF) in the channel region and form strong substrate bond on the rest of the area. Finally, these two chips were bound together after oxygen–plasma surface treatment to form the Nano-CEEC chip. Before bonding, four holes for the sample reservoirs were drilled in the ends of the channels. The averaged surface roughness of RIE-etched nanochannel was 30 ± 18 nm measured from scanning electron microscopy images, which is about 1/16 of the channel height. Details of the Nano-CEEC chip are illustrated in figure 4.
Figure 3.
Fabrication process of the Nano-CEEC chip.
Figure 4.
(a) Photo of the micro/nanofluidic-CEEC chip with the DAEKF system for the analysis of biomolecules released from single cells (SC, single-cell capture electrodes; G, field-effect electrodes; W, working electrode; R, reference electrode; C, counter electrode; D, decoupling electrode) and (b,c) SEM images of the nanochannel.
2.3. Electrophoretic separation and dual-asymmetry electrokinetic flow control procedures
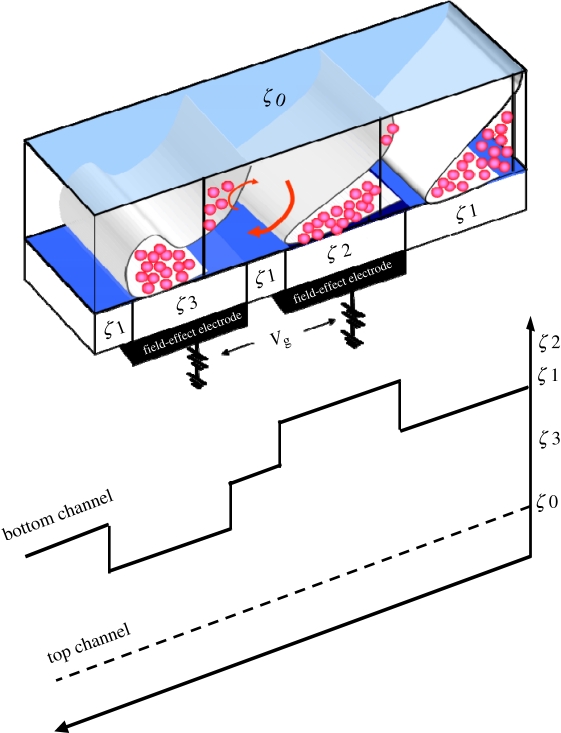
Before all CE tests, the channel was filled with running buffer for 30 min. For sample injection, a high-voltage power supply was set at 100 V for 60 s to ensure that the analytes completely filled the loading channel. Before applying the electric separation field, an electric field for pre-concentration was used to stack the sample on the surface of the DAEKF electrodes in the transitional nanochannel. The principle of DAEKF, powered by electrohydrodynamic-driven flow, is illustrated in figure 5. At the beginning of the nanochannel, there exists an asymmetrical zeta potential between the top (ζ0) and the bottom (ζ1) channel surfaces, and molecules tend to flow downward towards the bottom surface by the action of the AEOF. This downward tendency is further enhanced and restacked by a pair of field-effect electrodes, as shown. The first electrode provides an even higher surface zeta potential (ζ2) for an increased capture efficiency of most of the molecules (approx. 80–90% of the molecules can be brought close to the bottom surface when combined with AEOF). However, the separation band is broadened because of this action. As a result, the second electrode produces a relatively lower zeta potential (ζ3) to retard the molecules by restacking them in the direction of the streamlines. Thus, the dispersion effect of the molecules is restricted in both the streamline and azimuthal directions. The volume of the analytes was then controlled by applying potentials until separation occurred. An electric field of 150 V cm−1 was applied to the buffer reservoir for separation while the Pt decoupler was kept at ground (the first electrode in the detector). To generate the EOF, a high voltage was applied to a Pt electrode immersed in the starting reservoir, and the ground electrode was connected to the decoupling electrode (D). The electrodes were connected to two power supplies (Series 110, Bertan, Hicksville, USA and CZE1000R, Spellman, Plainview, USA).
Figure 5.
Schematics showing the flow-field evolution for DAEKF electrophoresis manipulated by surface zeta potentials in the nanochannel (solid arrows represent the analyte flow direction, and ζ2 > ζ1 > ζ3 > ζ0).
2.4. Potentiostatic control for cell capture and electrochemical detection
The adhesion and spreading of single cells on the pair of Pt cell-capture electrodes caused a displacement of counterions from the electric double layer, leading to a broad variation in positive and negative surface charges. The charge densities varied from −16.0 to +8.0 mC cm−2 when the electrodes were applied at an operating voltage of 0.1–1.5 V with a frequency of 1–10 kHz. The compensating current, reflecting the dynamics of the adhesive contact formation and subsequent spreading of a cell, was recorded to indicate the cell status for further action.
In the Nano-CEEC experiments, amperometric detection was performed using a CHI-760B bipotentiostat system (CHI Instruments, Austin, TX, USA) as a three-electrode electrochemical analyser. The oxidation current of analytes was recorded with a time resolution of 0.1 s, and the detection potential was set at a constant potential of 750–800 mV with reference to the Pt pseudoreference electrode. The output signals from the detector were sampled at 30 Hz and digitally filtered to remove high-frequency noise. All ECD signals were collected at least threefold higher than that of the noise floor and recorded, processed and stored directly on a computer.
3. Results and discussion
3.1. Single-cell capture and stimulation
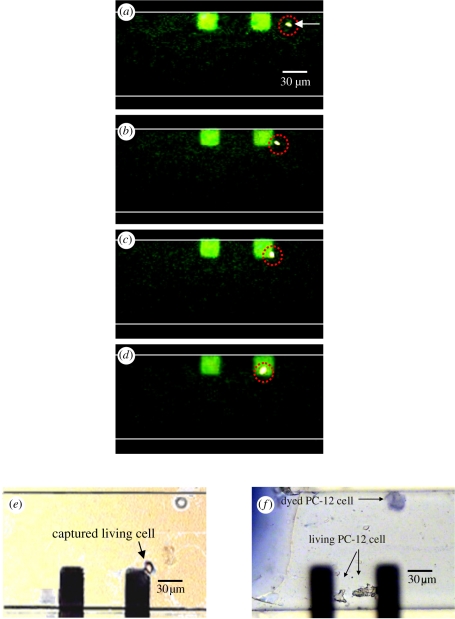
Continuous images of the cell-capture process on the surface-modified electrodes in the microchannel are shown in figure 6a–d. Single-cell capture events were recorded using an epifluorescence microscope (Olympus BX51, Tokyo, Japan) with a cooled charge-coupled device camera (CoolSnap HQ, CA, USA). The PC-12 cells were suspended in HEPES buffer at a density of 100 cells µl−1, and the cell viability was determined using a fluorescent dye (calcein AM, 2 µg ml−1). Before the cells were loaded, a 10 kHz, 1 − Vp-p voltage was applied across the pair of electrodes. Electrochemical methods offer the possibility of direct capture of individual cells [30,31] by potentiostatic control of the double-layer charge displacement when a cell is close to the capture electrodes. The cells were attracted to the cell-capture areas because of the charge displacement of the cell membrane potential polarization; the cells subsequently sank onto the collagen–SWCNT surface of the electrode. Carbon nanotubes (CNTs) are a strong, flexible, as well as a very conductive material, and the surface can be functionalized with different molecules, all of which are important properties for CNTs to be applied as a biomaterial for neural cells interface/growth [28,29]. In our system, a pair of cell-capturing electrodes was made of Pt modified with collagen/SWCNTs to promote neural cell function and cell adhesion on the electrodes.
Figure 6.
(a–d) Cell-capture sequence on modified Pt electrodes by potentiostatic control of the induced surface-charge density (calcein AM was used to identify cell viability). Cell density was 100 cells µl−1, and the flow rate was 5 µl min−1 from right to left. (e) A living PC-12 cell that has just been seeded on one of the electrodes and (f) the same cell after 2 days of incubation with added NGF. Here, it should be noted that trypan blue, a living-membrane non-permeable dye, was used to assess the cells after treatment with a 3 mM concentration of nicotine.
In this experiment, the trapping yield (the ratio of the cells captured on the electrodes to the sum of cells in the sample waste reservoir) increased with an increase in potential, which in turn caused an occurance of electrohydrodynamic flow on the electrode surface. A 60 per cent capture probability was achieved for a single cell in 10 min operation at a flow rate of 5 µl min−1. Unbound cells were then removed by applying a constant 10 µl min−1 wash for 3 min.
After a 48 h culture with NGF to increase nicotine-stimulated responses, including the release of catecholamines, PC-12 cells were stimulated by a 3 mM concentration of nicotine added in a K+-balanced salt solution with HEPES buffer [32]. For easier observation and counting of viable cells, the cell bodies were stained with trypan blue to characterize cell viability after nicotine treatment; the results are shown in figure 5e,f.
3.2. Analyte restacking by dual-asymmetry electrokinetic flow in the nanochannel
Under AEOF conditions [33], the EOF can be considered as a two-dimensional gradient shear-flow across the channel depth when the channel has a large aspect ratio (width ≫ depth). With an additional external field applied to the bottom channel surface, AEOF results in a rotational flow in the channel. Through the pull and push effects of the first and second field-effect electrodes with applied potentials, the samples can be condensed not only in the vertical direction but also in the streamline direction. Details of the simulation and operation of our DAEKF system were previously presented [27].
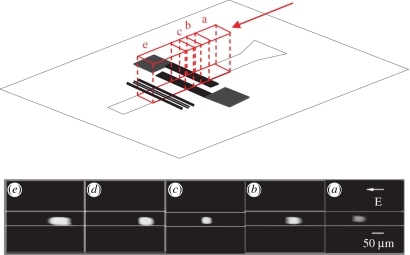
To illustrate the sample concentration effect by DAEKF in the nanochannel, rhodamine B (a neutral dye at 10 µM in 10 mM HEPES buffer solutions at pH = 7.5) was run through the Nano-CEEC chip; the fluorescent intensities of five specific positions for sample concentration are depicted in figure 7. The separation voltage was set to 150 V cm−1, and the pair of field-effect electrodes was set to voltages of ±50 V. The highest fluorescence intensity can be observed in figure 7e after the DAEKF restacking process of samples in the nanochannel.
Figure 7.
Fluorescence image of rhodamine B showing the restacking effect of the DAEKF system in a nanochannel in five different regions. Region (a): a two-dimensional AEOF. Region (b): the AEOF encounters a strong pulling force by the first external electric field. Regions (c,d): a strong pushing effect is generated by the incorporation of the AEOF and the second electric field. When this flow exits the region (d) and re-enters the AEOF in the next region (e), an effect similar to that in the former region (b) appears again while a strong downward rotational flow occurs.
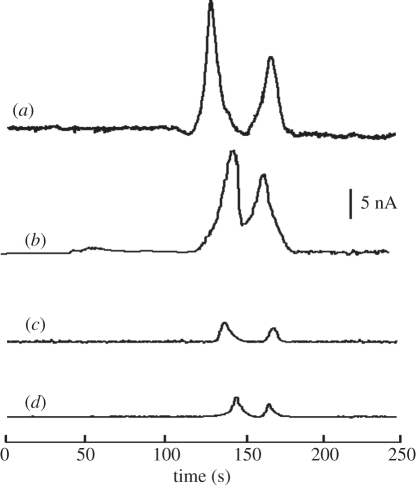
This DAEKF effect actuated inside the nanochannel caused the analytes to easily pass the Nernst diffusion layer onto the electric double layer near the detector surface and thus greatly enhanced the detectability of the samples. To demonstrate how the DAEKF effect could benefit sample concentration for electrochemical analysis of neurotransmitters in micro- or nanochannels, amperometric detection was performed; the results are shown in figure 8. DA at a concentration of 1 µM and a catechol (CAT) mixture were run in the micro- or nanochannel with different running conditions under an electric field of 300 V cm−1. For amperometric detection, the working electrode was set at an oxidative potential (+0.8 V) versus the Pt pseudoreference electrode. The DAEKF effect improved the signal intensity (redox limit current) from the micro- and nanochannels with a signal 12.5 and 9.8 times larger than that of conventional EOF channels, respectively. However, the molecular detection efficiency (MDE = Qeff/Vtotal; Qeff is the effective reaction coulomb number; Vtotal is the internal volume of the samples occupied in the channel) of the micro- and nanochannels with DAEKF enhancement was calculated to be 7 and 18 times that of traditional EOF channels, respectively. This result shows that the nanochannel's MDE is 2.5 times larger than that of the microchannel for sample pre-concentration, which can be attributed to the shorter diffusion lengths between the detector and the samples inside the nanochannel. However, the extremely small internal volume of the nanochannel might result in increased wall interactions with samples, which could decrease the peak signal value. This phenomenon may cause the peak to tail and the width to increase with long migration times. We expected this phenomenon may be owing to the surface roughness effects on the transportation speed of bulk solution [34] and lateral diffusion [35] properties. The former may reduce the speed of bulk solution and the later may cause some dispersion phenomena, and the combined effect will reduce the plate number for separation. In our nanochannel experiment, we did observe some band broadening/tailing phenomena; however, the measured plate number was 11 000, which was considered enough for the current application.
Figure 8.
Detection of 1 M dopamine and catechol under four different electrokinetic conditions. (a) Asymmetric EOF combined with field-effect control (DAEKF) in a 10 µm channel. (b) Asymmetric EOF combined with field-effect control (DAEKF) in a 500 nm channel. (c) Traditional EOF in a 10 µm channel. (d) Traditional EOF in a 500 nm channel.
3.3. Analysis of single-cell biomolecule release using the dual-asymmetry electrokinetic flow Nano-CEEC chip
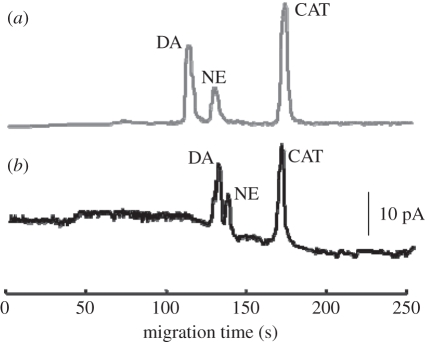
After characterization of the nanoscale effects of the DAEKF system, the DAEKF Nano-CEEC chip was used to detect low concentrations of neurotransmitters released from single cells. The experiment began with loading culture medium into the nanochannel to obtain a background signal. To simulate the detection of neurotransmitters directly released from living PC-12 cells, a standard mixture solution, including DA, NE and CAT, was added to the PC-12 cell culture medium at final concentrations of 10, 50 and 30 nM, respectively. Figure 9 illustrates that the Nano-CEEC chip exhibited a good separation performance by clearly separating the low concentration mixture; the CA was then selected as an internal standard for quantifying DA and NE. Moreover, the DA and NE levels, determined by the cell culture media, maintained the same signal ratios as those in the HEPES buffer, thus ensuring a relatively accurate measurement of DA and NE directly released from single PC-12 cells when using the Nano-CEEC chip.
Figure 9.
Electropherograms obtained using a solution of 10 nM dopamine, 50 nM norepinephrine (noradrenaline) and 30 nM catechol in (a) 10 mM HEPES buffer (grey line) using the DAEKF Nano-CEEC nanochannel and in (b) cell culture medium (black line).
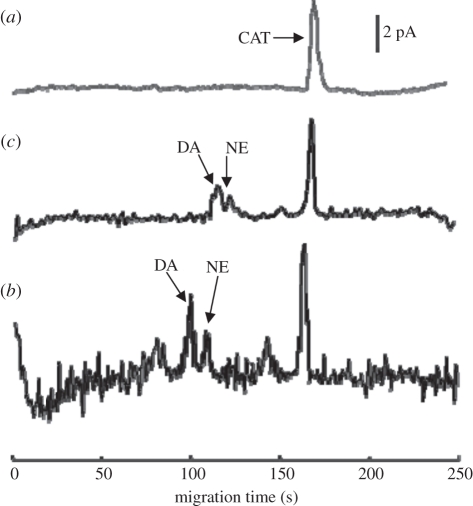
Figure 10 compares the electropherograms from the culture medium extracts of released and lysed components from living PC-12 single cells (two to three cells in a cell-capture channel). The experiments were repeated three times, and the amounts of DA and NE released from PC-12 cells after nicotine stimulation were measured as 68, 72, 75 zmol and 33, 30, 38 zmol, respectively. Catecholamines obtained from cell lysates are also compared in figure 10, obtained by adding 100 mM KCl to the cell culture. The detected DA and NE signals from the released/lysed components of the two to three living cells were estimated to be approximately 1/1.6 nM and 0.6/0.9 nM, respectively, when compared with that of a 3 nM concentration standard of CAT. However, the cell lysis culture medium contributed more background signal, owing to the exhaust of cell contents after lysis; this increased signal produced a worse signal-to-noise ratio than from the living cells after stimulation.
Figure 10.
Electropherograms for three different media as follows: (a) catechol in HEPES buffer as the standard indictor (5 nM), (b) culture medium from living PC-12 cells after nicotine stimulation (two to three cells), and (c) culture medium from PC-12 cells after cell lysis by a high-concentration KCl solution.
4. Conclusion
A novel Nano-CEEC chip with amperometric detection was developed and presents a simple and effective means for directly capturing and analysing biomolecule release from single cells in an integrated fashion. The use of electric fields and cell isolation chambers provided a sufficient cell adhesion and incubation environment to withstand the subsequent flows used for rinsing and reagent introduction. The DAEKF effect, in combination with nanofluidic EC detection, was demonstrated to have the ability to sample biomolecules directly released from single cells with a high sensitivity and resolution. The system was successfully used to determine the levels of DA and NE released from single PC-12 cells after nicotine stimulation; the DA and NE levels released from individual PC-12 cells were quantified as 72 and 34 zmol, respectively. This device also provides a novel platform for future single cell–cell interaction studies and for the development of a bioelectronic interface for fundamental studies of single-cell activities.
Acknowledgements
We appreciate the financial support from the National Nanoscience and Nanotechnology Programme, National Science Council, Taiwan, through grants NSC-99-2120-M-007-009 and NSC-98-2627-M-007-003. We also appreciate the personnel funding and facilities provided by the National Health Research Institute, Taiwan.
References
- 1.El-Ali J., Sorger P. K., Jensen K. F. 2006. Cells on chips. Nature 442, 403–411 10.1038/nature05063 (doi:10.1038/nature05063) [DOI] [PubMed] [Google Scholar]
- 2.Amantonico A., Urban P. L., Zenobi R. 2010. Analytical techniques for single-cell metabolomics: state of the art and trends. Anal. Bioanal. Chem. 398, 2493–2504 10.1007/s00216-010-3850-1 (doi:10.1007/s00216-010-3850-1) [DOI] [PubMed] [Google Scholar]
- 3.Guihen E., O'Connor W. T. 2010. Capillary and microchip electrophoresis in microdialysis: recent applications. Electrophoresis 31, 55–64 10.1002/elps.200900467 (doi:10.1002/elps.200900467) [DOI] [PubMed] [Google Scholar]
- 4.Borland L. M., Kottegoda S., Phillips S., Allbritton N. L. 2008. Chemical analysis of single cells. Annu. Rev. Anal. Chem. 1, 191–227 10.1146/annurev.anchem.1.031207.113100 (doi:10.1146/annurev.anchem.1.031207.113100) [DOI] [PubMed] [Google Scholar]
- 5.Gao J., Yin X. F., Fang Z. L. 2004. Integration of single cell injection, cell lysis, separation and detection of intracellular constituents on a microfluidic chip. Lab Chip 4, 47–52 10.1039/b310552k (doi:10.1039/b310552k) [DOI] [PubMed] [Google Scholar]
- 6.Stuart J. N., Sweedler J. V. 2003. Capillary electrophoresis and the single cell. LC-GC Europe 16, 22–29 [Google Scholar]
- 7.Wang D., Bodovitz S. 2010. Single cell analysis: the new frontier in ‘omics’. Trends Biotechnol. 28, 281–290 10.1016/j.tibtech.2010.03.002 (doi:10.1016/j.tibtech.2010.03.002) [DOI] [PMC free article] [PubMed] [Google Scholar]
- 8.Sims C. E., Allbritton N. L. 2007. Analysis of single mammalian cells on-chip. Lab Chip 7, 423–440 10.1039/b615235j (doi:10.1039/b615235j) [DOI] [PubMed] [Google Scholar]
- 9.Salieb-Beugelaar G. B., Simone G., Arora A., Philippi A., Manz A. 2010. Latest developments in microfluidic cell biology and analysis systems. Anal. Chem. 82, 4848–4864 10.1021/ac1009707 (doi:10.1021/ac1009707) [DOI] [PubMed] [Google Scholar]
- 10.Swanek F. D., Ferris S. S., Ewing A. G. 1997. Capillary electrophoresis for the analysis of single cells. In Electrochemical mass spectrometric and radiochemical detection handbook of capillary electrophoresis, pp. 495–521 Boca Raton, FL: CRC Press. [Google Scholar]
- 11.Lantz A. W., Bao Y., Armstrong D. W. 2007. Single-cell detection: test of microbial contamination using capillary electrophoresis. Anal. Chem. 79, 1720–1724 10.1021/ac061770h (doi:10.1021/ac061770h) [DOI] [PubMed] [Google Scholar]
- 12.Legendre L. A., Morris C. J., Bienvenue J. M., Barron A., McClure R., Landers J. P. 2008. Toward a simplified microfluidic device for ultra-fast genetic analysis with sample-in/answer-out capability. JALA 13, 351–360 10.1016/j.jala.2008.08.001 (doi:10.1016/j.jala.2008.08.001) [DOI] [Google Scholar]
- 13.Bao N., Wang J., Lu C. 2008. Recent advances in electric analysis of cells in microfluidic systems. Anal. Bioanal. Chem. 391, 933–942 10.1007/s00216-008-1899-x (doi:10.1007/s00216-008-1899-x) [DOI] [PubMed] [Google Scholar]
- 14.Chao T.-Z., Ros A. 2008. Microfluidic single-cell analysis of intracellular compounds. J. R. Soc. Interface 5, 139–150 10.1098/rsif.2008.0233.focus (doi:10.1098/rsif.2008.0233.focus) [DOI] [PMC free article] [PubMed] [Google Scholar]
- 15.Klauke N., Smith G., Cooper J. M. 2007. Microfluidic systems to examine intercellular coupling of pairs of cardiac myocytes. Lab Chip 7, 731–739 10.1039/b706175g (doi:10.1039/b706175g) [DOI] [PubMed] [Google Scholar]
- 16.Zheng X. T., Yang H. B., Li C. M. 2010. Optical detection of single cell lactate release for cancer metabolic analysis. Anal. Chem. 82, 5082–5087 10.1021/ac100074n (doi:10.1021/ac100074n) [DOI] [PubMed] [Google Scholar]
- 17.Li L., Garden R. W., Sweedler J. V. 2000. Single-cell MALDI: a new tool for direct peptide profiling. TIBTECH APRIL 18, 151–160 [DOI] [PubMed] [Google Scholar]
- 18.Woods L. A., Powell P. R., Paxon T. L., Ewing A. G. 2005. Analysis of mammalian cell cytoplasm with electrophoresis in nanometer inner diameter capillaries. Electroanalysis 17, 1192–1197 10.1002/elan.200403240 (doi:10.1002/elan.200403240) [DOI] [PMC free article] [PubMed] [Google Scholar]
- 19.Price A. K., Culbertson C. T. 2007. Chemical analysis of single mammalian cells with microfluidics. Anal. Chem. 79, 2615–2621 10.1021/ac071891x (doi:10.1021/ac071891x) [DOI] [PubMed] [Google Scholar]
- 20.Spegel C., Heiskanen A., Skjolding L. H. D., Emnéus J. 2008. Chip based electroanalytical systems for cell analysis. Electroanalysis 20, 680–702 10.1002/elan.200704130 (doi:10.1002/elan.200704130) [DOI] [Google Scholar]
- 21.Pratt E. D., Huang C., Hawkins B. G., Gleghorn J. P., Kirby B. J. 2011. Rare cell capture in microfluidic devices. Chem. Eng. Sci. 66, 1508–1522 10.1016/j.ces.2010.09.012 (doi:10.1016/j.ces.2010.09.012) [DOI] [PMC free article] [PubMed] [Google Scholar]
- 22.Omiatek D. M., Santillo M. F., Heien M. L., Ewing A. G. 2009. A hybrid capillary-microfluidic device for the separation, lysis, and electrochemical detection of vesicles. Anal. Chem. 81, 2294–2302 10.1021/ac802466g (doi:10.1021/ac802466g) [DOI] [PMC free article] [PubMed] [Google Scholar]
- 23.Kim J., Johnson M., Hilla P., Gale B. K. 2009. Microfluidic sample preparation: cell lysis and nucleic acid purification. Integr. Biol. 1, 574–586 10.1039/b905844c (doi:10.1039/b905844c) [DOI] [PubMed] [Google Scholar]
- 24.Napoli M., Eijkel J. C. T., Pennathur S. 2010. Nanofluidic technology for biomolecule applications: a critical review. Lab Chip 10, 957–985 10.1039/b917759k (doi:10.1039/b917759k) [DOI] [PubMed] [Google Scholar]
- 25.Wang Y., Chen Z. Z., Li Q. L. 2010. Microfluidic techniques for dynamic single-cell analysis. Microchim. Acta 168, 177–195 10.1007/s00604-010-0296-2 (doi:10.1007/s00604-010-0296-2) [DOI] [Google Scholar]
- 26.Svetlicić V., Ivosević N., Kovac S., Zutić V. 2003. Charge displacement by adhesion and spreading of a cell. Langmuir 19, 1580–1585 10.1021/la0263209 (doi:10.1021/la0263209) [DOI] [PubMed] [Google Scholar]
- 27.Wu R. G., Yang C. S., Lian C. K., Cheing C. C., Tseng F. G. 2009. Dual-asymmetry electrokinetic flow focusing for pre-concentration and analysis of catecholamines in CE electrochemical nanochannels. Electrophoresis 30, 2523–2531 10.1002/elps.200800809 (doi:10.1002/elps.200800809) [DOI] [PubMed] [Google Scholar]
- 28.Zhang L., Thomas J. 2009. Nanotechnology and nanomaterials: promises for improved tissue regeneration. Nano Today 4, 66–80 10.1016/j.nantod.2008.10.014 (doi:10.1016/j.nantod.2008.10.014) [DOI] [Google Scholar]
- 29.Voge C. M., Stegemann J. P. 2011. Carbon nanotubes in neural interfacing applications. J. Neural Eng. 8, 011001. 10.1088/1741-2560/8/1/011001 (doi:10.1088/1741-2560/8/1/011001) [DOI] [PubMed] [Google Scholar]
- 30.Zutic V., Kovac S., Tomaic J., Svetlicic V. 1993. Heterocoalescence between dispersed organic microdroplets and a charged conductive interface. J. Electroanal. Chem. 349, 173–186 10.1016/0022-0728(93)80171-D (doi:10.1016/0022-0728(93)80171-D) [DOI] [Google Scholar]
- 31.Evans E., Needham D. 1987. Physical properties of surfactant bilayer membranes: thermal transitions, elasticity, rigidity, cohesion, and colloidal interaction. J. Phys. Chem. 87, 4219–4228 10.1021/j100300a003 (doi:10.1021/j100300a003) [DOI] [Google Scholar]
- 32.Kumar G. K., Overholt J. L., Bright G. R., Hui K. Y., Lu H., Gratzl M., Prabhakar N. R. 1998. Release of dopamine and norepinephrine by hypoxia from PC-12 cells. Am. J. Physiol. Cell. Physiol. 274, 1592–1600 [DOI] [PubMed] [Google Scholar]
- 33.Andreev V. P., Dubrovsky S. G., Stepanov Y. V. 1997. Mathematical modeling of capillary electrophoresis in rectangular channels. J. Microcolumn Sep. 9, 443–450 (doi:10.1002/(SICI)1520-667X(1997)9:6<443::AID-MCS1>3.0.CO;2-1) [DOI] [Google Scholar]
- 34.Qiao R. 2007. Effects of molecular level surface roughness on electroosmotic flow. Microfluid Nanofluid. 3, 33–38 10.1007/s10404-006-0103-x (doi:10.1007/s10404-006-0103-x) [DOI] [Google Scholar]
- 35.Sparreboom W., van den Berg A., Eijkel J. C. T. 2010. Transport in nanofluidic systems: a review of theory and applications. New J. Phys. 12, 015004. 10.1088/1367-2630/12/1/015004 (doi:10.1088/1367-2630/12/1/015004) [DOI] [Google Scholar]


